Copyright
©The Author(s) 2020.
World J Gastroenterol. Aug 21, 2020; 26(31): 4680-4693
Published online Aug 21, 2020. doi: 10.3748/wjg.v26.i31.4680
Published online Aug 21, 2020. doi: 10.3748/wjg.v26.i31.4680
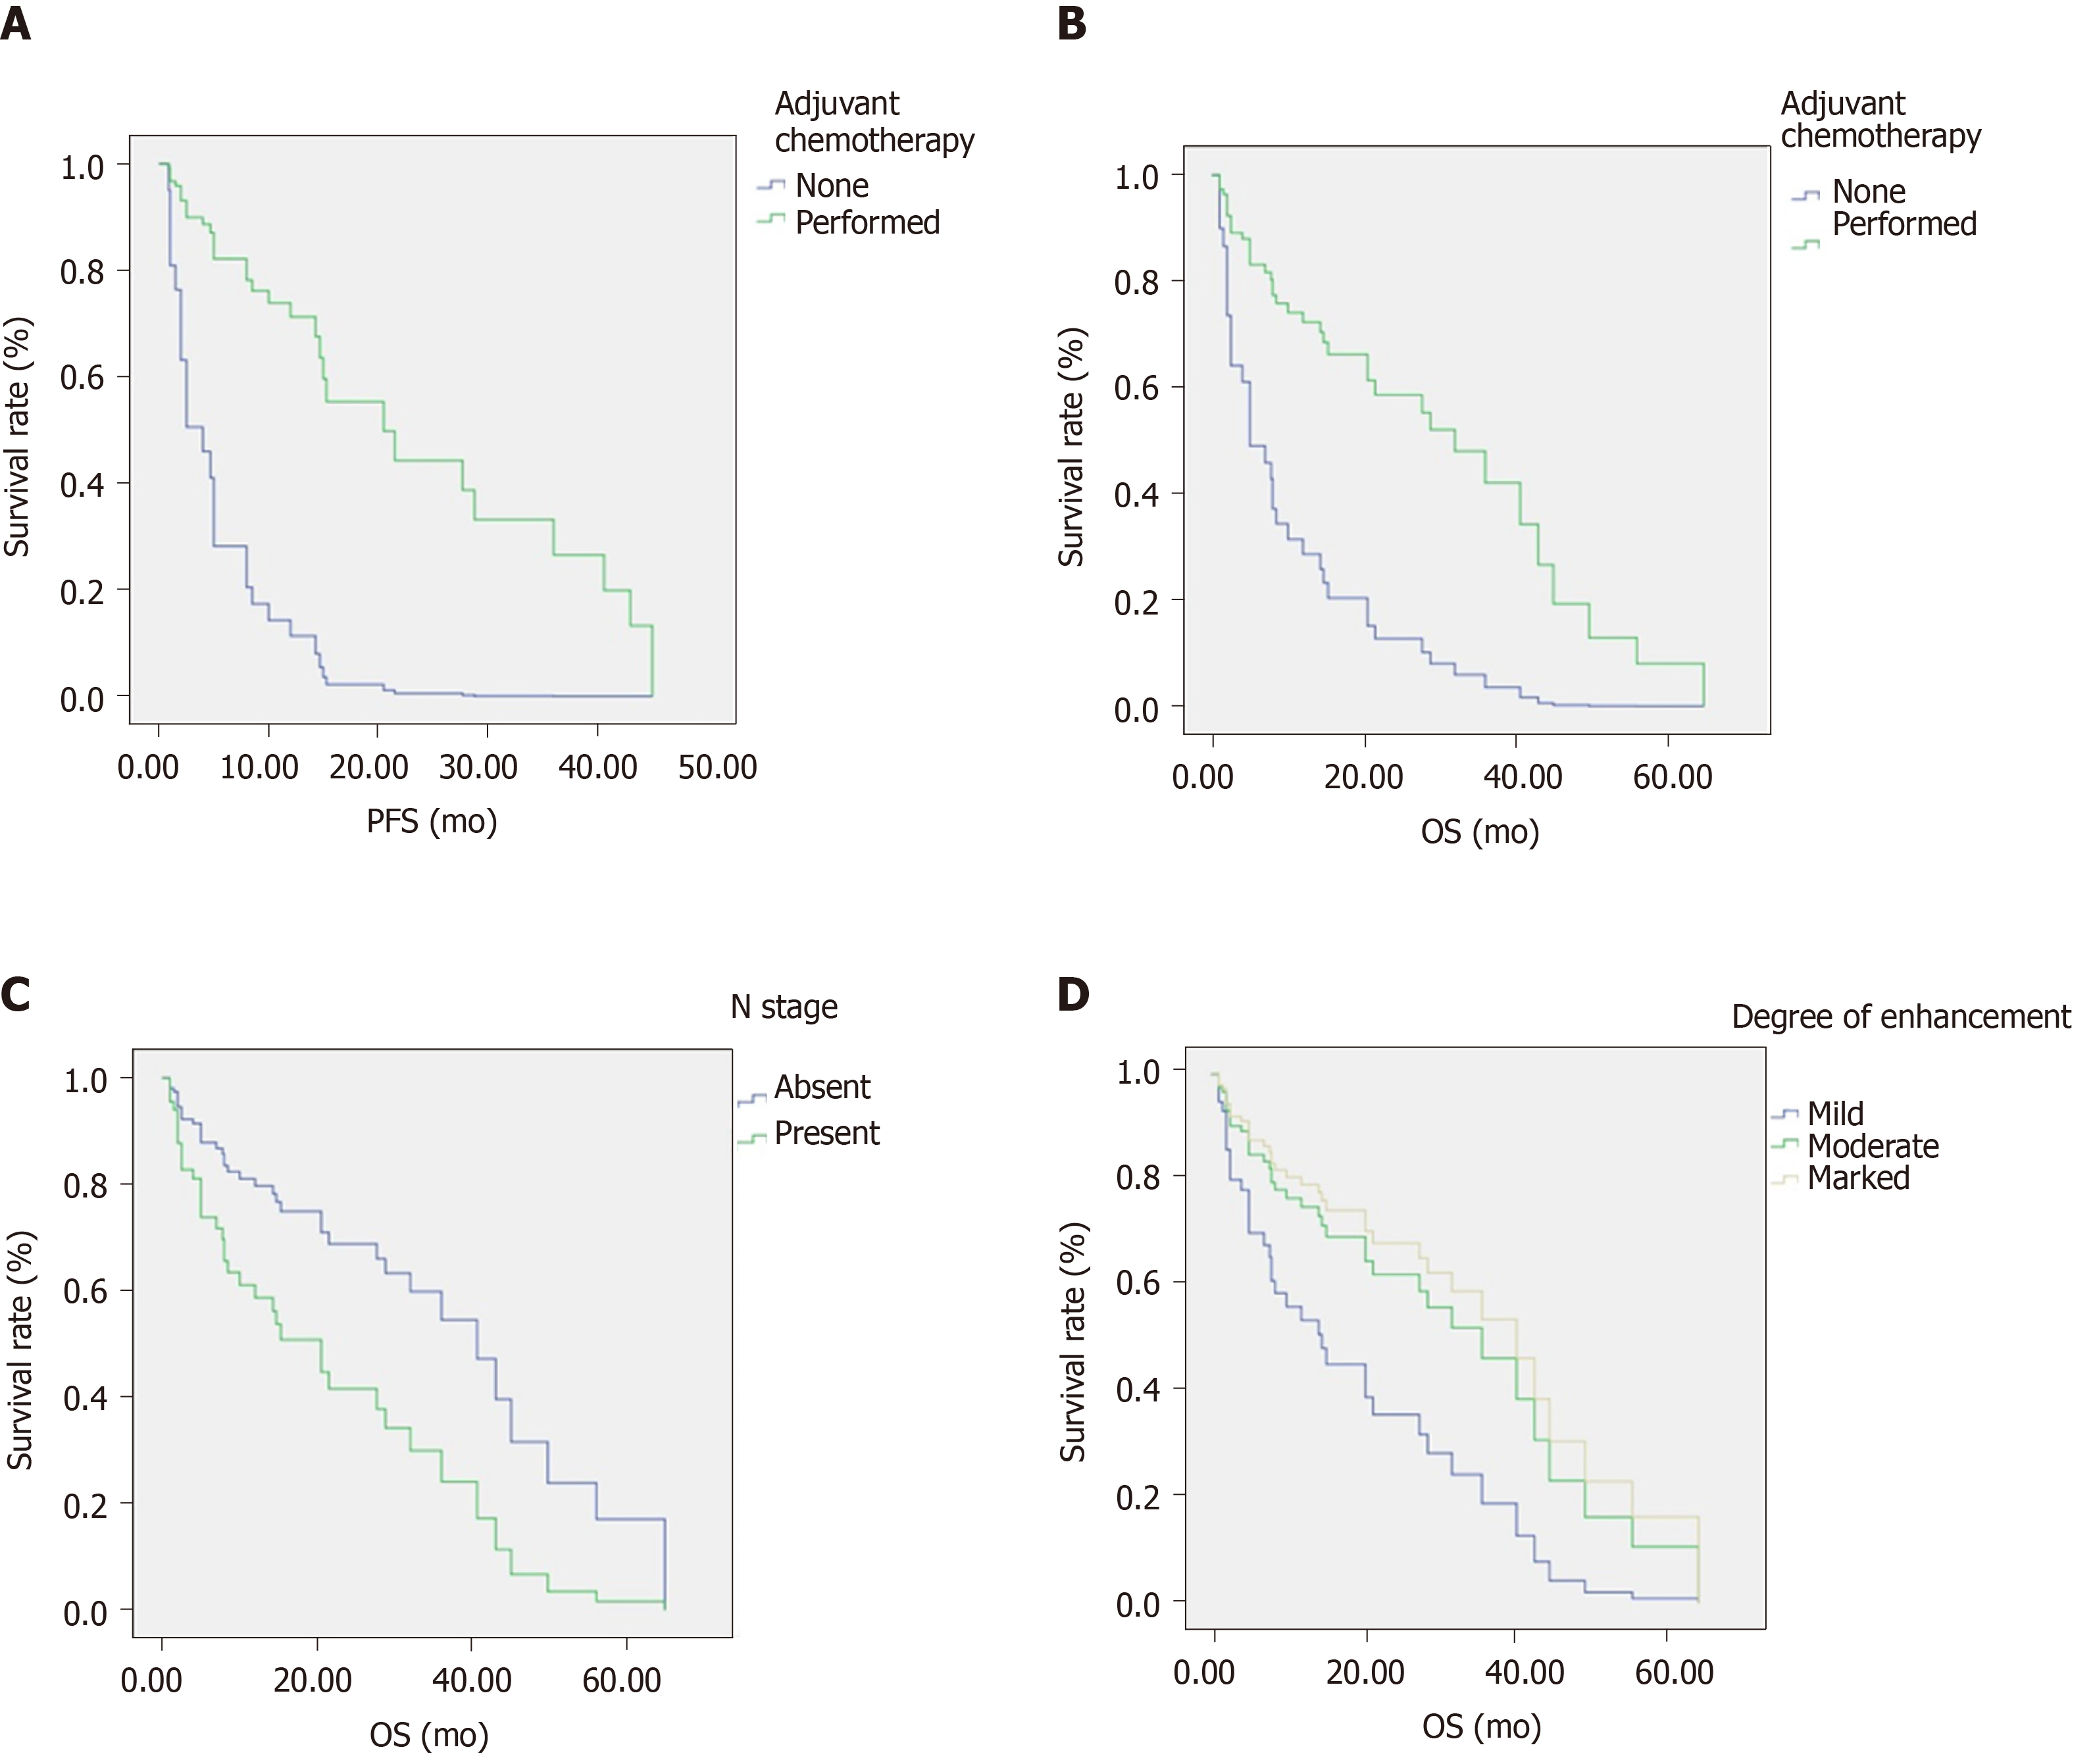
Figure 1 Kaplan-Meier univariate analysis.
A and B: Progression-free survival (A) and overall survival (OS) (B) according to adjuvant chemotherapy; C and D: OS according to N stage (C) and degree of enhancement (D). OS: Overall survival; PFS: Progression-free survival.
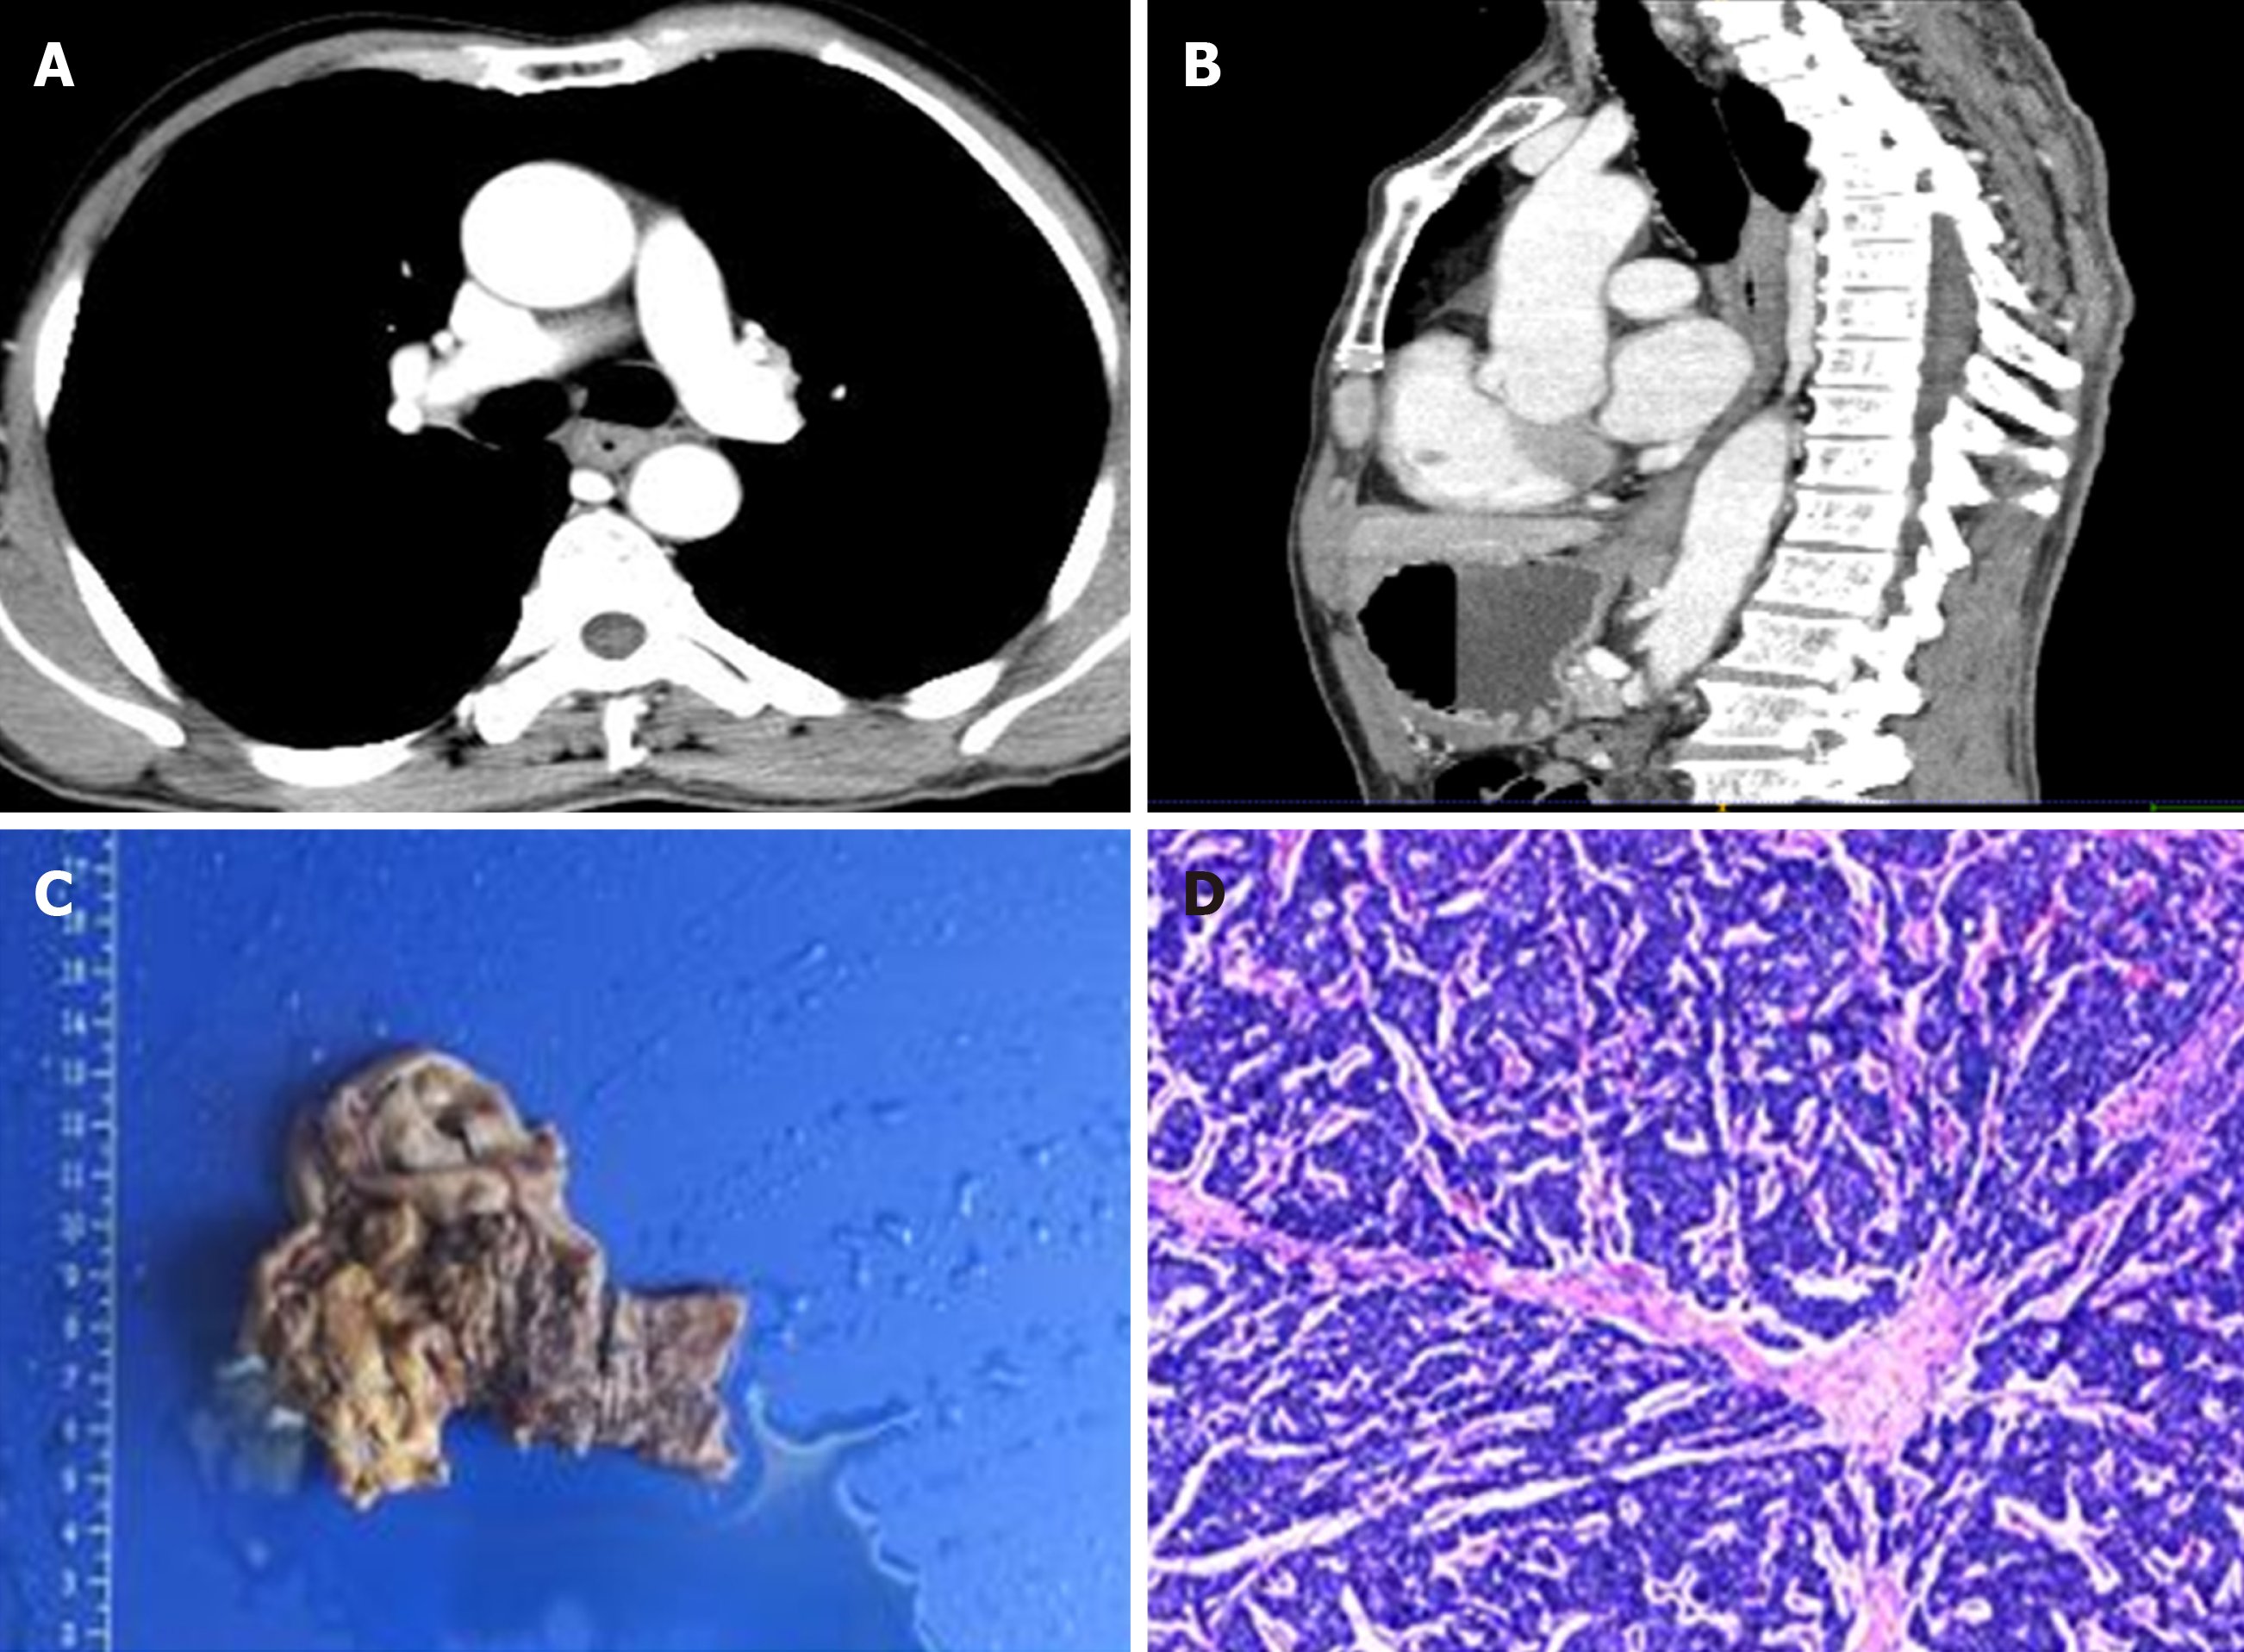
Figure 2 A typical case of esophageal neuroendocrine carcinoma.
A: Axial contrast-enhanced computed tomography image of a 67-year-old man with mildly enhanced esophageal neuroendocrine carcinoma in the middle segment of the esophagus (cT2N0M0). The patient showed a good treatment effect from postoperative adjuvant chemoradiotherapy with 26.13 mo and 35.6 mo of progression-free survival and overall survival, respectively; B: Sagittal-enhanced image of the patient. The tumor was 20 mm in length and exhibited marked enhancement; C: Pathological specimen of the patient; D: Histological image of the patient. Hematoxylin and eosin staining at × 10 magnification.
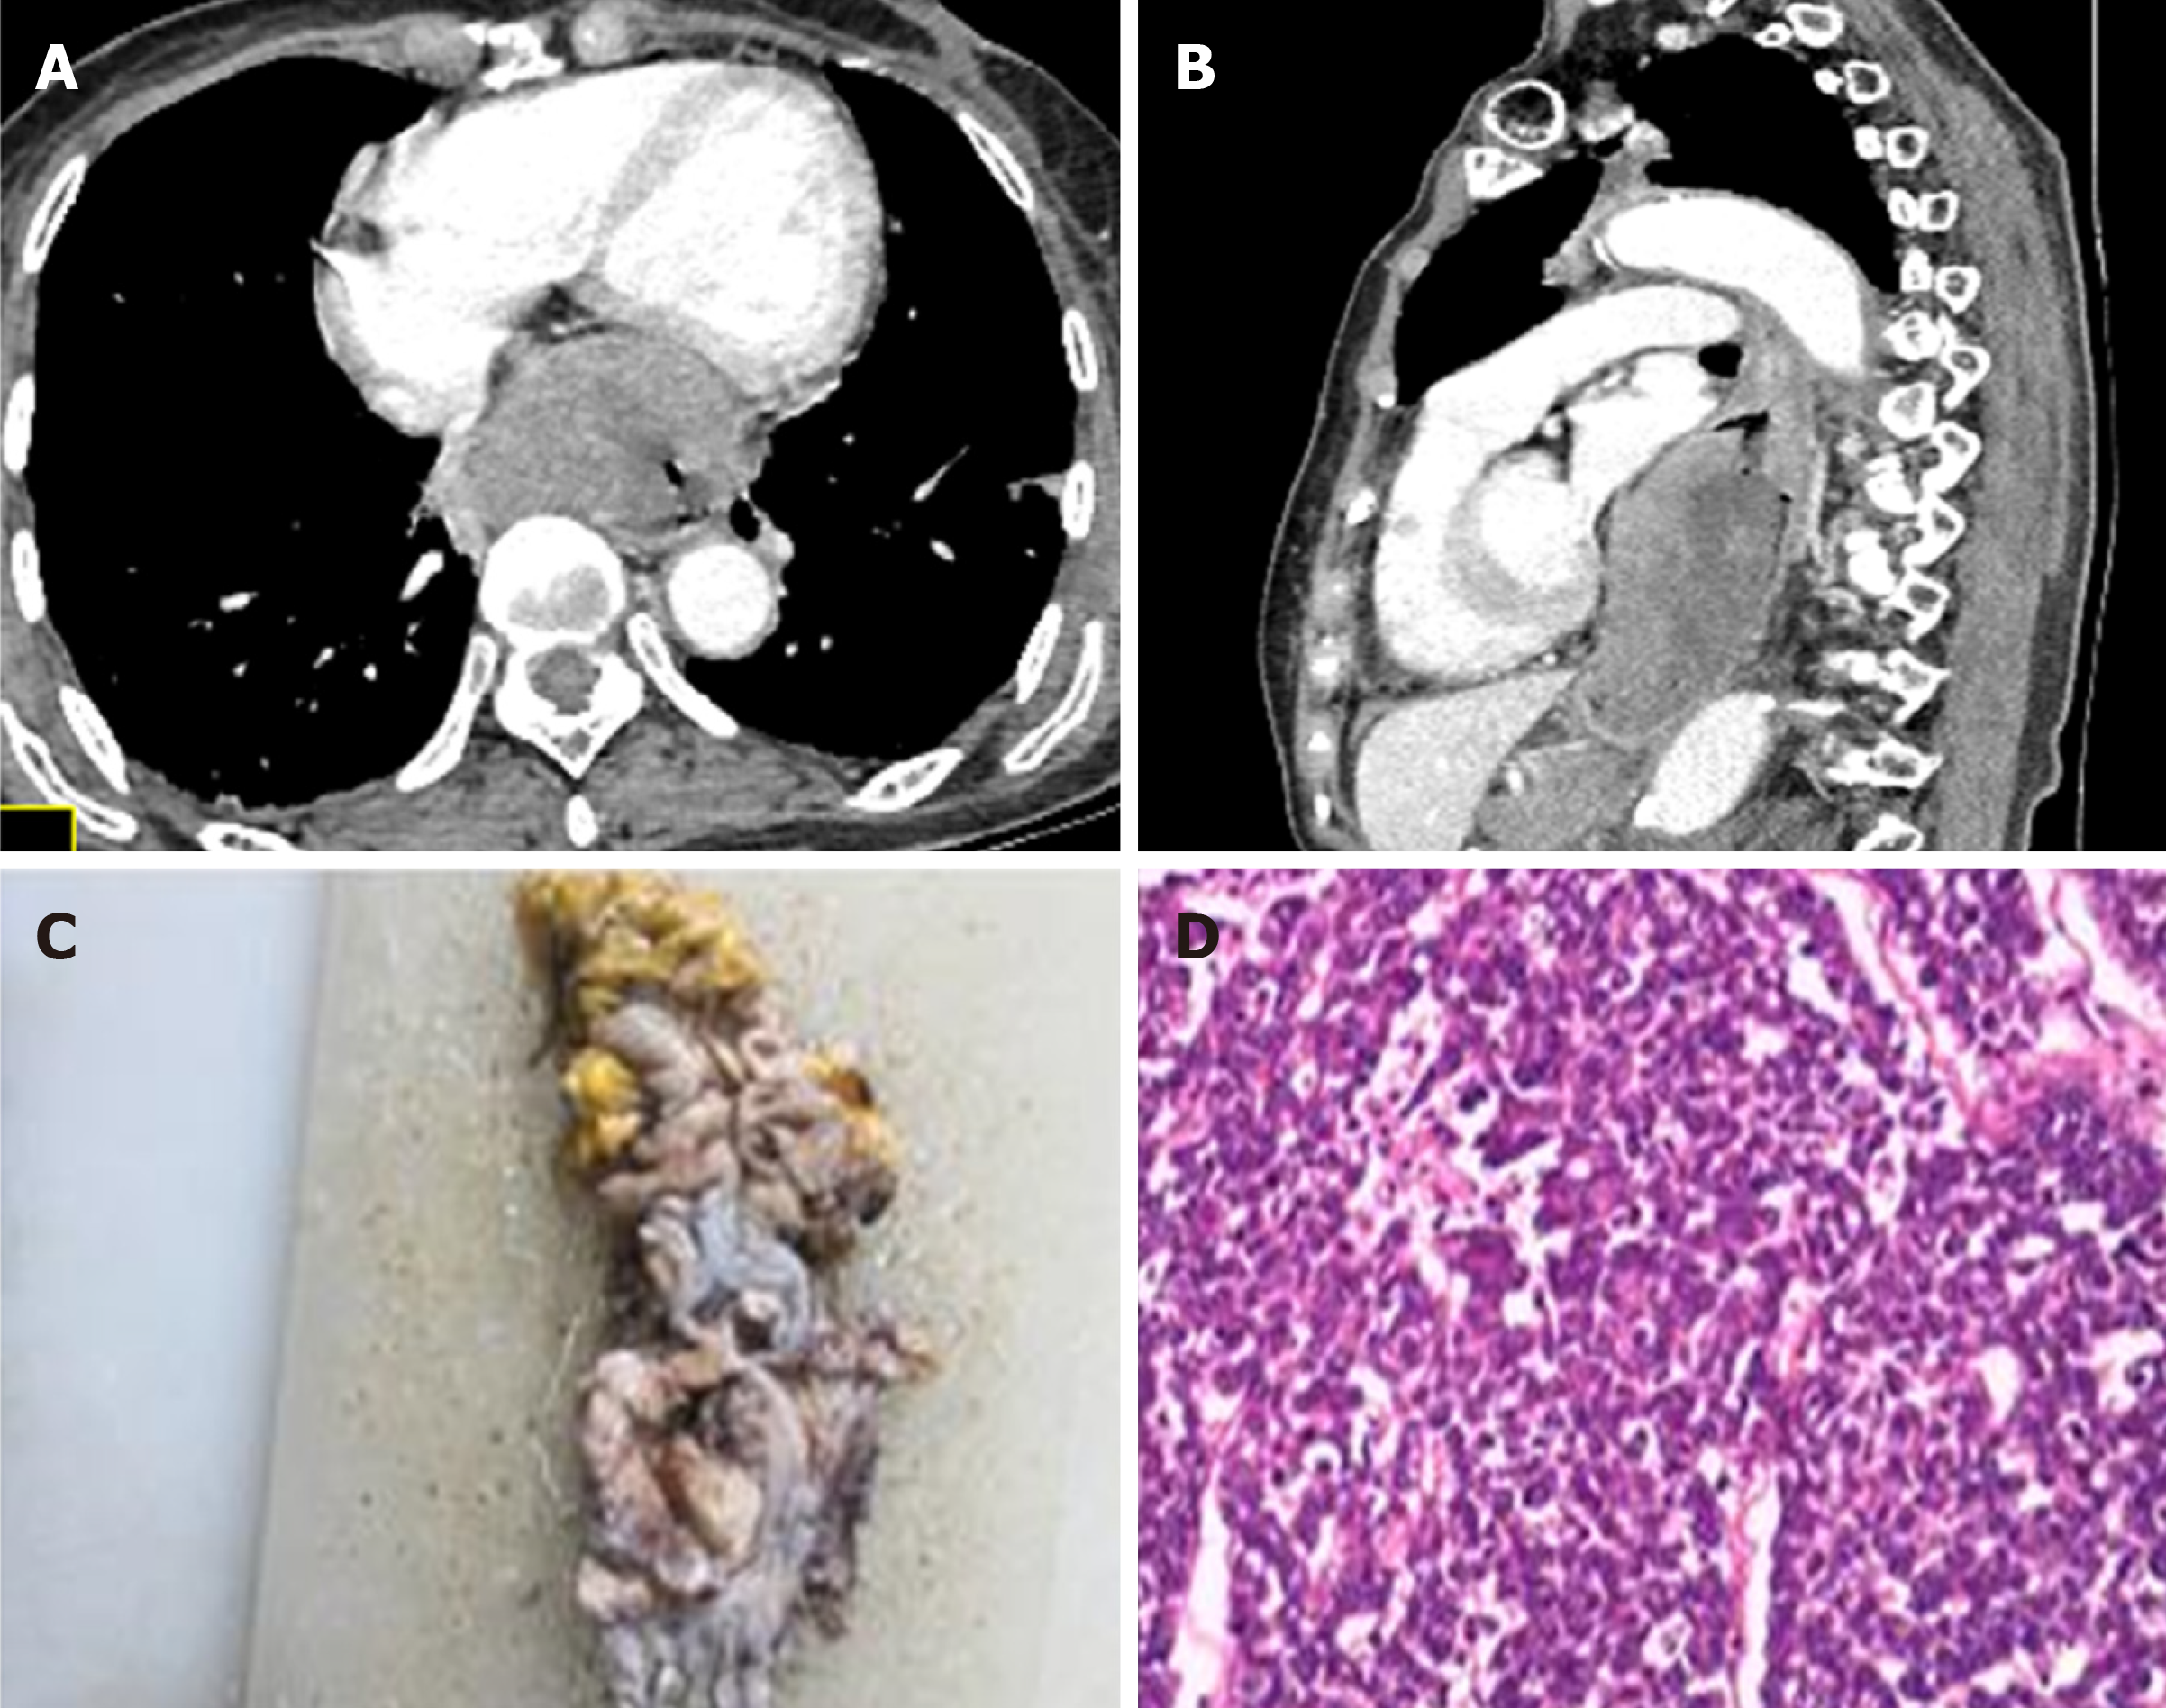
Figure 3 A typical case of esophageal neuroendocrine carcinoma.
A: Axial contrast-enhanced computed tomography image of a 75-year-old man with markedly enhanced esophageal neuroendocrine carcinoma in the middle segment of the esophagus (cT4N2M0). The patient showed a poor treatment effect from chemoradiotherapy with 3.6 mo and 8 mo of progression-free survival and overall survival, respectively; B: Sagittal-enhanced image of the patient. The tumor was 94.46 mm in length and exhibited moderate enhancement; C: Pathological specimen of the patient; D: Histological image of the patient. Hematoxylin and eosin staining at × 10 magnification.
- Citation: Zhou Y, Hou P, Zha KJ, Wang F, Zhou K, He W, Gao JB. Prognostic value of pretreatment contrast-enhanced computed tomography in esophageal neuroendocrine carcinoma: A multi-center follow-up study. World J Gastroenterol 2020; 26(31): 4680-4693
- URL: https://www.wjgnet.com/1007-9327/full/v26/i31/4680.htm
- DOI: https://dx.doi.org/10.3748/wjg.v26.i31.4680


