Copyright
©The Author(s) 2020.
World J Gastroenterol. Aug 14, 2020; 26(30): 4465-4478
Published online Aug 14, 2020. doi: 10.3748/wjg.v26.i30.4465
Published online Aug 14, 2020. doi: 10.3748/wjg.v26.i30.4465
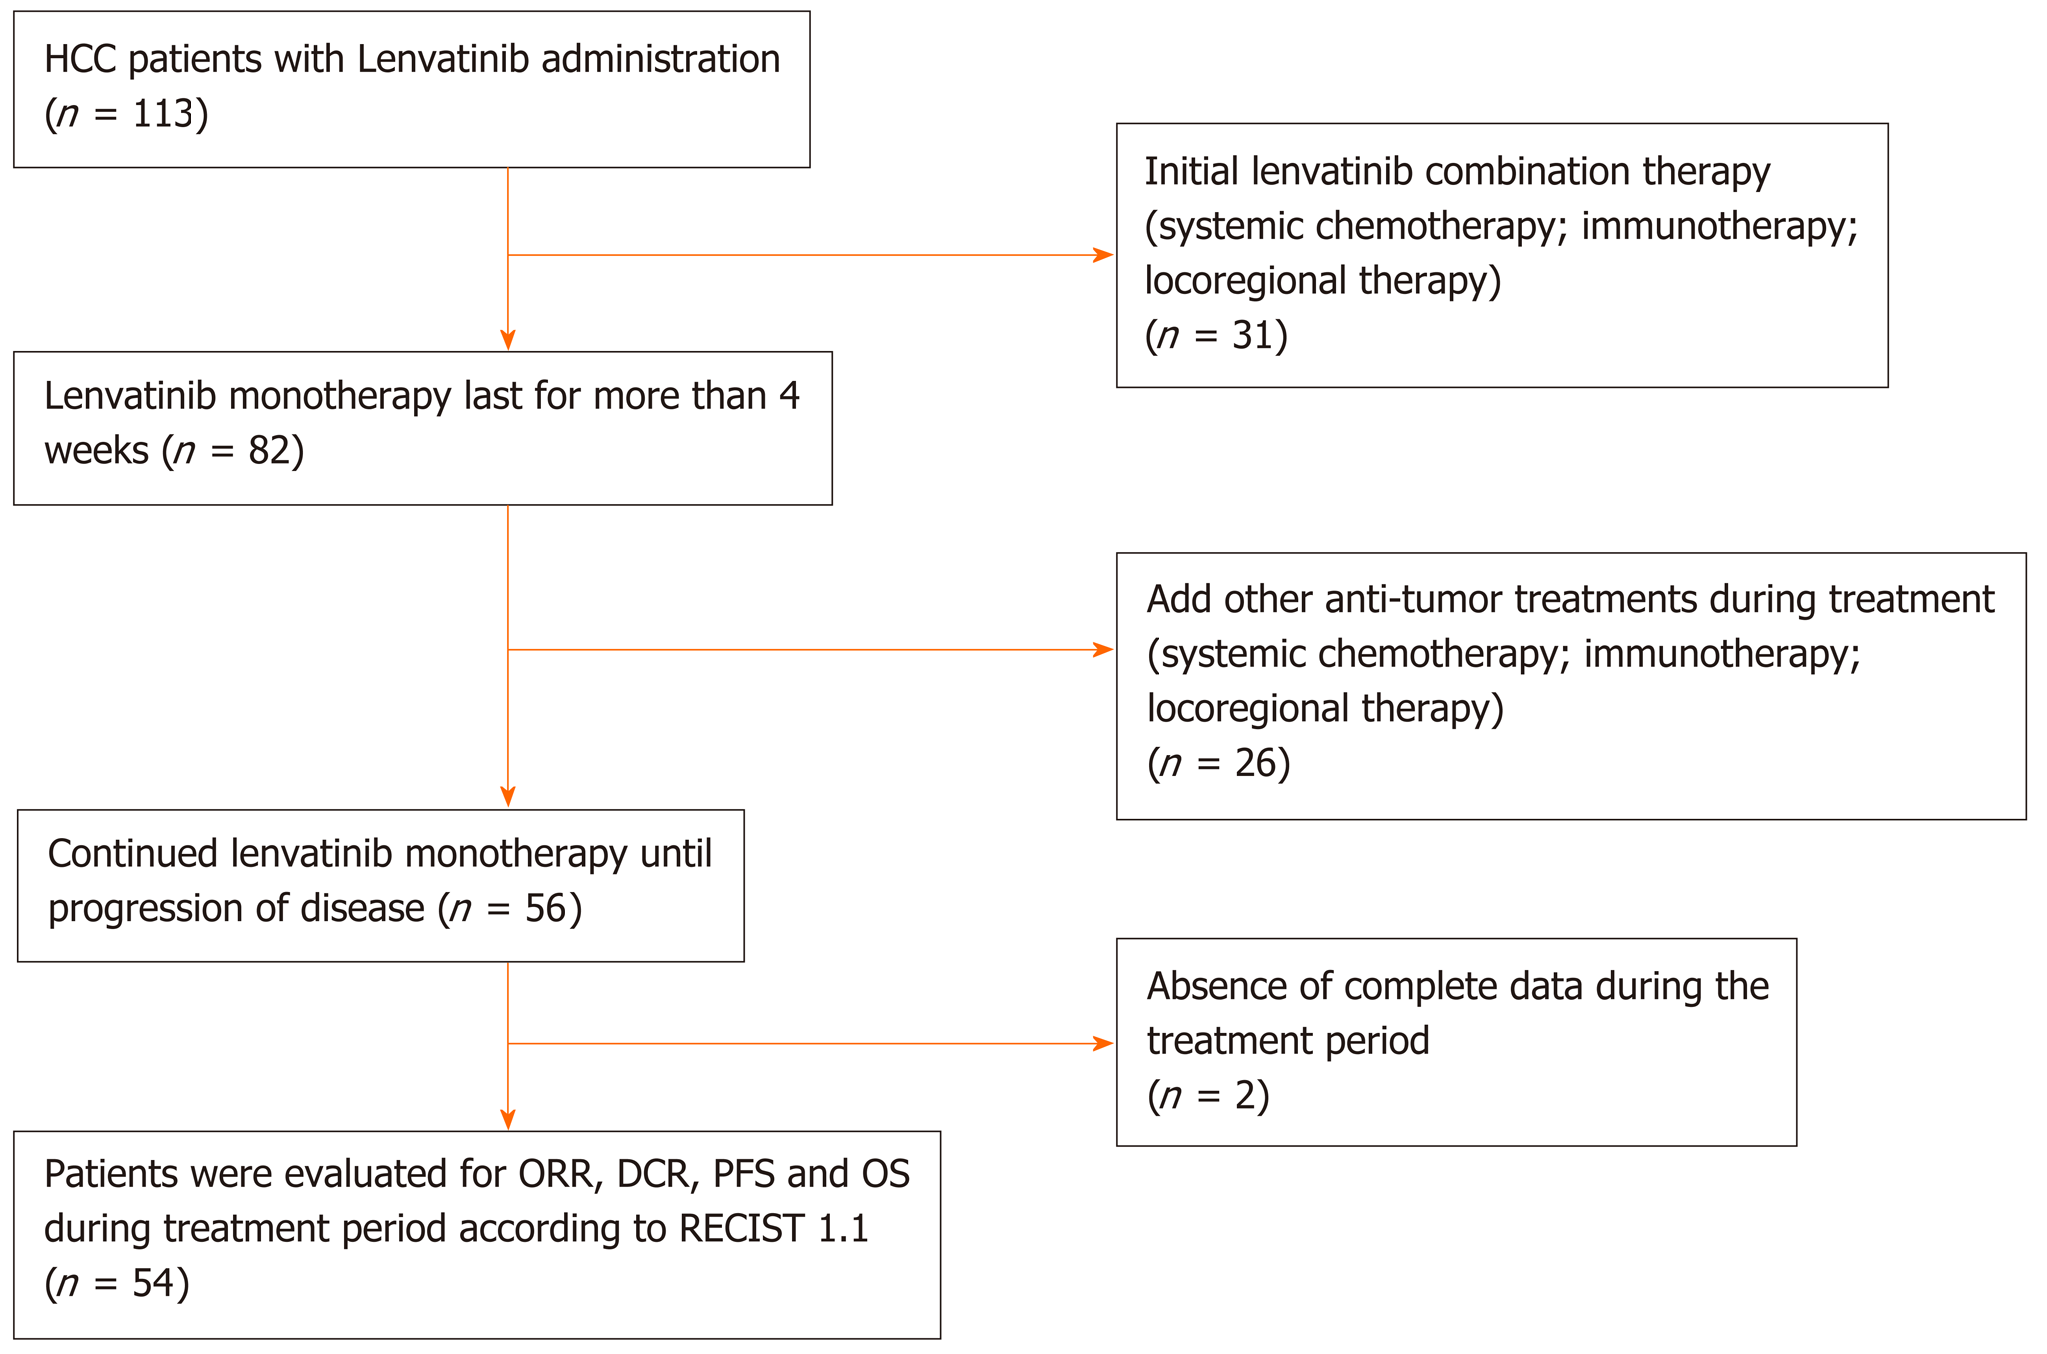
Figure 1 Flow diagram of study population.
HCC: Hepatocellular carcinoma; ORR: Objective response rate; DCR: Disease control rate; PFS: Progression-free survival; RECIST 1.1: Response Evaluation Criteria in Solid Tumors version 1.1.
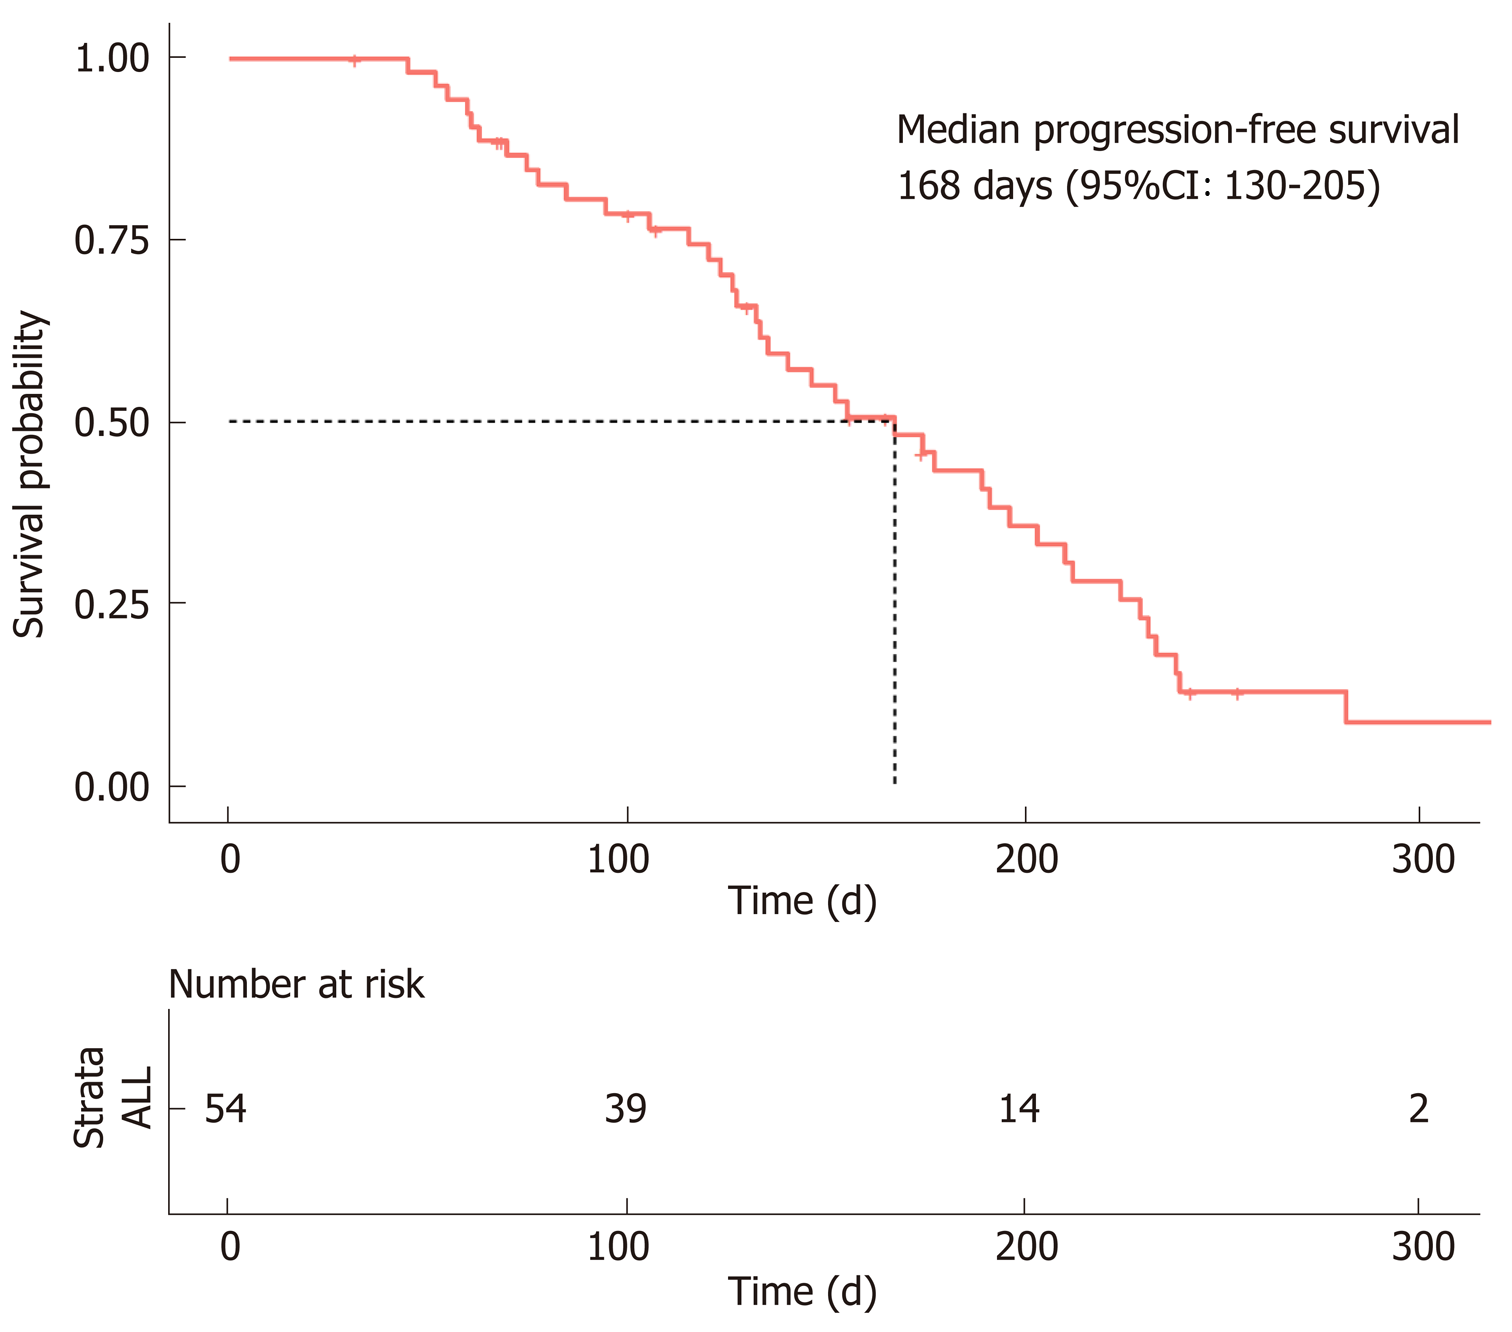
Figure 2 Progression-free survival of hepatocellular carcinoma patients treated with lenvatinib.
The median progression-free survival was estimated to be 168 d (95%CI: 130–205 d).
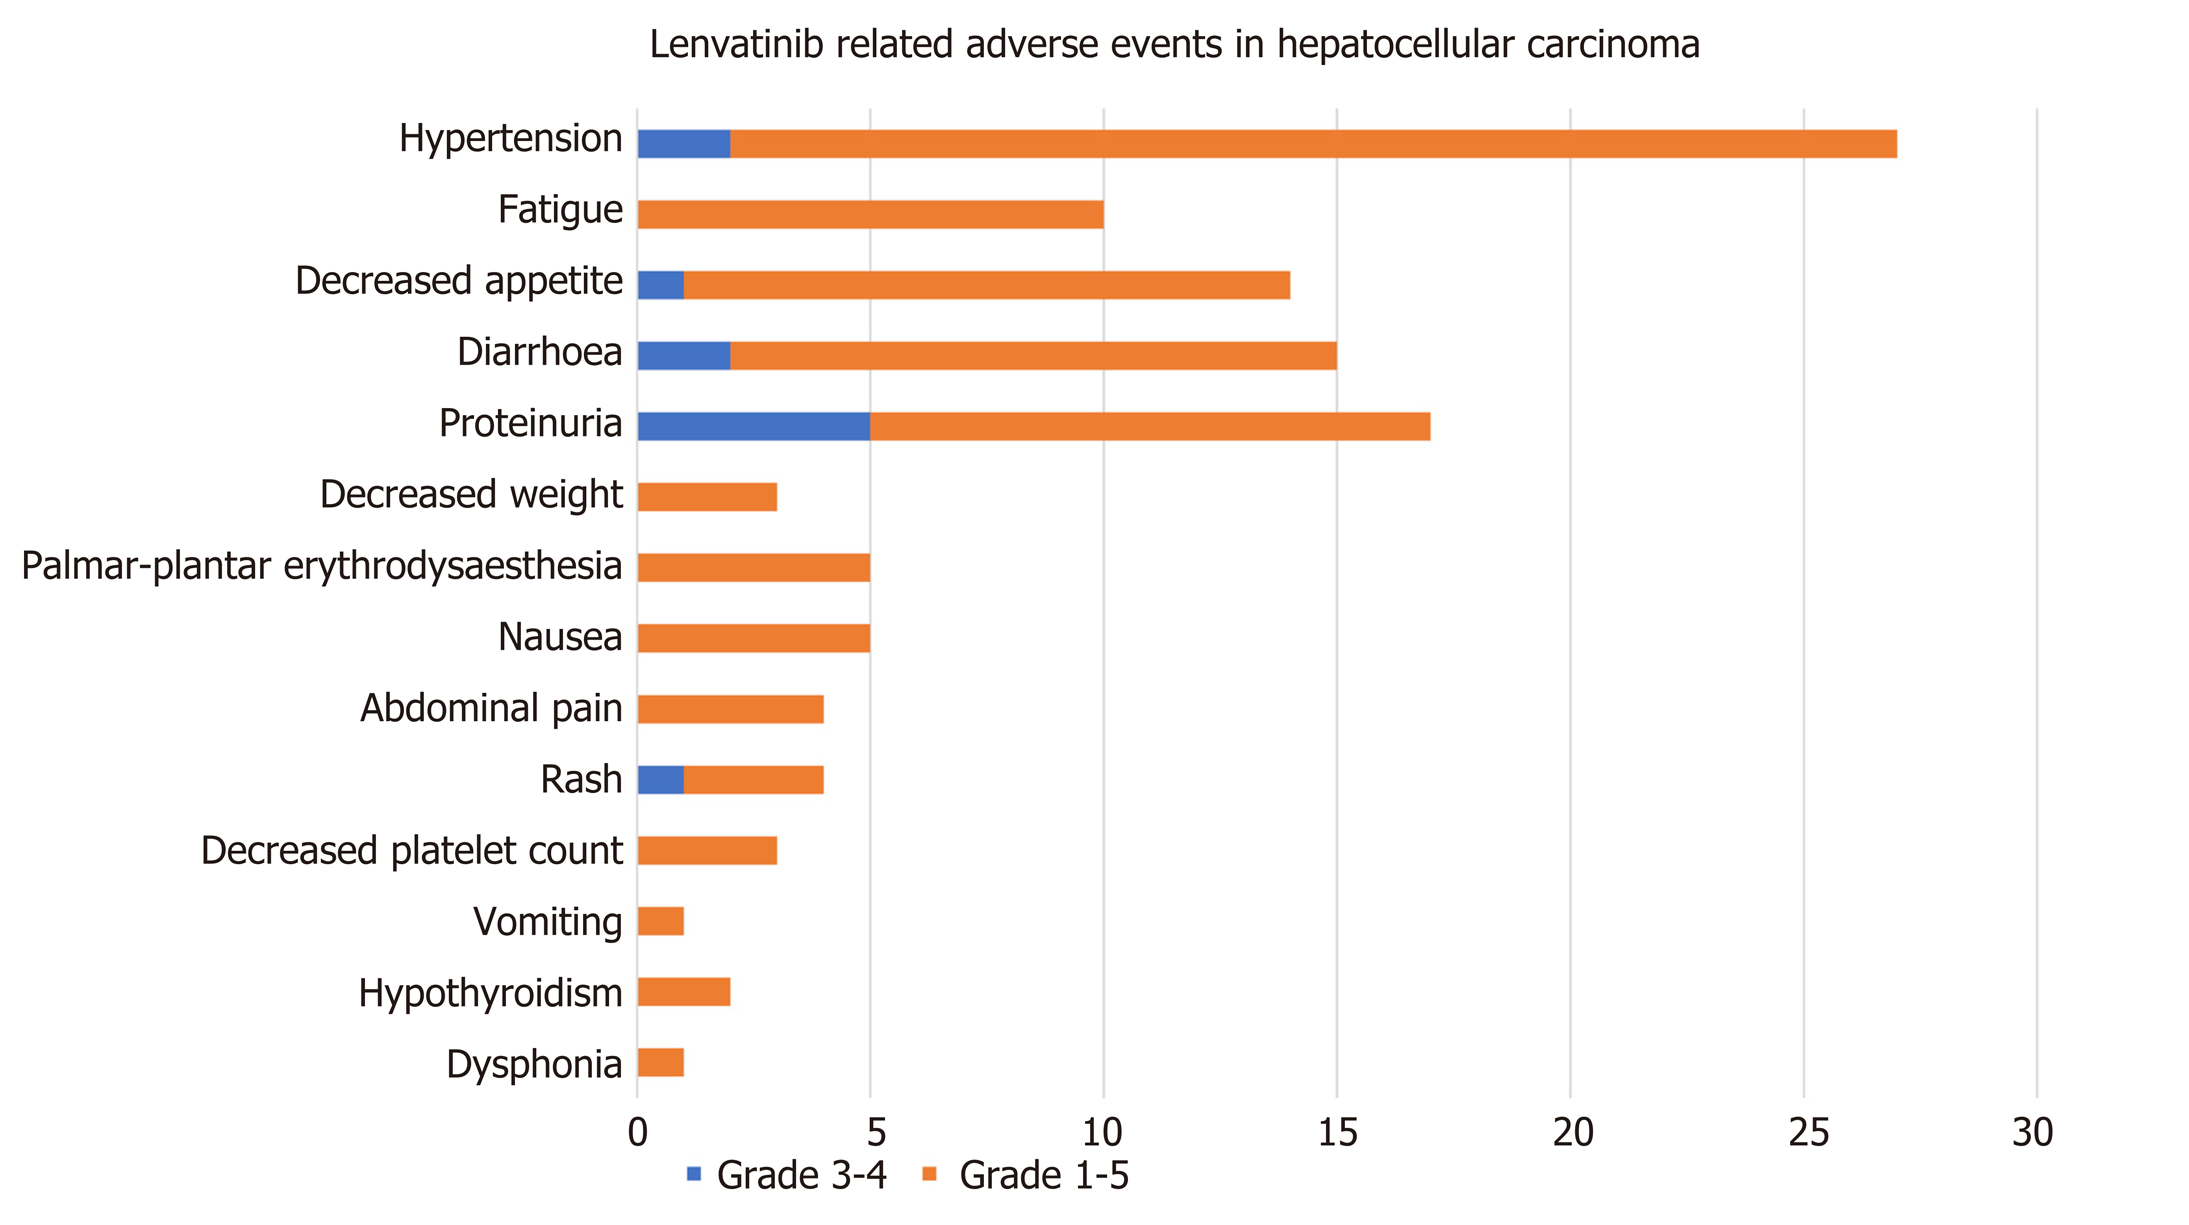
Figure 3 Lenvatinib-related adverse events in patients with hepatocellular carcinoma.
The brown bar represents grade 3-4 adverse events; the blue bar represents all-grade adverse events.
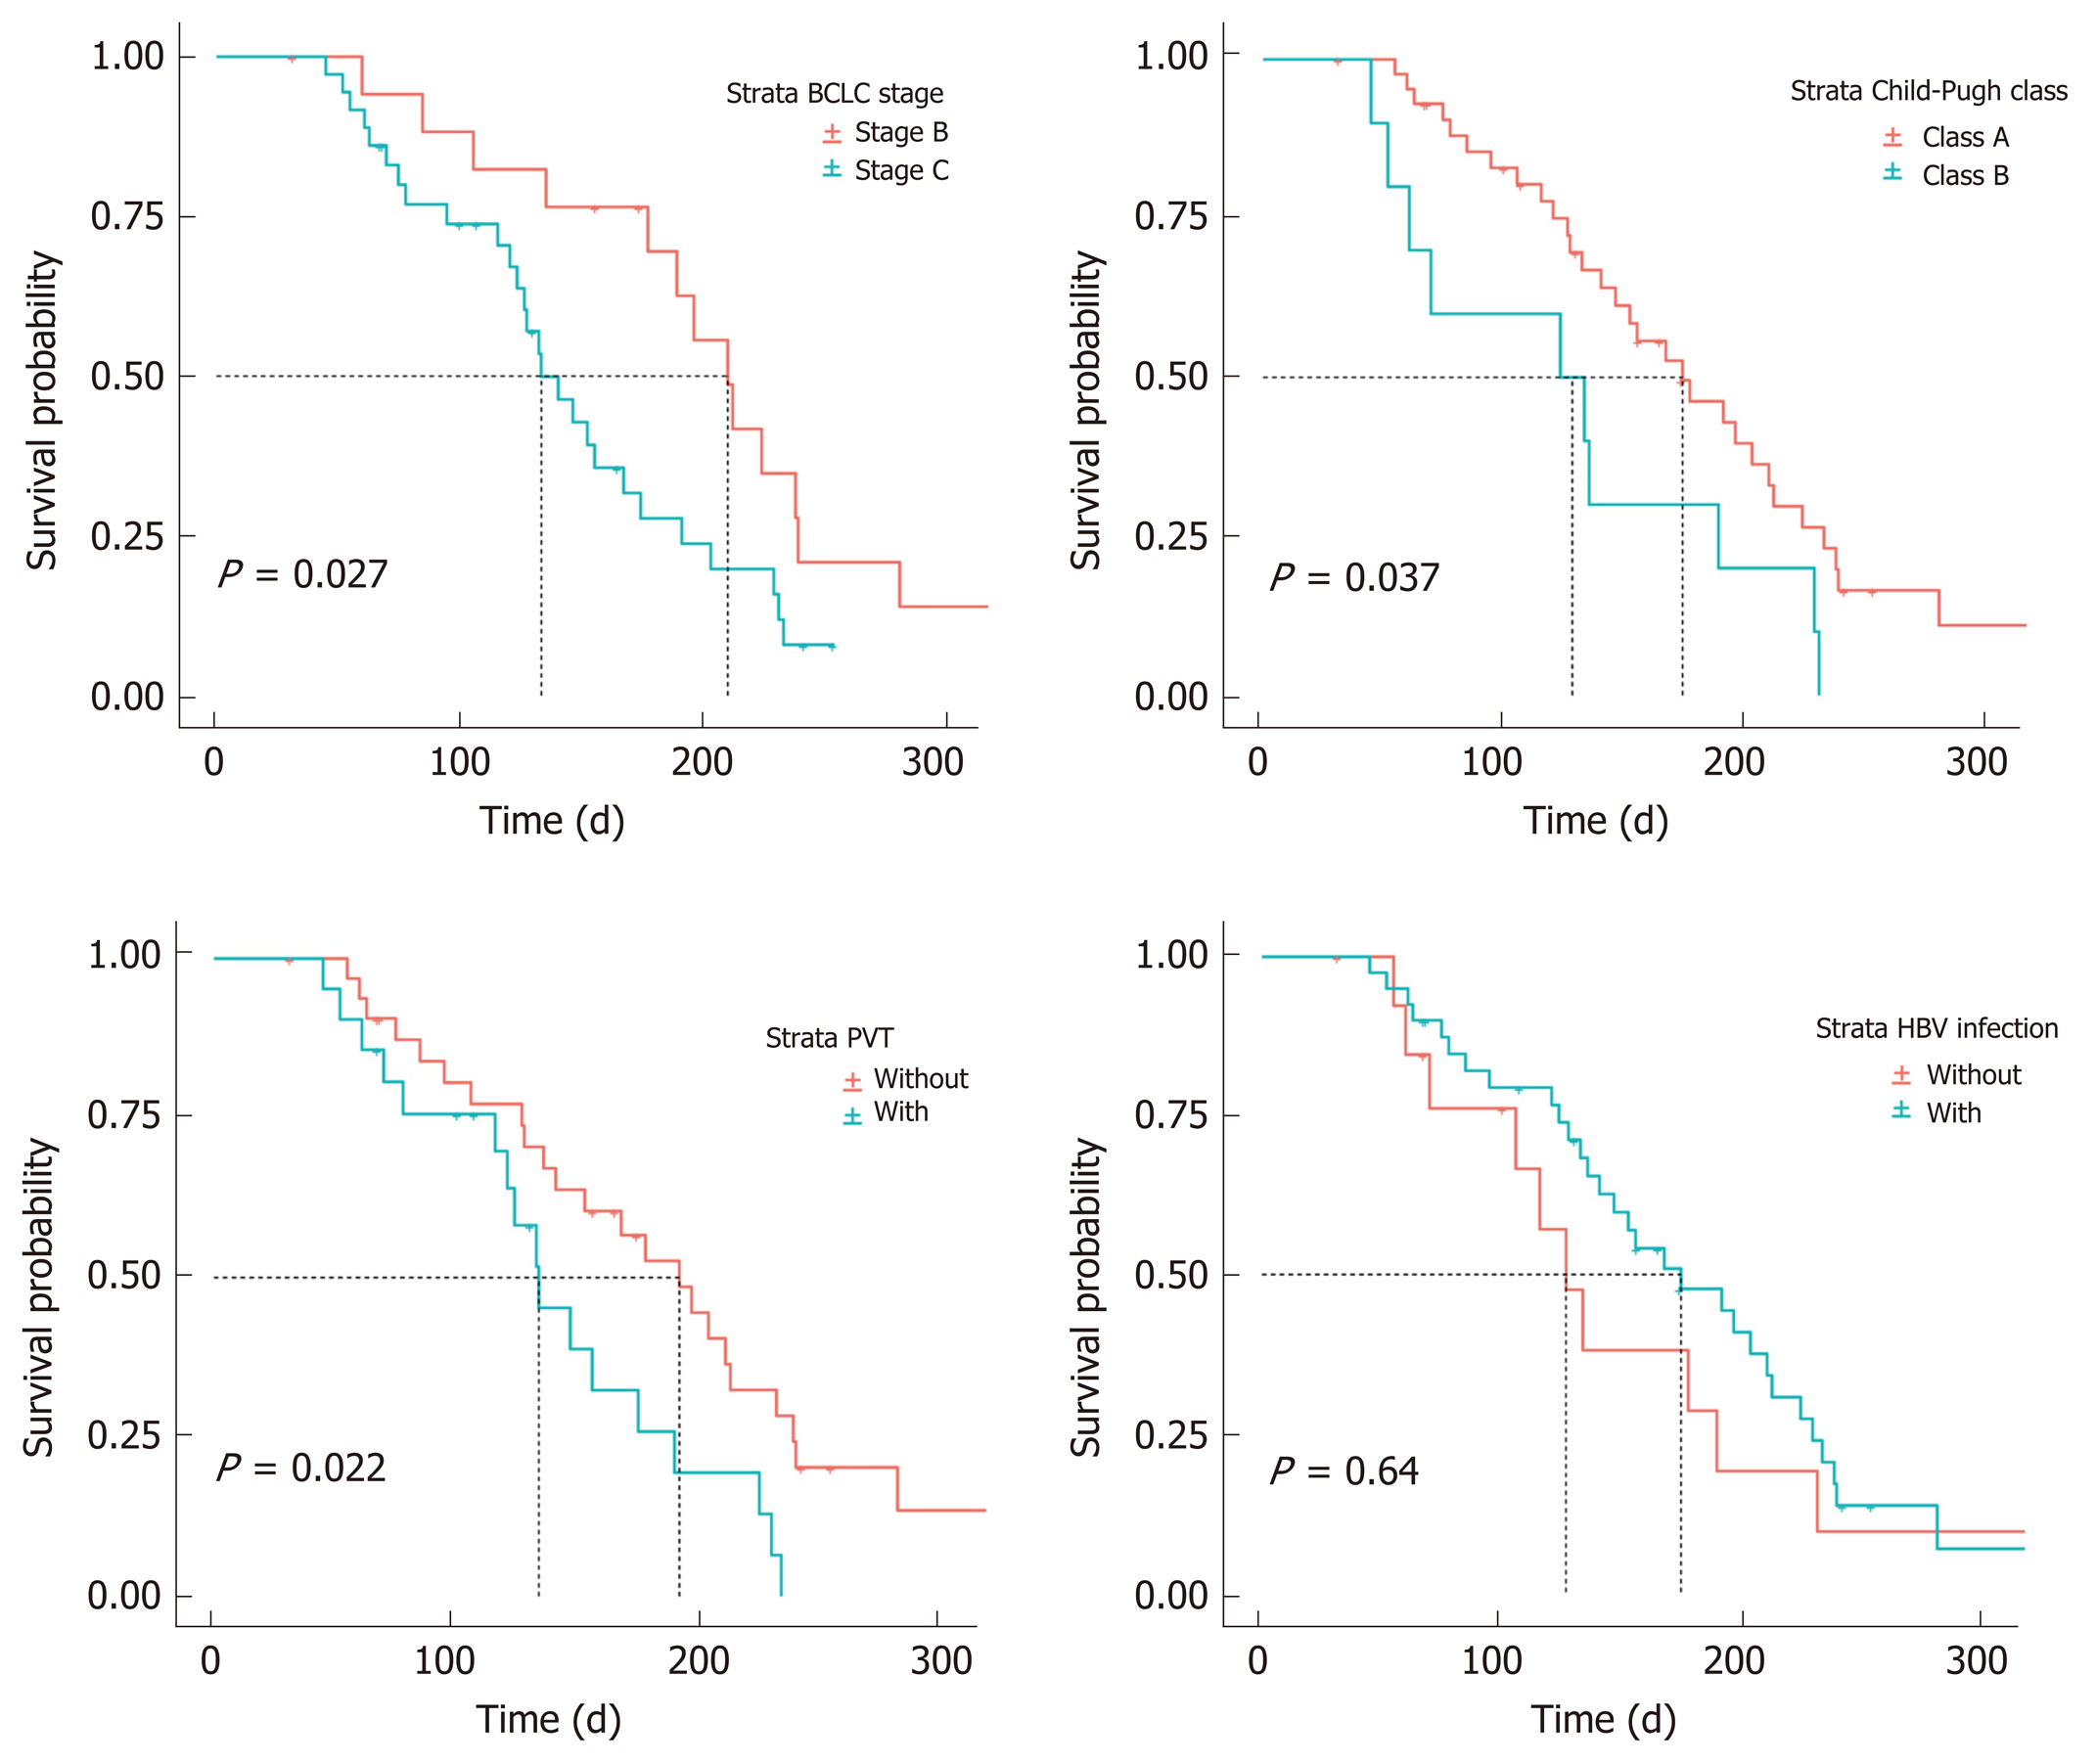
Figure 4 Progression-free survival of patients in different subgroups.
BCLC: Barcelona Clinic Liver Cancer; HBV: Hepatitis B virus; PVT: Portal vein thrombus.
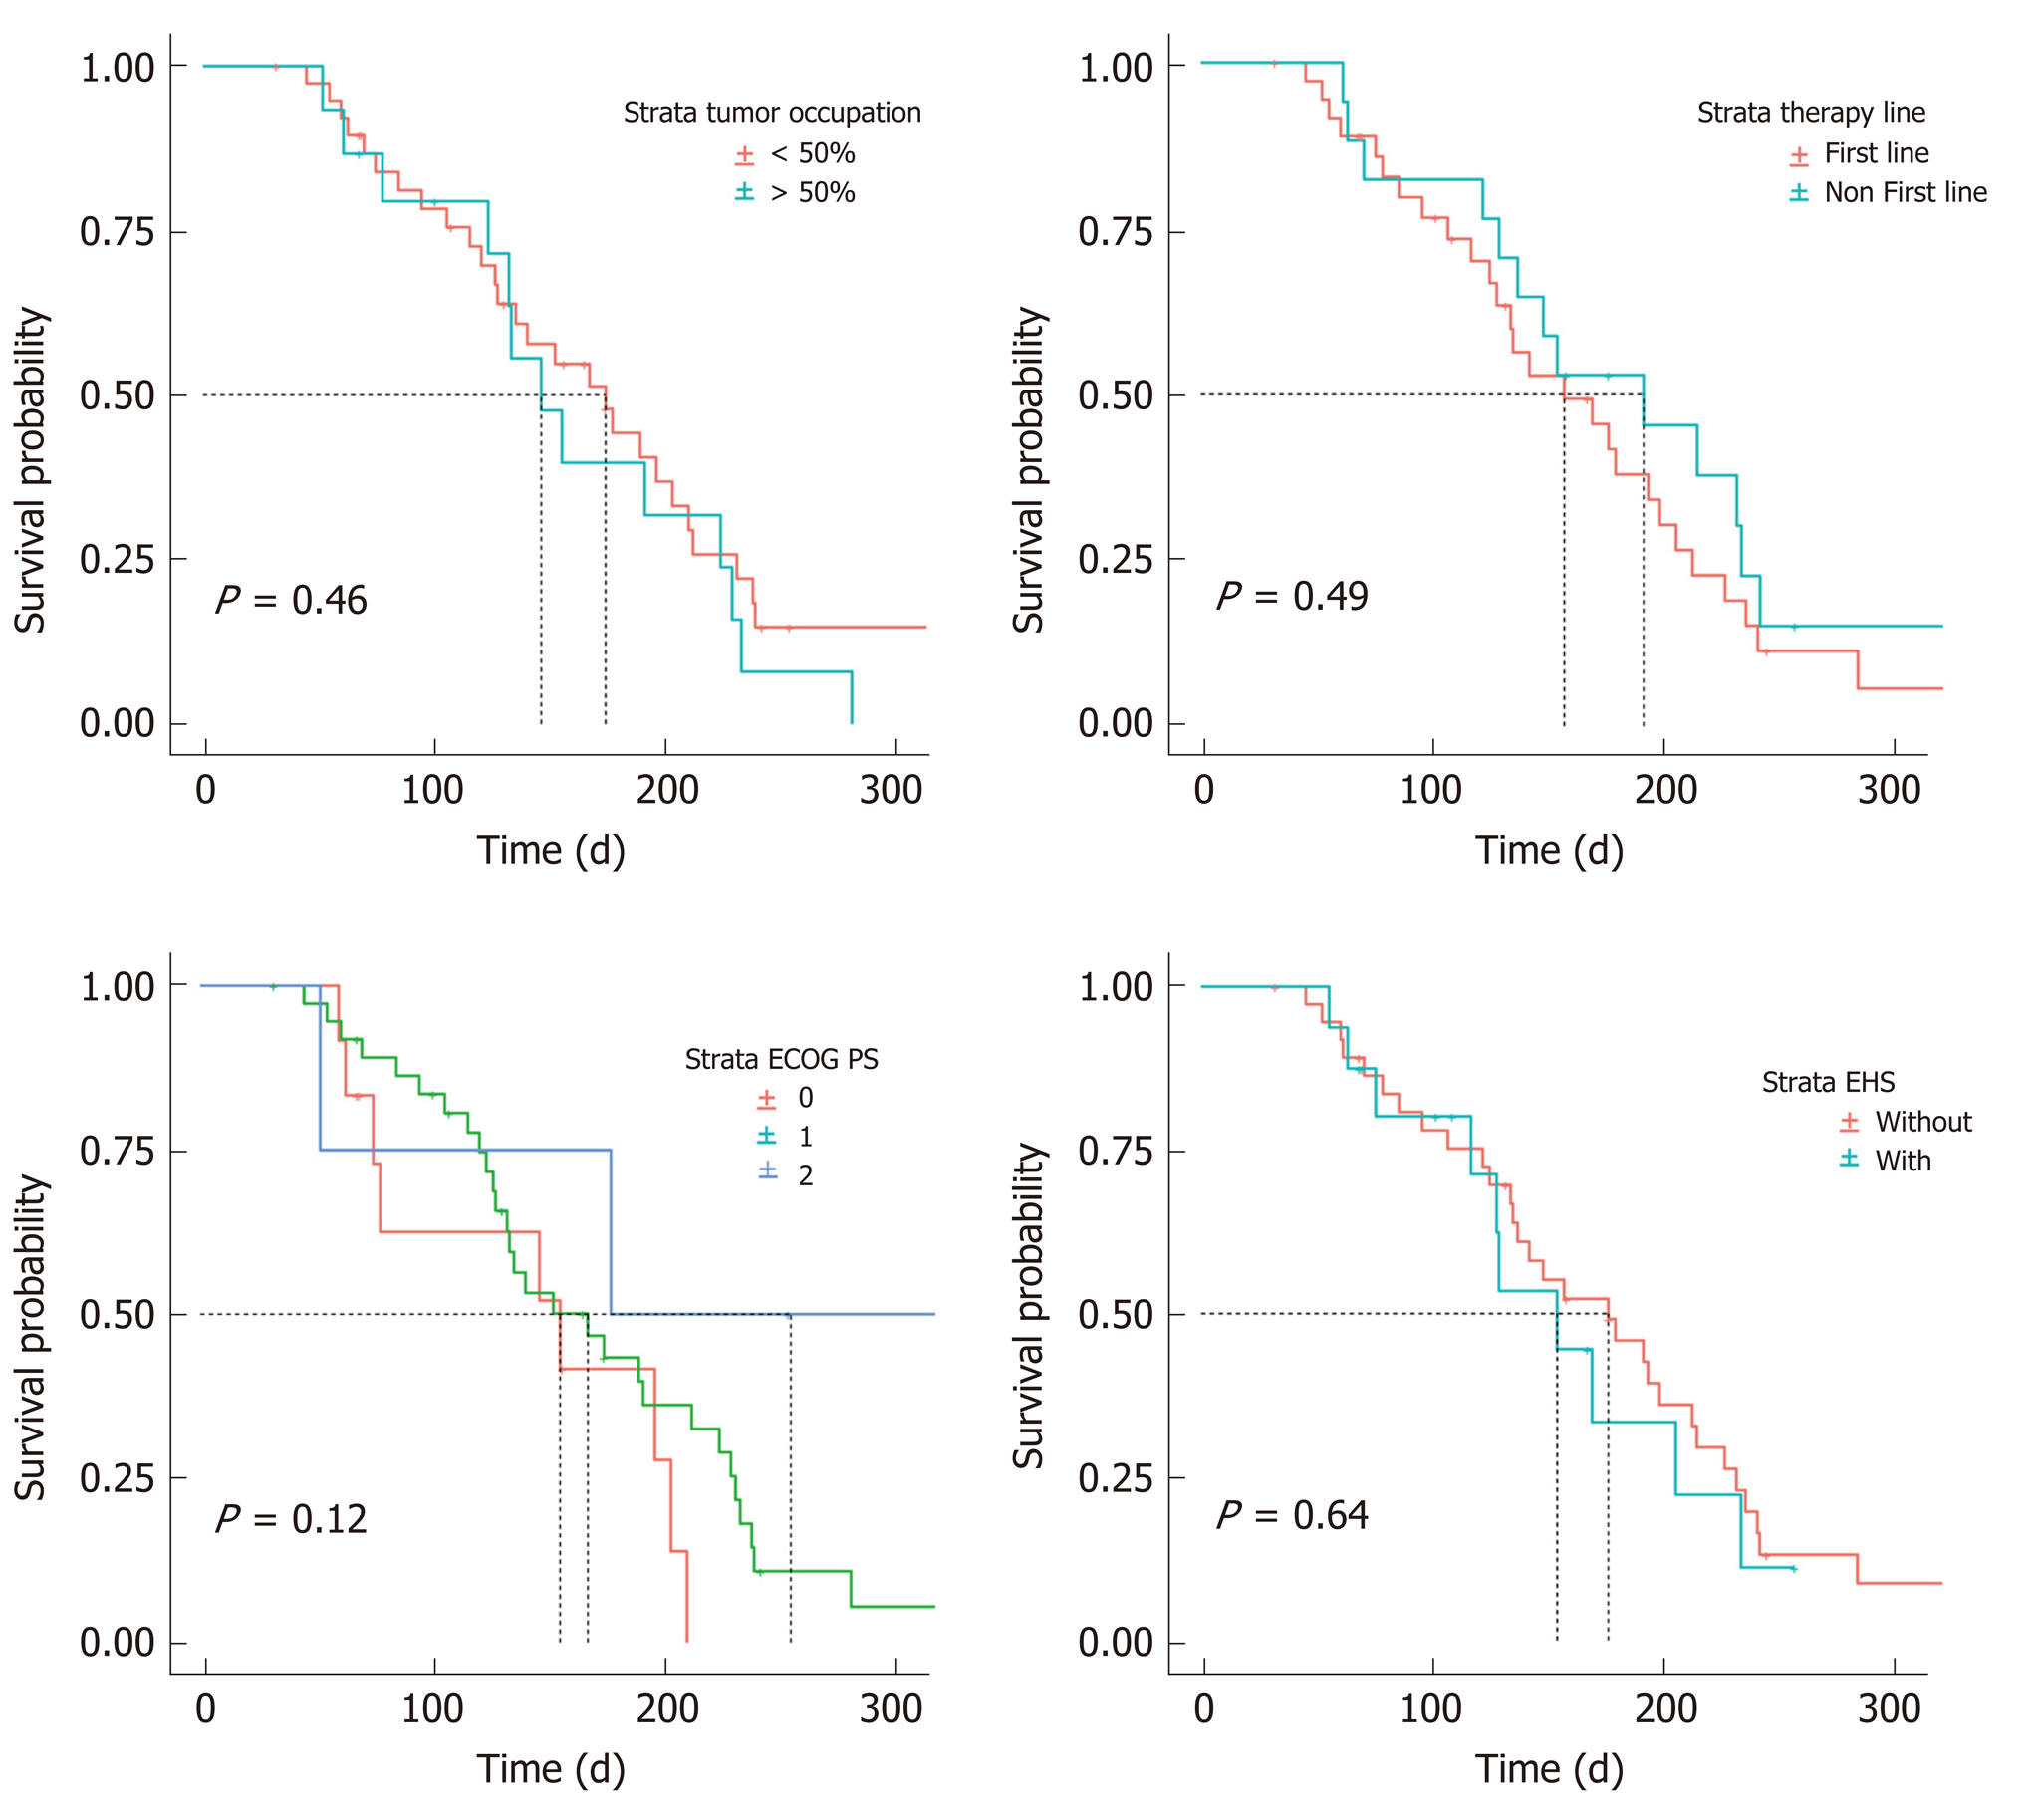
Figure 5 Progression-free survival of patients in different subgroups.
PS: Performance Status; EHS: Extrahepatic spread.
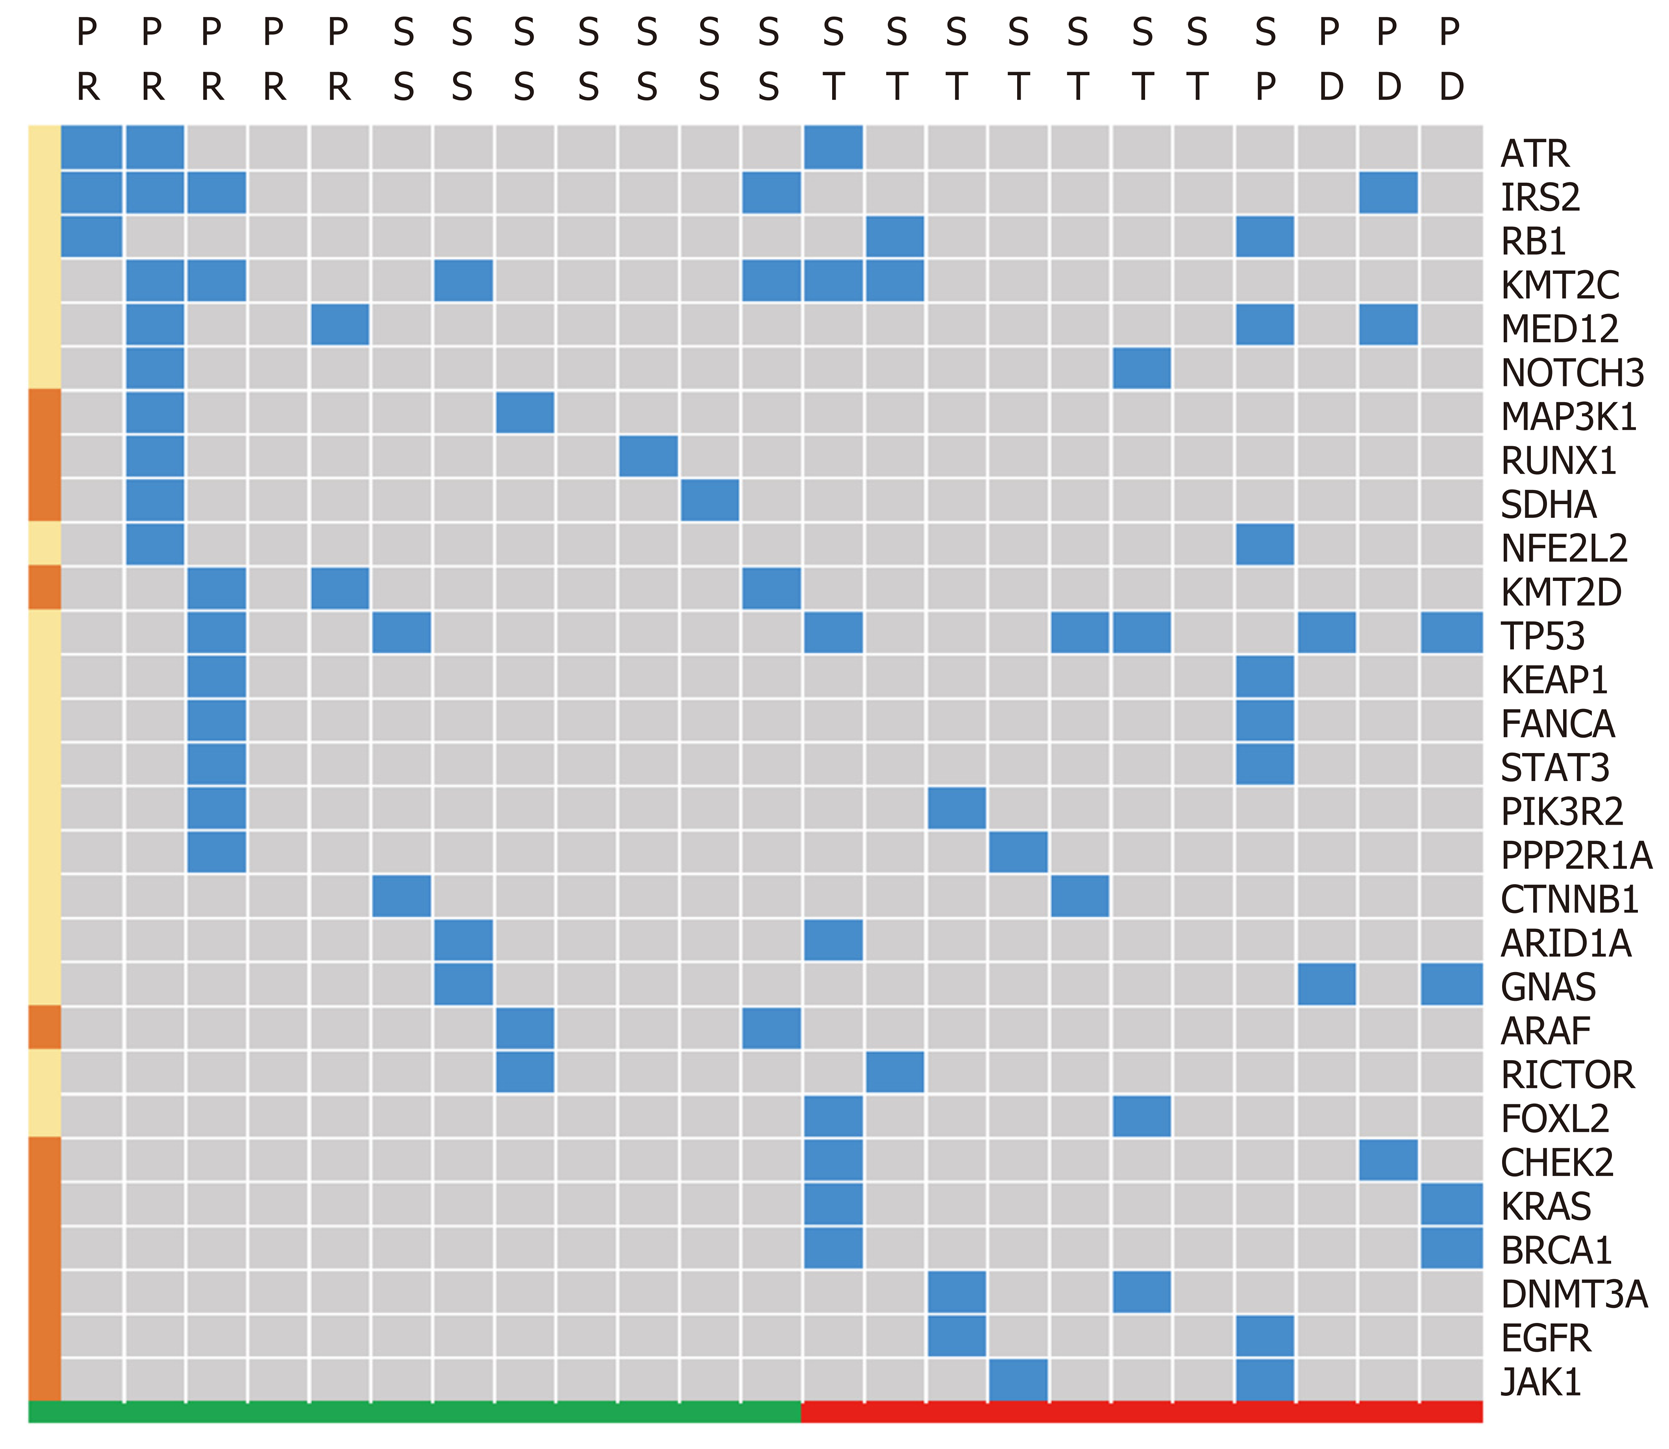
Figure 6 Signature of gene differences based on different tumor size changes.
Response standard and partial response were clustered as a group encountering tumor size reduction in response to treatment, which appears green. Tumor size change, progression standard and progressive disease were clustered into a group that did not respond with tumor size reduction, which appears red. The blue block highlights the existence of specific genes, and the left brown block represents the gene that mainly appears in either the tumor reduction or without reduction groups. SS: Response standard; ST: Tumor size change; SP: Progression standard; PD: Progressive disease; PR: Partial response.
- Citation: Wang DX, Yang X, Lin JZ, Bai Y, Long JY, Yang XB, Seery S, Zhao HT. Efficacy and safety of lenvatinib for patients with advanced hepatocellular carcinoma: A retrospective, real-world study conducted in China. World J Gastroenterol 2020; 26(30): 4465-4478
- URL: https://www.wjgnet.com/1007-9327/full/v26/i30/4465.htm
- DOI: https://dx.doi.org/10.3748/wjg.v26.i30.4465


