Copyright
©The Author(s) 2020.
World J Gastroenterol. Jul 28, 2020; 26(28): 4151-4158
Published online Jul 28, 2020. doi: 10.3748/wjg.v26.i28.4151
Published online Jul 28, 2020. doi: 10.3748/wjg.v26.i28.4151
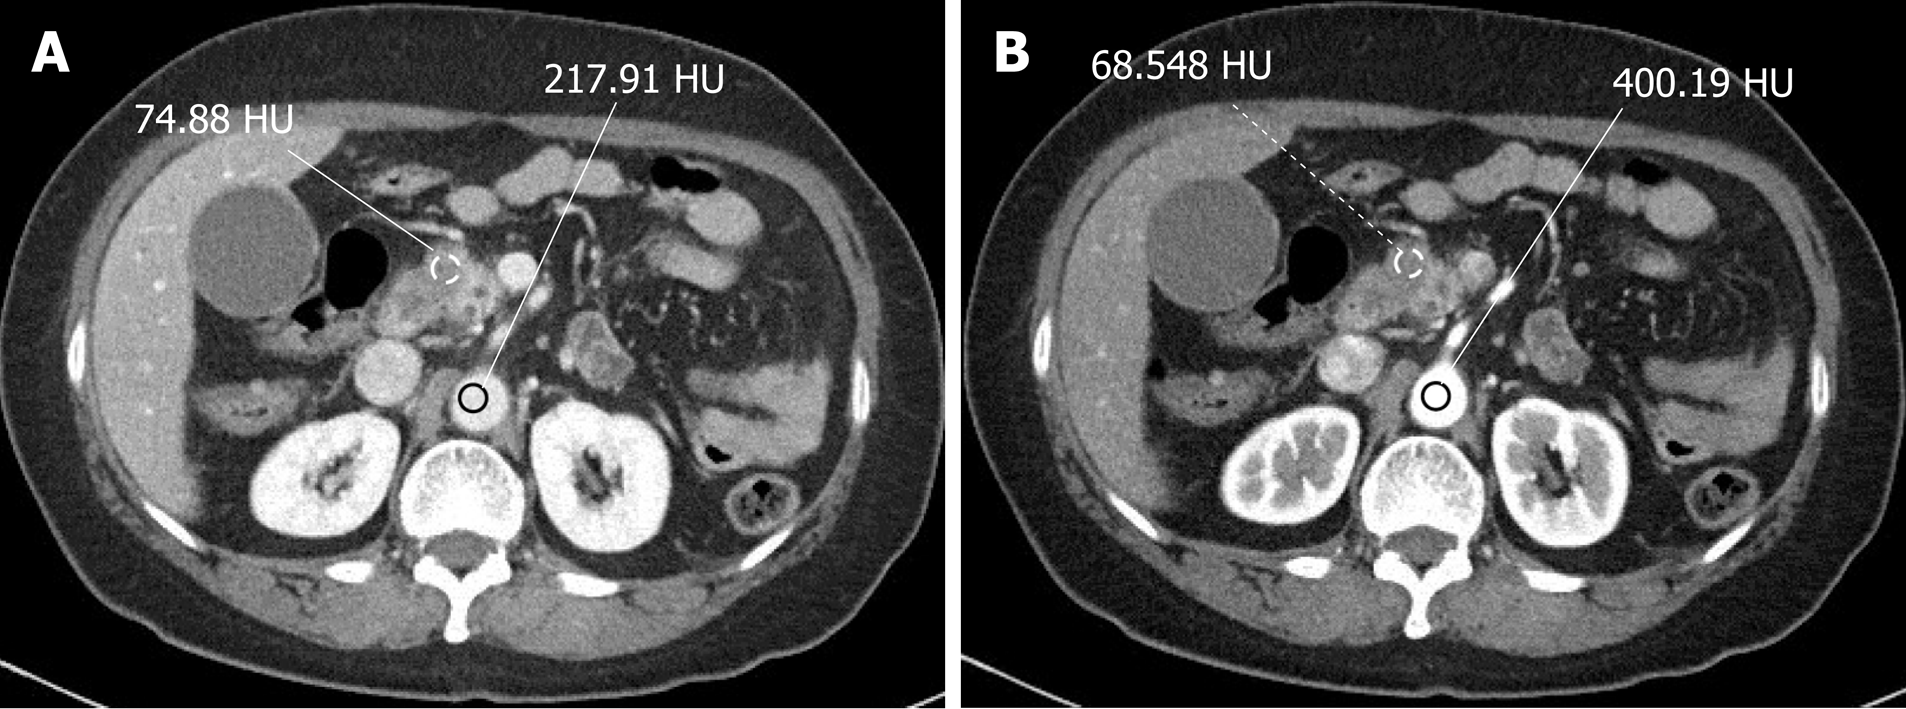
Figure 1 Axial computed tomography images on arterial phase (A) and pancreatic phase (B) of a 68-year-old woman, who was classified in the poorly differentiated group.
A: Computed tomography (CT) attenuation values [Hounsfield Unit (HU)] of the tumor in the arterial phase (VTarterial ) and the aorta in the arterial phase (VAarterial) were measured by drawing two separate circular regions of interest in the aorta and pancreas on arterial phase image; B: CT HU of the tumor in a pancreatic phase (VTpancreatic) and the aorta in the pancreatic phase (VApancreatic) were measured in the aorta and pancreas on the pancreatic phase 65 s after the injection of the contrast agent.
- Citation: Seo W, Kim YC, Min SJ, Lee SM. Enhancement parameters of contrast-enhanced computed tomography for pancreatic ductal adenocarcinoma: Correlation with pathologic grading. World J Gastroenterol 2020; 26(28): 4151-4158
- URL: https://www.wjgnet.com/1007-9327/full/v26/i28/4151.htm
- DOI: https://dx.doi.org/10.3748/wjg.v26.i28.4151


