Copyright
©The Author(s) 2020.
World J Gastroenterol. Jul 14, 2020; 26(26): 3737-3749
Published online Jul 14, 2020. doi: 10.3748/wjg.v26.i26.3737
Published online Jul 14, 2020. doi: 10.3748/wjg.v26.i26.3737
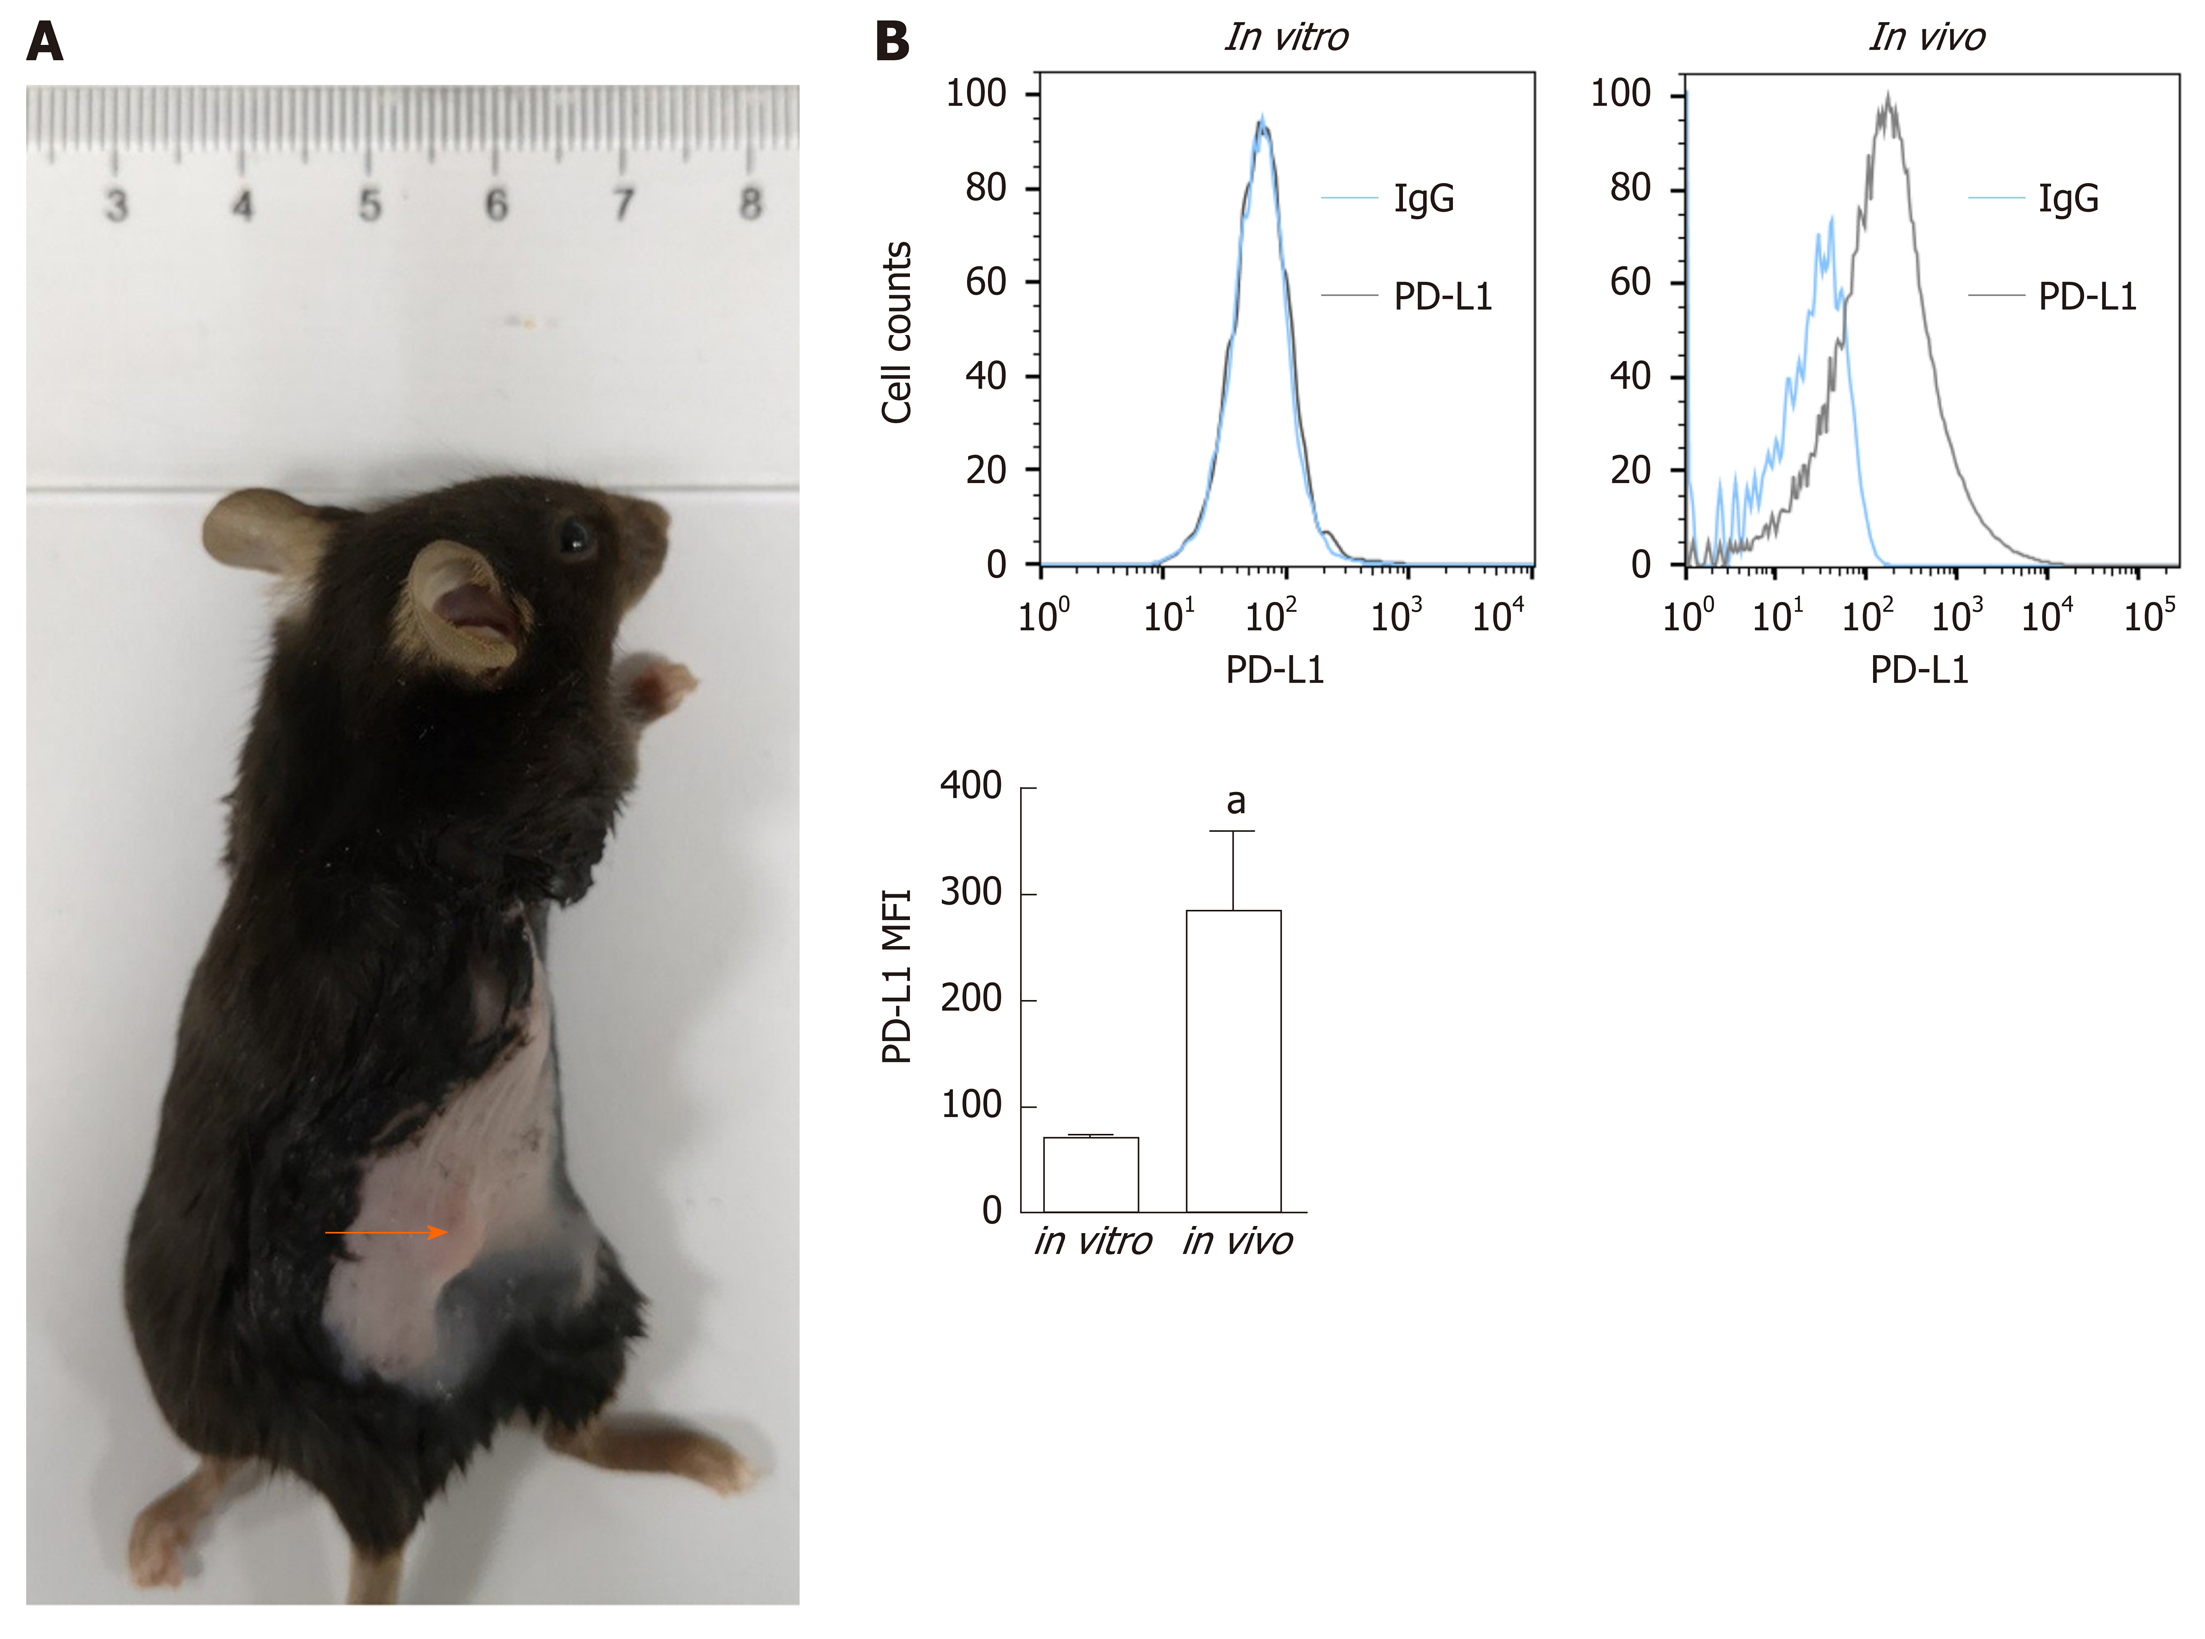
Figure 1 Programmed death-ligand-1 expression in pancreatic ductal adenocarcinoma in vitro and in vivo.
A: Panc02 cells were subcutaneously transplanted into C57BL/6 mice to establish pancreatic tumors (orange arrow); B: Programmed death-ligand-1 expression levels in cultured pancreatic cancer cells (in vitro) and tumors (in vivo). The mean fluorescence intensity was used to quantify protein expression levels, and the values were statistically analyzed by a two-sided t-test; the results are presented at the bottom. Data represent the mean ± SE (n = 3). aP < 0.05 vs in vitro condition. PD-L1: Programmed death-ligand-1; MFI: Mean fluorescence intensity.
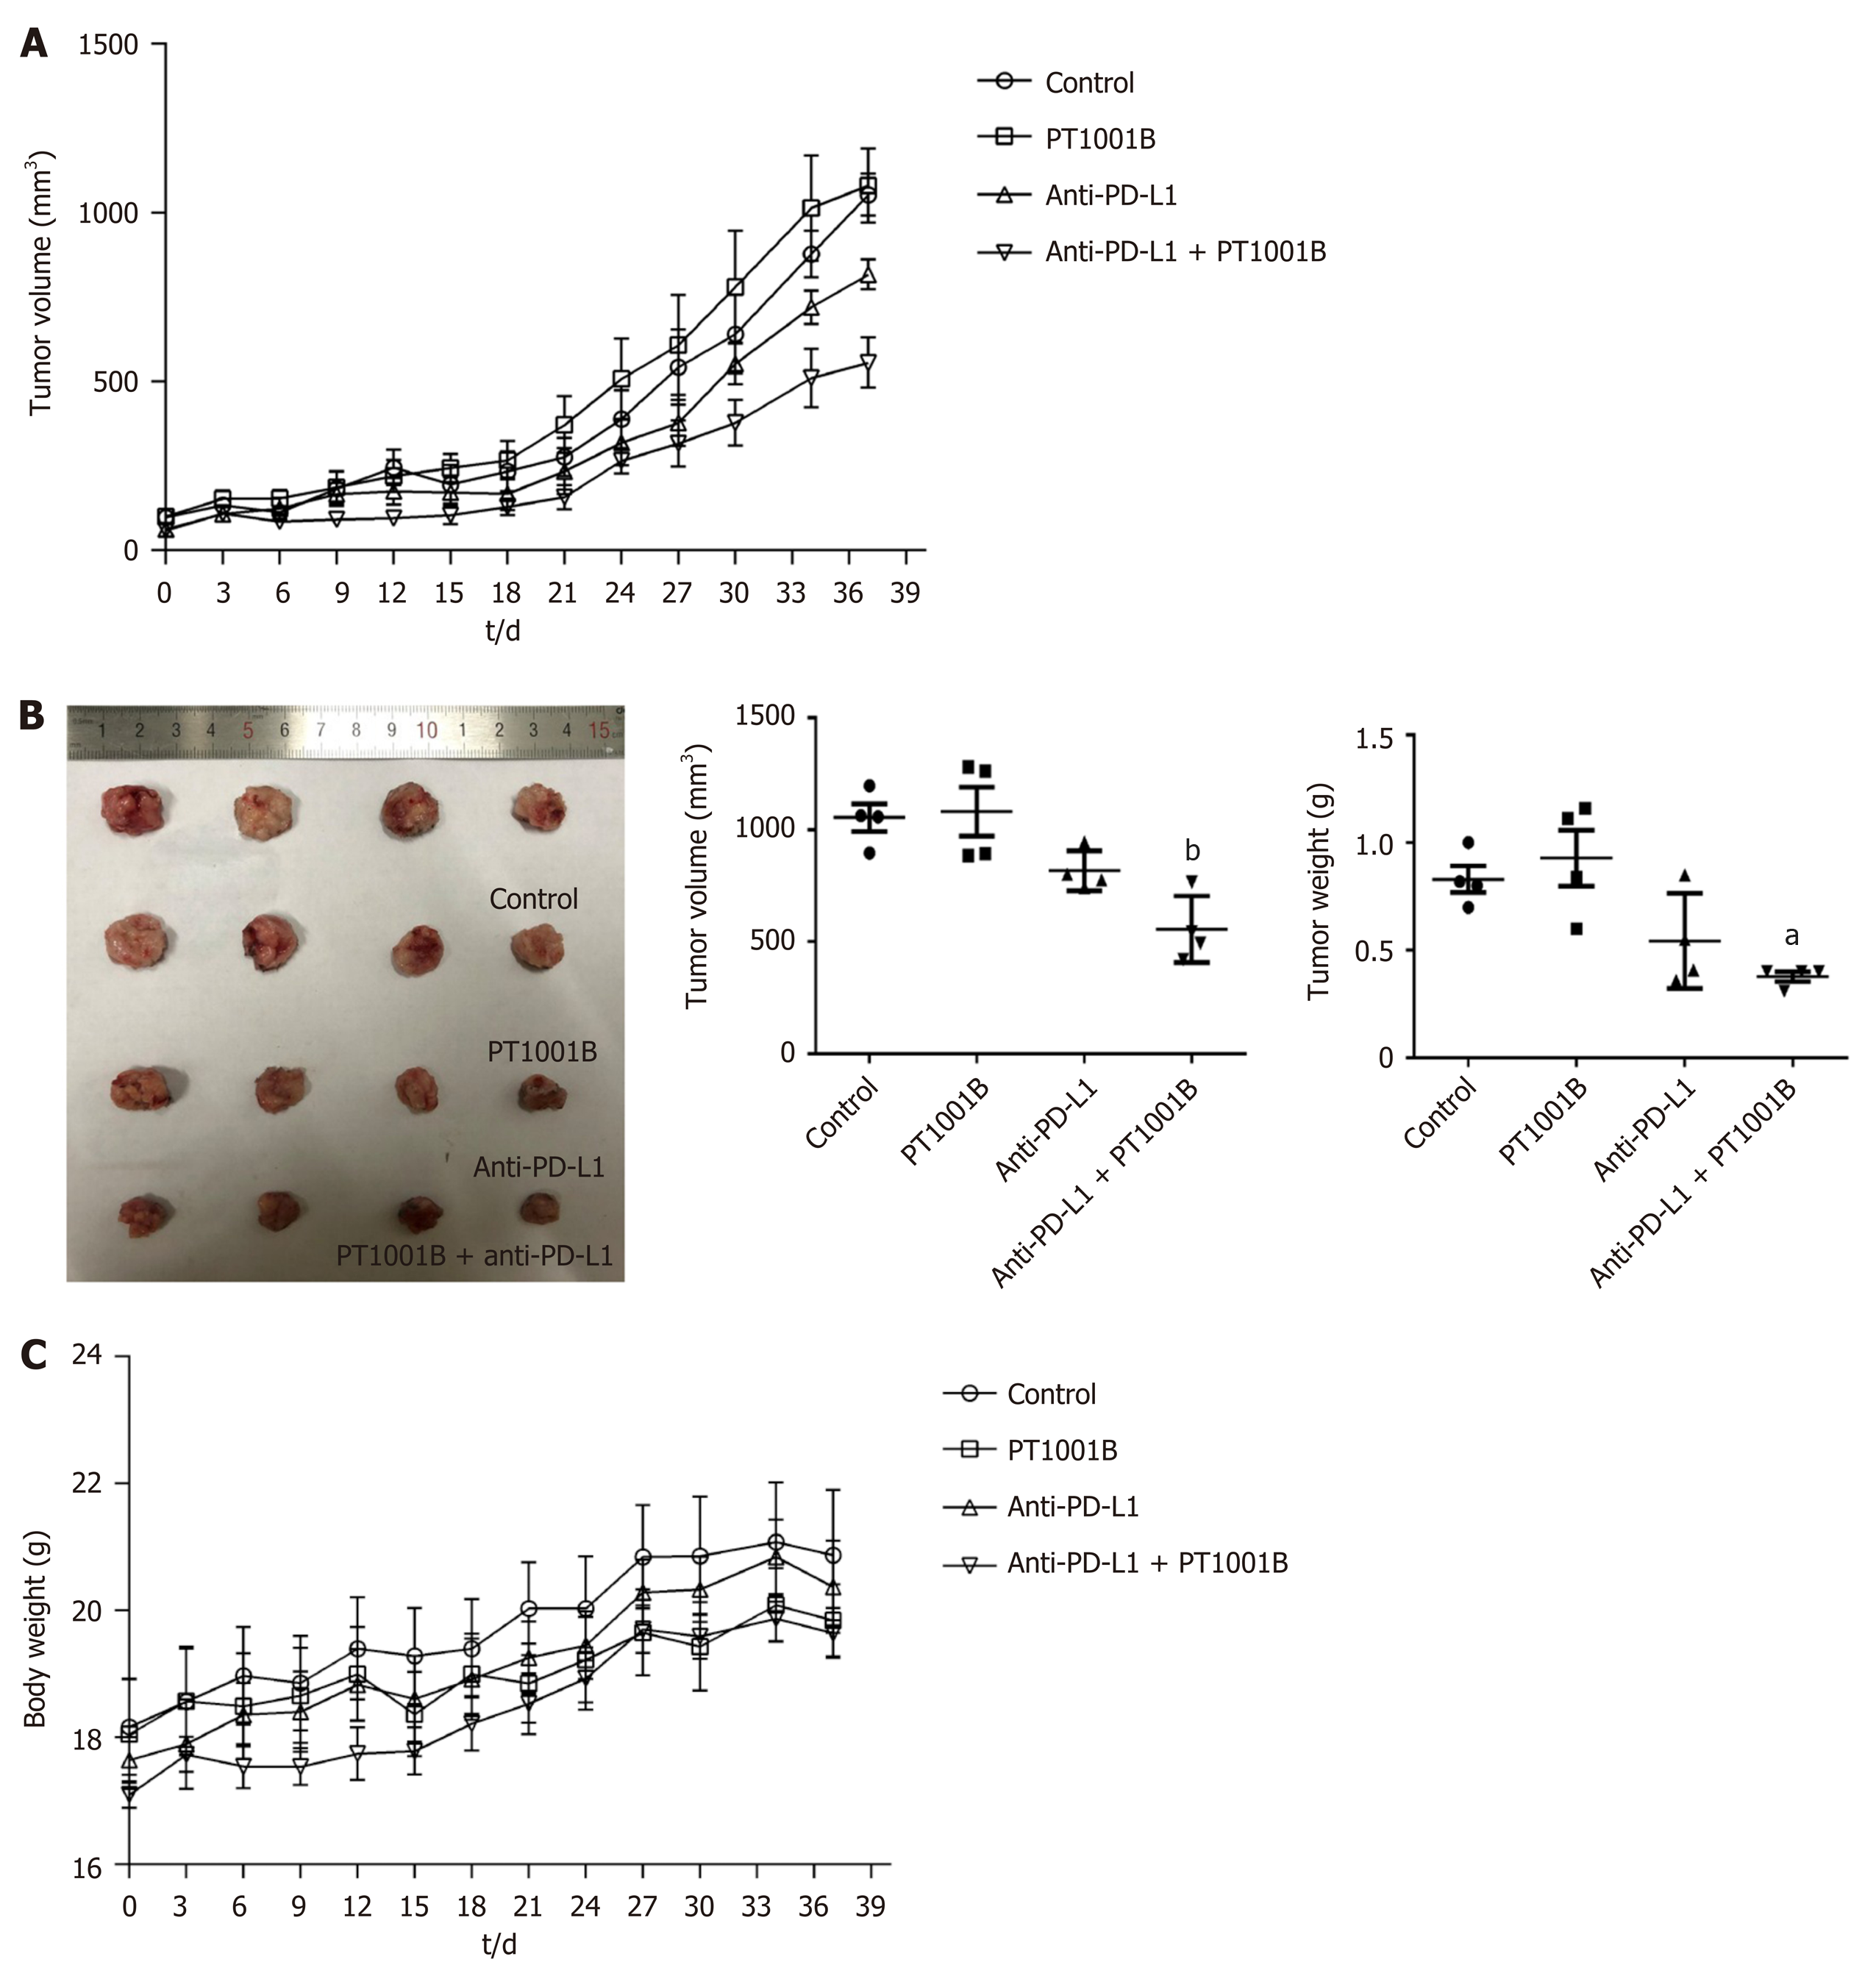
Figure 2 The combination of PT1001B and programmed death-ligand-1 blockade inhibits the development of pancreatic ductal adenocarcinoma in mice.
Panc02 cells were surgically transplanted into C57BL/6 mice. One week later, tumors reached approximately 100 mm3, and tumor-bearing mice were randomly divided into four groups that were treated with PT1001B (30 mg/kg body weight, once daily) or anti- programmed death-ligand-1 (PD-L1) mAb (200 μg/mouse, every 2 d for 5 intervals) alone or in combination via intraperitoneal injection for 37 d. A: The combination of PT1001B and anti-PD-L1 mAb significantly inhibited tumor growth; B: Tumors in different treated groups; C: Mouse body weight curve. The values were analyzed by one-way ANOVA. Data represent the mean ± SE (n = 4). aP < 0.05, bP < 0.01 vs control group. PD-L1: Programmed death-ligand-1.
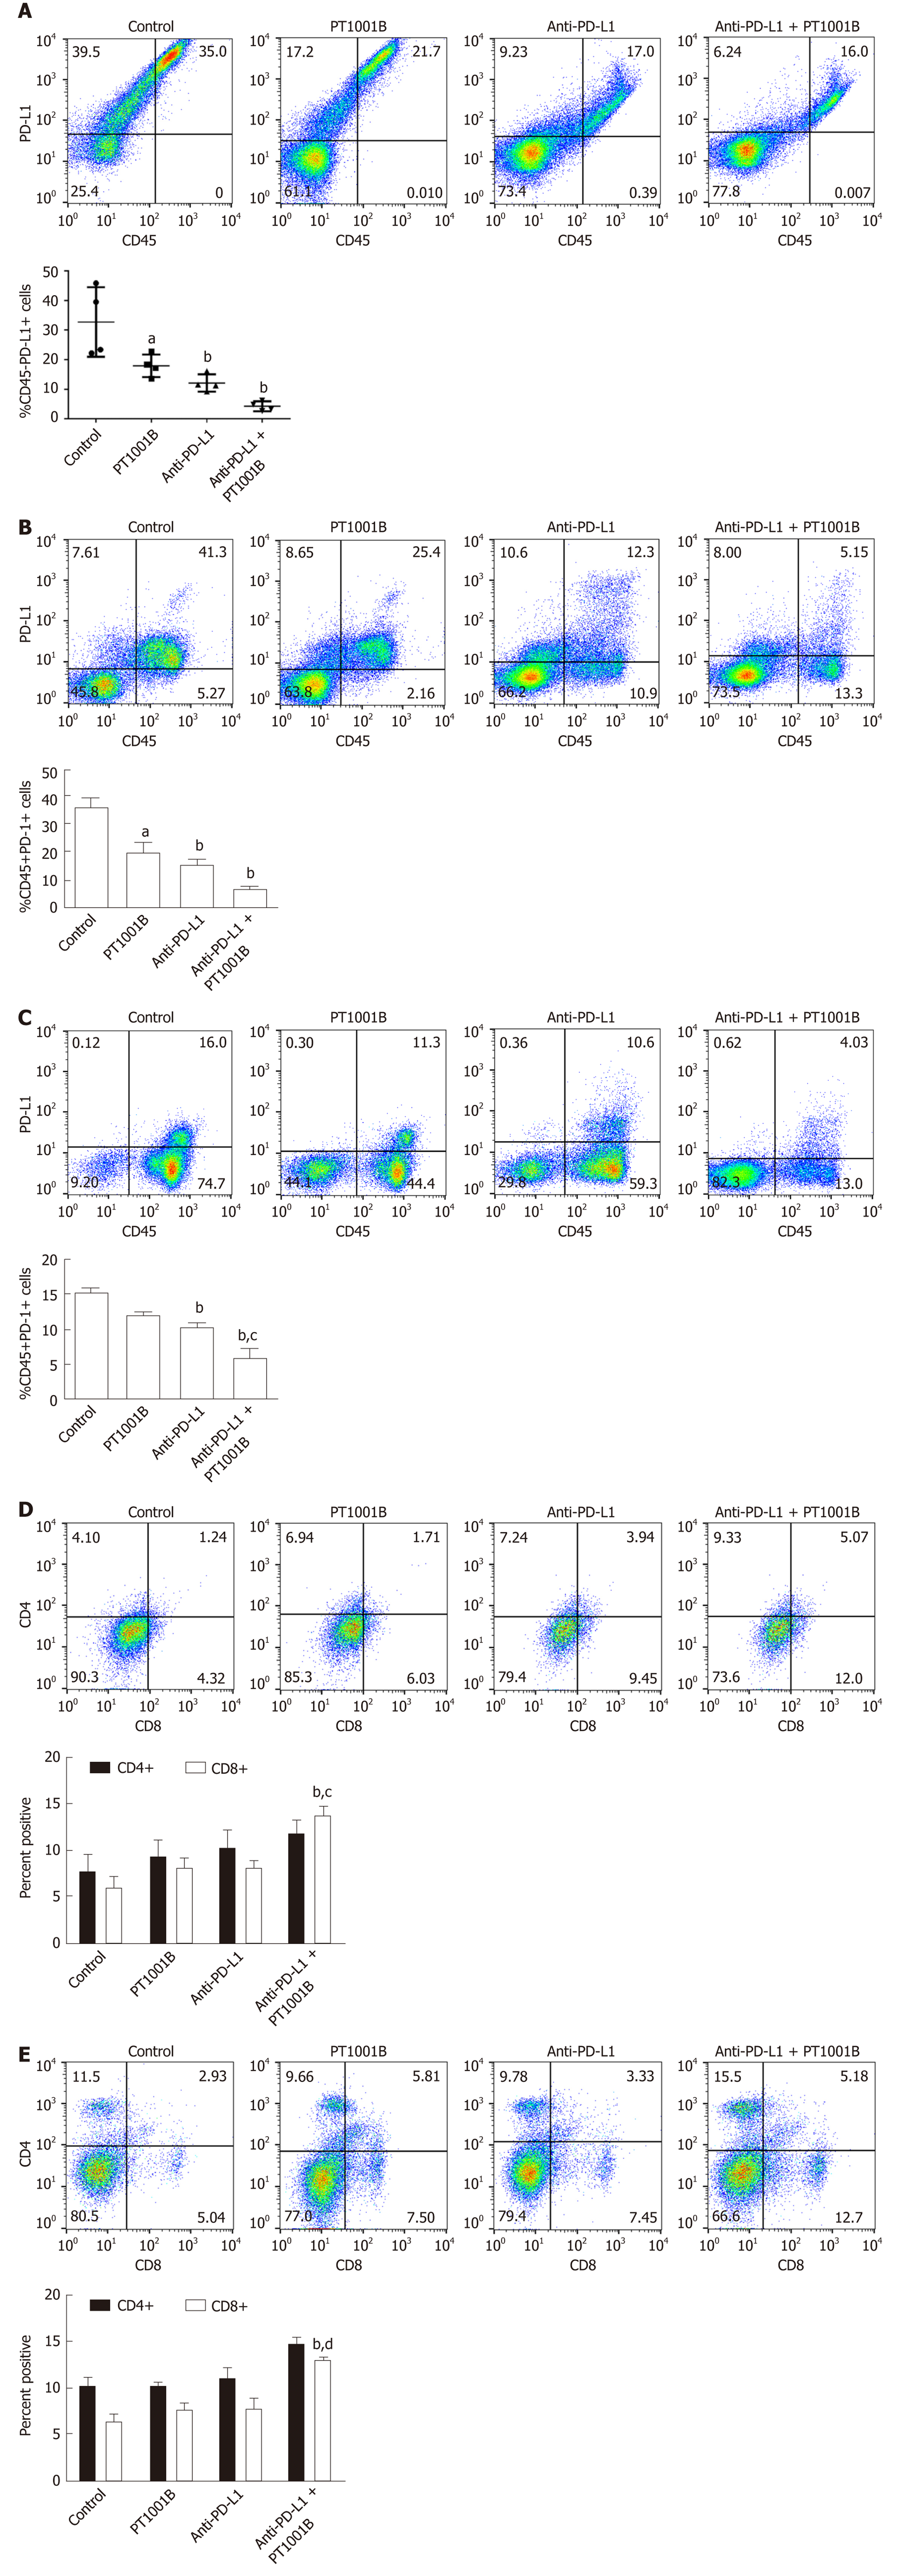
Figure 3 PT1001B enhances antitumor immunity.
Cell suspensions were prepared from pancreatic tumor tissues and spleens from the four groups of tumor-bearing mice and stained with CD45-, CD4-, CD8-, PD-L1-, and PD-1-specific antibodies. Stained cells were analyzed by flow cytometry. The left panel presents representative images, and the right panel shows the statistical analysis. A: Analysis of CD45-/PD-L1+ cells in the tumors; B: Analysis of CD45+/PD-1+ cells in the tumors; C: Analysis of CD45+/PD-1+ cells in the spleens; D: Analysis of CD4+ T cells and CD8+ T cells in the tumors; E: Analysis of CD4+ T cells and CD8+ T cells in the spleens. Differences in the percentages of cells were analyzed by one-way ANOVA. Data represent the mean ± SE (n = 4). aP < 0.05, bP < 0.01 vs control group; cP < 0.05, dP < 0.01 vs anti-PD-L1 group. PD-L1: Programmed death-ligand-1; PD-1: Programmed death-1.
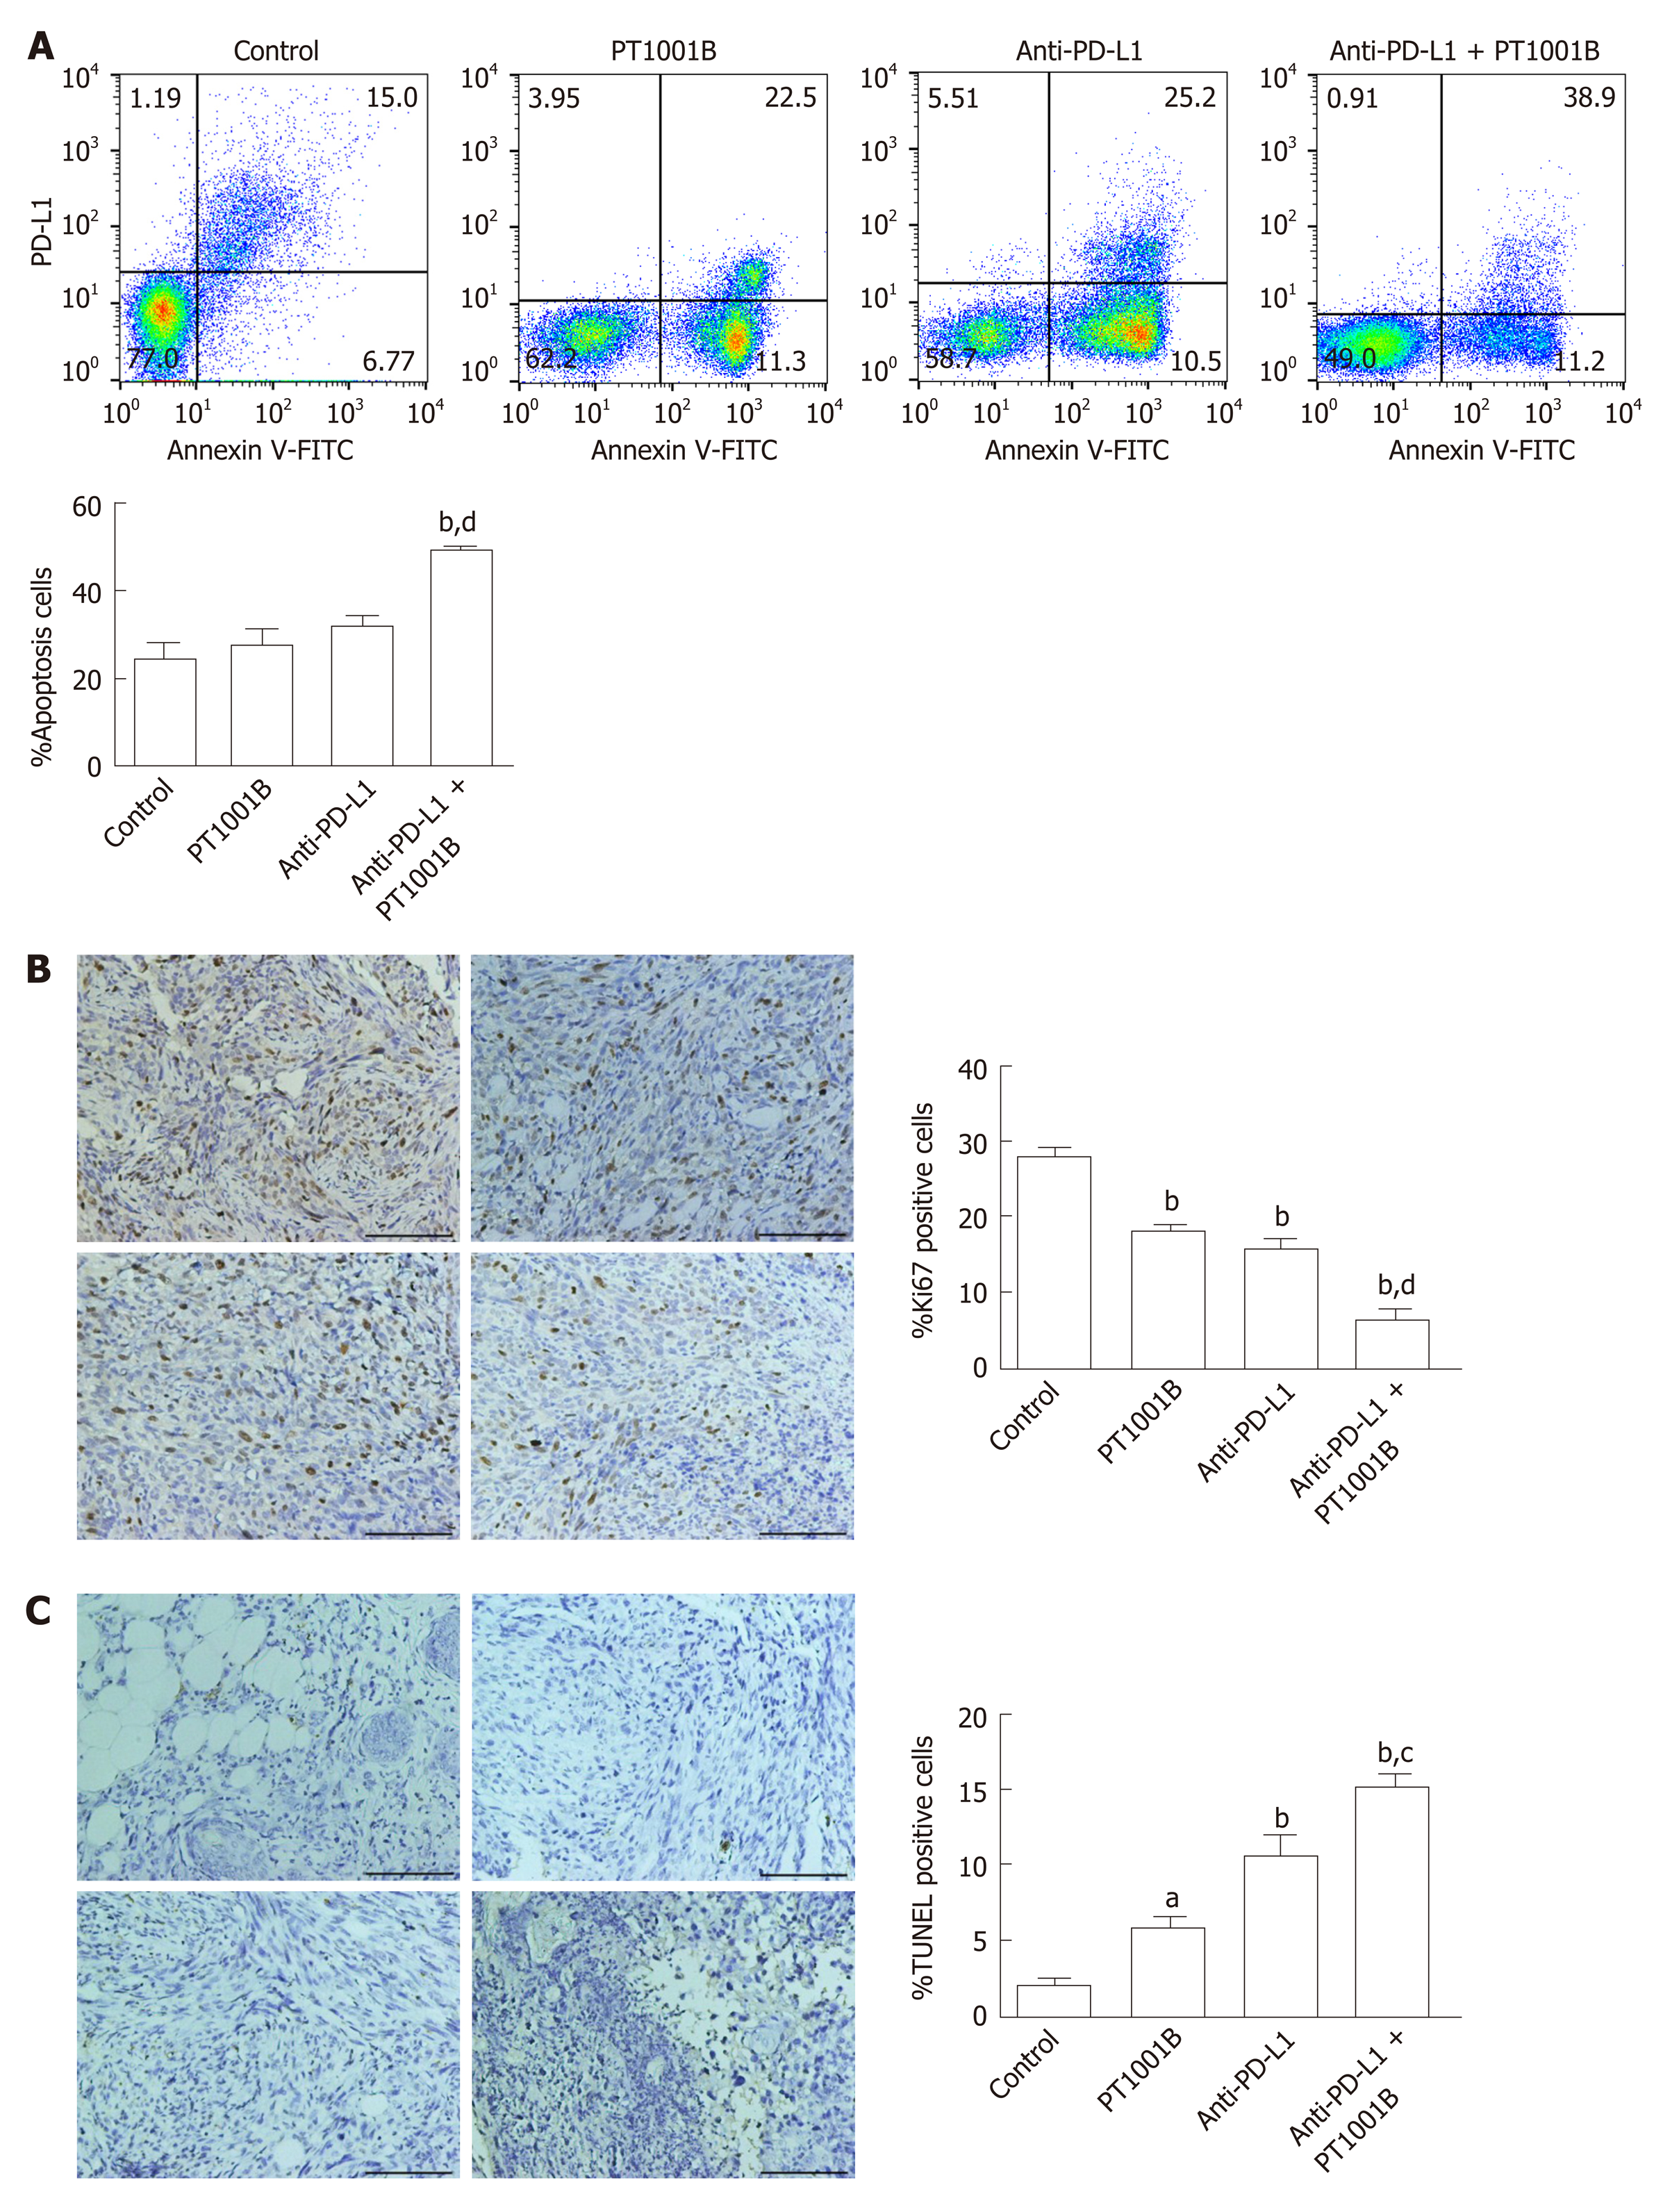
Figure 4 Effect of PT1001B and anti-programmed death-ligand-1 mAb on tumor cell proliferation and apoptosis.
A: Cell suspensions prepared from pancreatic tumor tissues were stained with annexin V and propidium iodide to analyze the apoptosis rate by flow cytometry; B: The four groups of tumors were sectioned and stained for Ki67 (brown); C: The four groups of tumors were sectioned and subjected to TUNEL assay (brown). Representative images are shown. a: Control; b: PT1001B; c: Anti-programmed death-ligand-1 (PD-L1) mAb; d: Anti-PD-L1 mAb + PT1001B. Scale bars = 100 µm. The populations of apoptotic cells, Ki67-positive, or TUNEL-positive cells were analyzed by one-way ANOVA. Data represent the mean ± SE (n = 4). aP < 0.05, bP < 0.01 vs control group; cP < 0.05, dP < 0.01 vs anti-PD-L1 group. PI: Propidium iodide; FITC: Fluorescein Isothiocyanate; PD-L1: Programmed death-ligand-1; TUNEL: Terminal deoxynucleotidyl transferase mediated dUTP nick-end labeling.
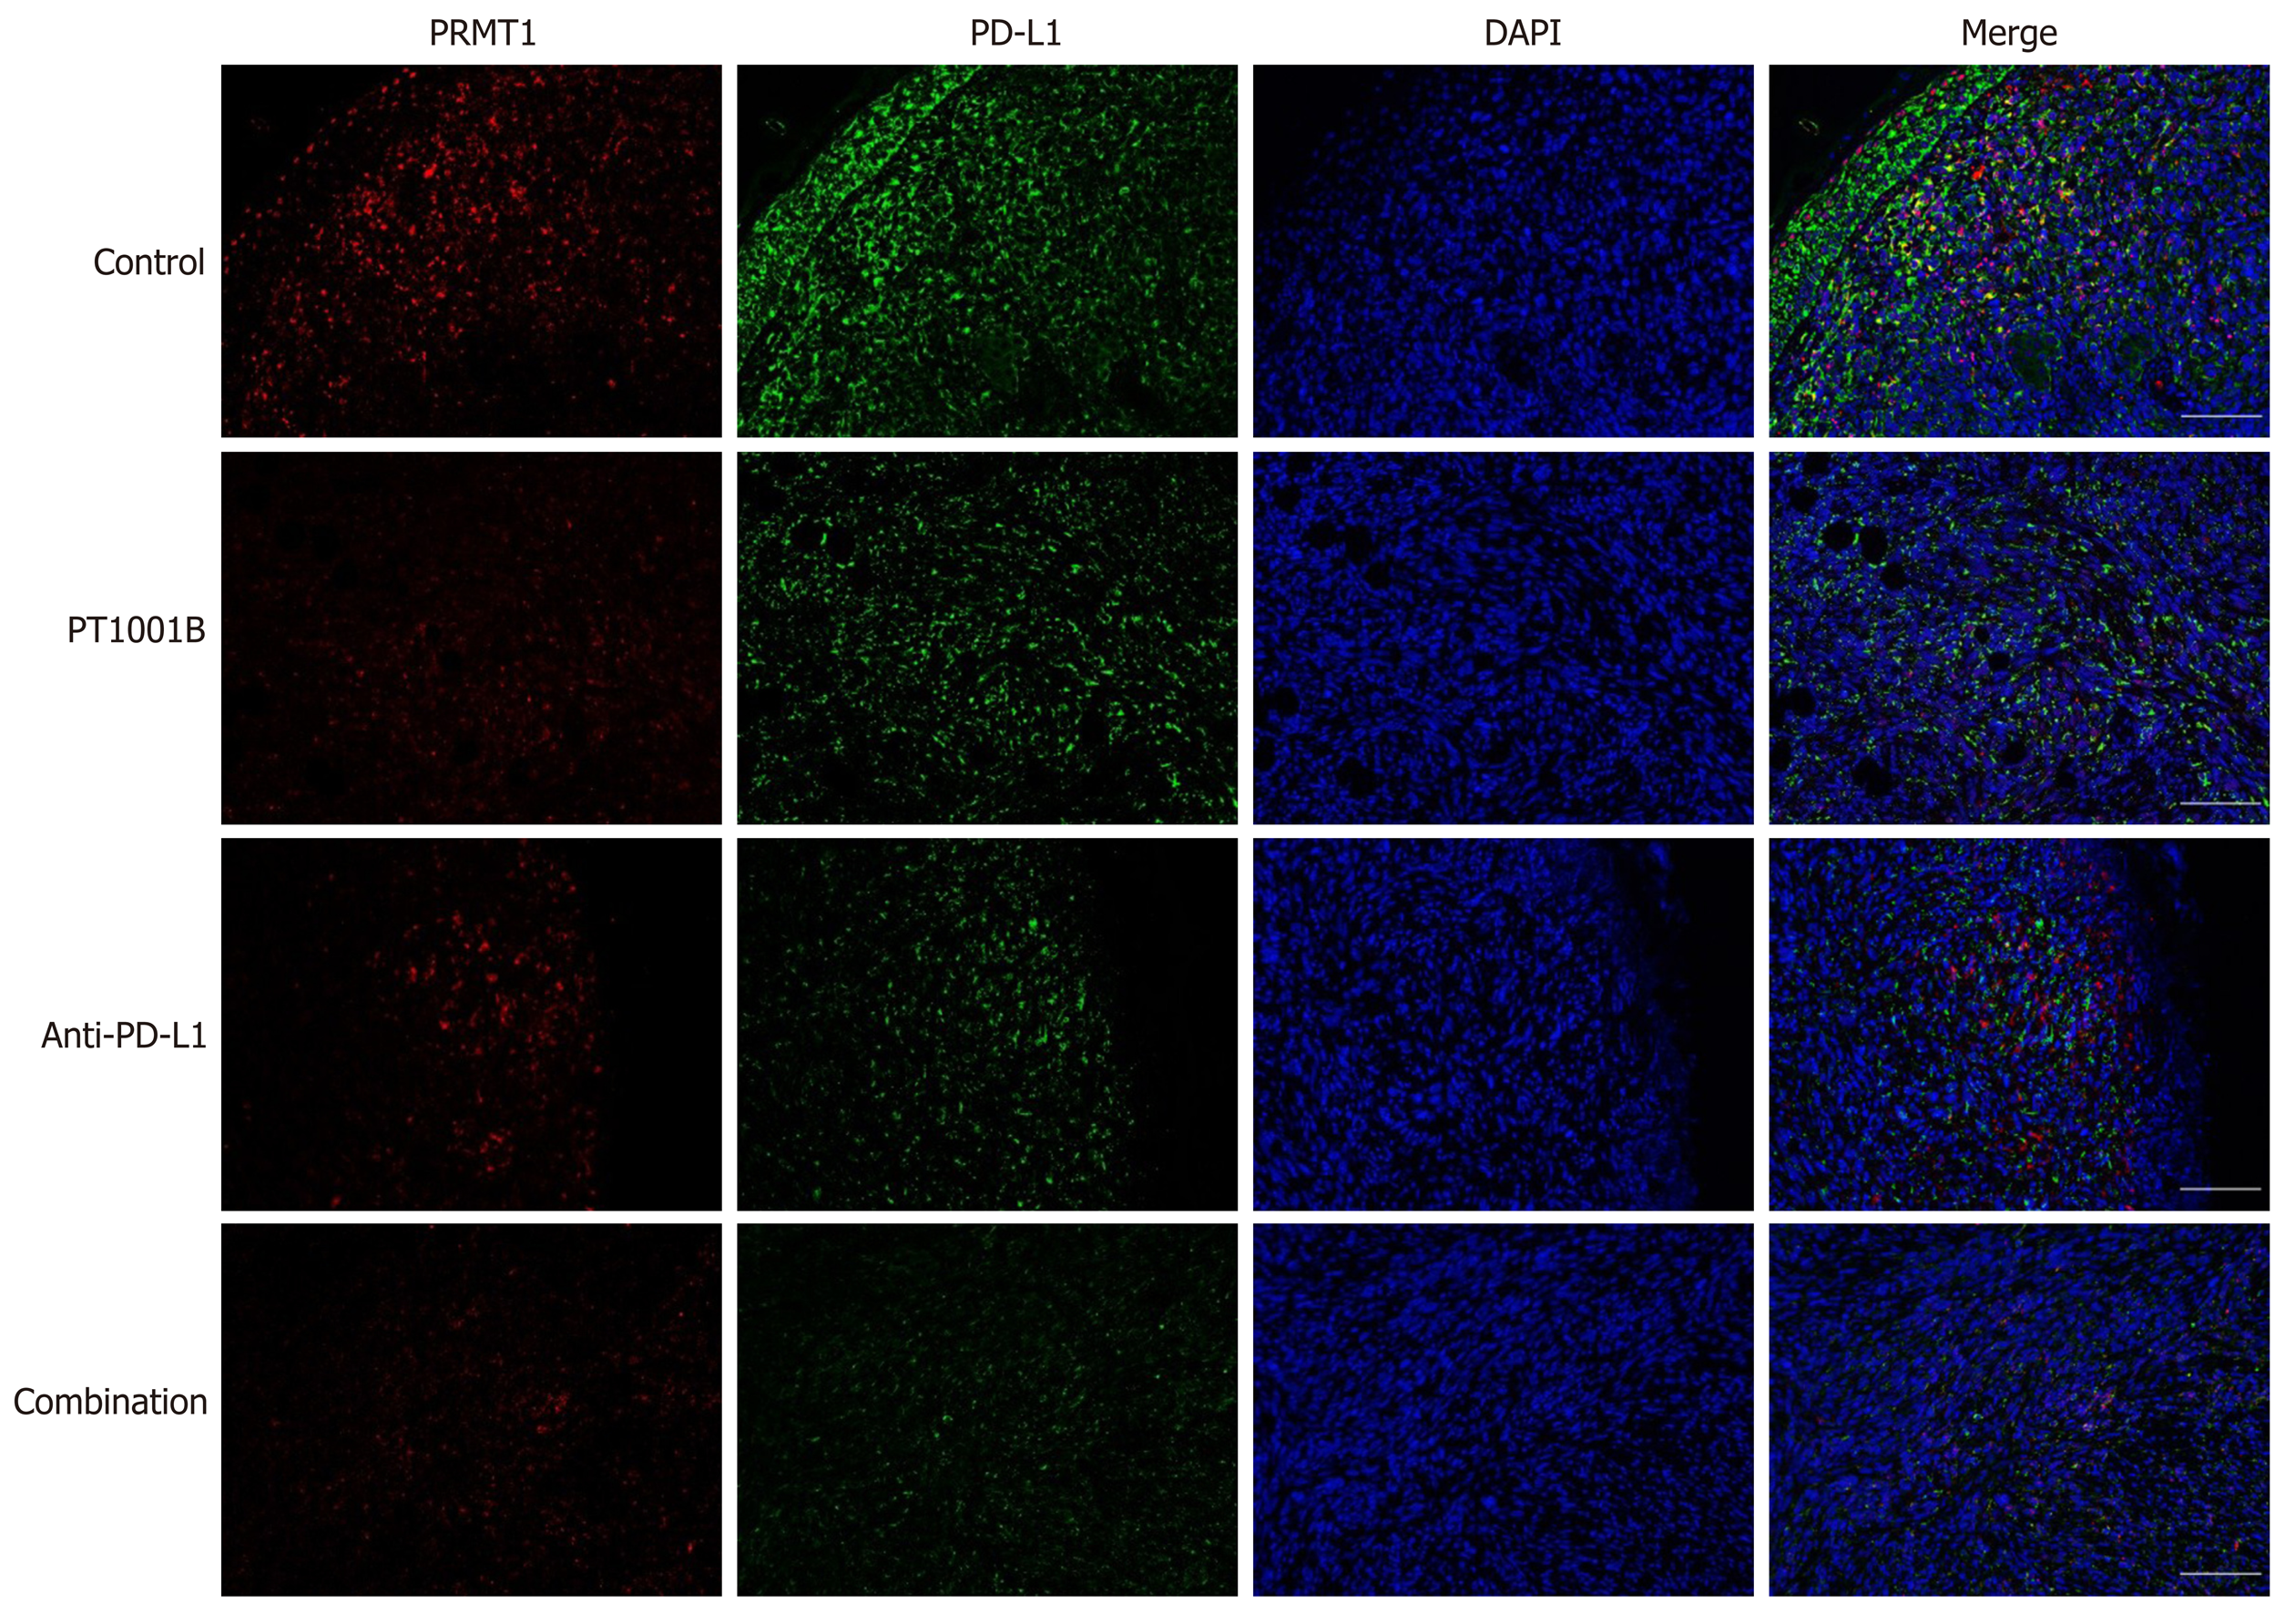
Figure 5 Immunofluorescence analysis of protein arginine methyltransferase and programmed death-ligand-1 in tumor tissue.
Protein arginine methyltransferase 1 is shown in red, programmed death-ligand-1 is shown in green, and DAPI staining indicates the nucleus. Scale bars = 100 µm. PRMT: Protein arginine methyltransferase; PD-L1: Programmed death-ligand-1; DAPI: 2-(4-Amidinophenyl)-6-indolecarbamidine dihydrochloride.
- Citation: Zheng NN, Zhou M, Sun F, Huai MX, Zhang Y, Qu CY, Shen F, Xu LM. Combining protein arginine methyltransferase inhibitor and anti-programmed death-ligand-1 inhibits pancreatic cancer progression. World J Gastroenterol 2020; 26(26): 3737-3749
- URL: https://www.wjgnet.com/1007-9327/full/v26/i26/3737.htm
- DOI: https://dx.doi.org/10.3748/wjg.v26.i26.3737


