Copyright
©The Author(s) 2020.
World J Gastroenterol. Jun 21, 2020; 26(23): 3225-3235
Published online Jun 21, 2020. doi: 10.3748/wjg.v26.i23.3225
Published online Jun 21, 2020. doi: 10.3748/wjg.v26.i23.3225
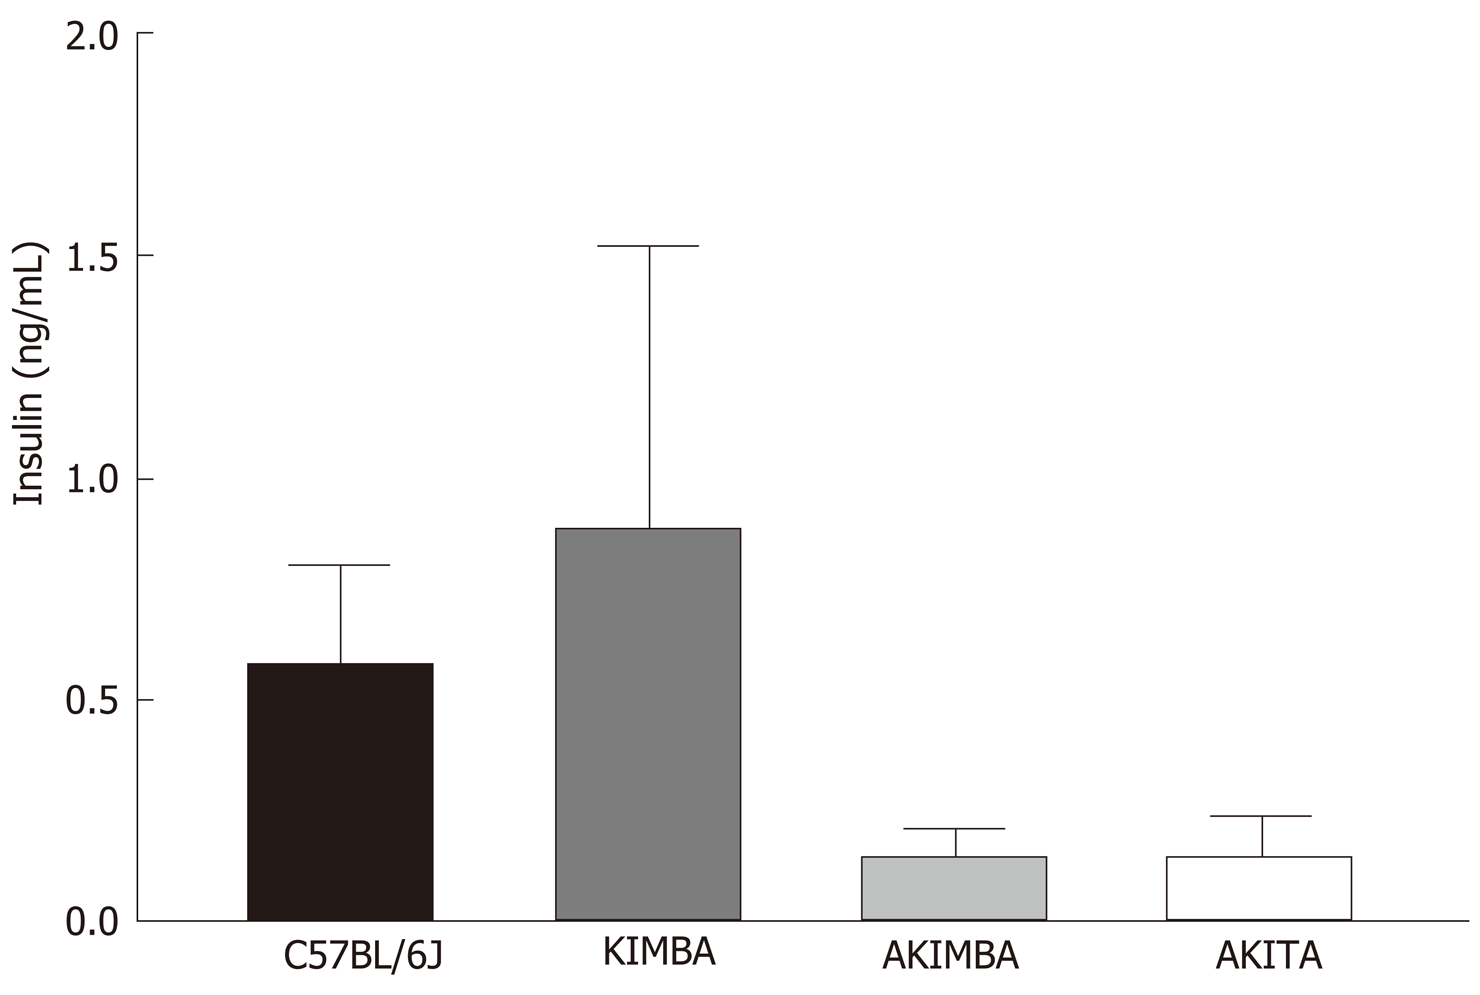
Figure 1 Insulin dysregulation prevails in mice with type 1 diabetes.
Serum insulin levels are reduced in Akimba and Akita mice. n = 3-8 mice/group. All data represented as mean ± SE.
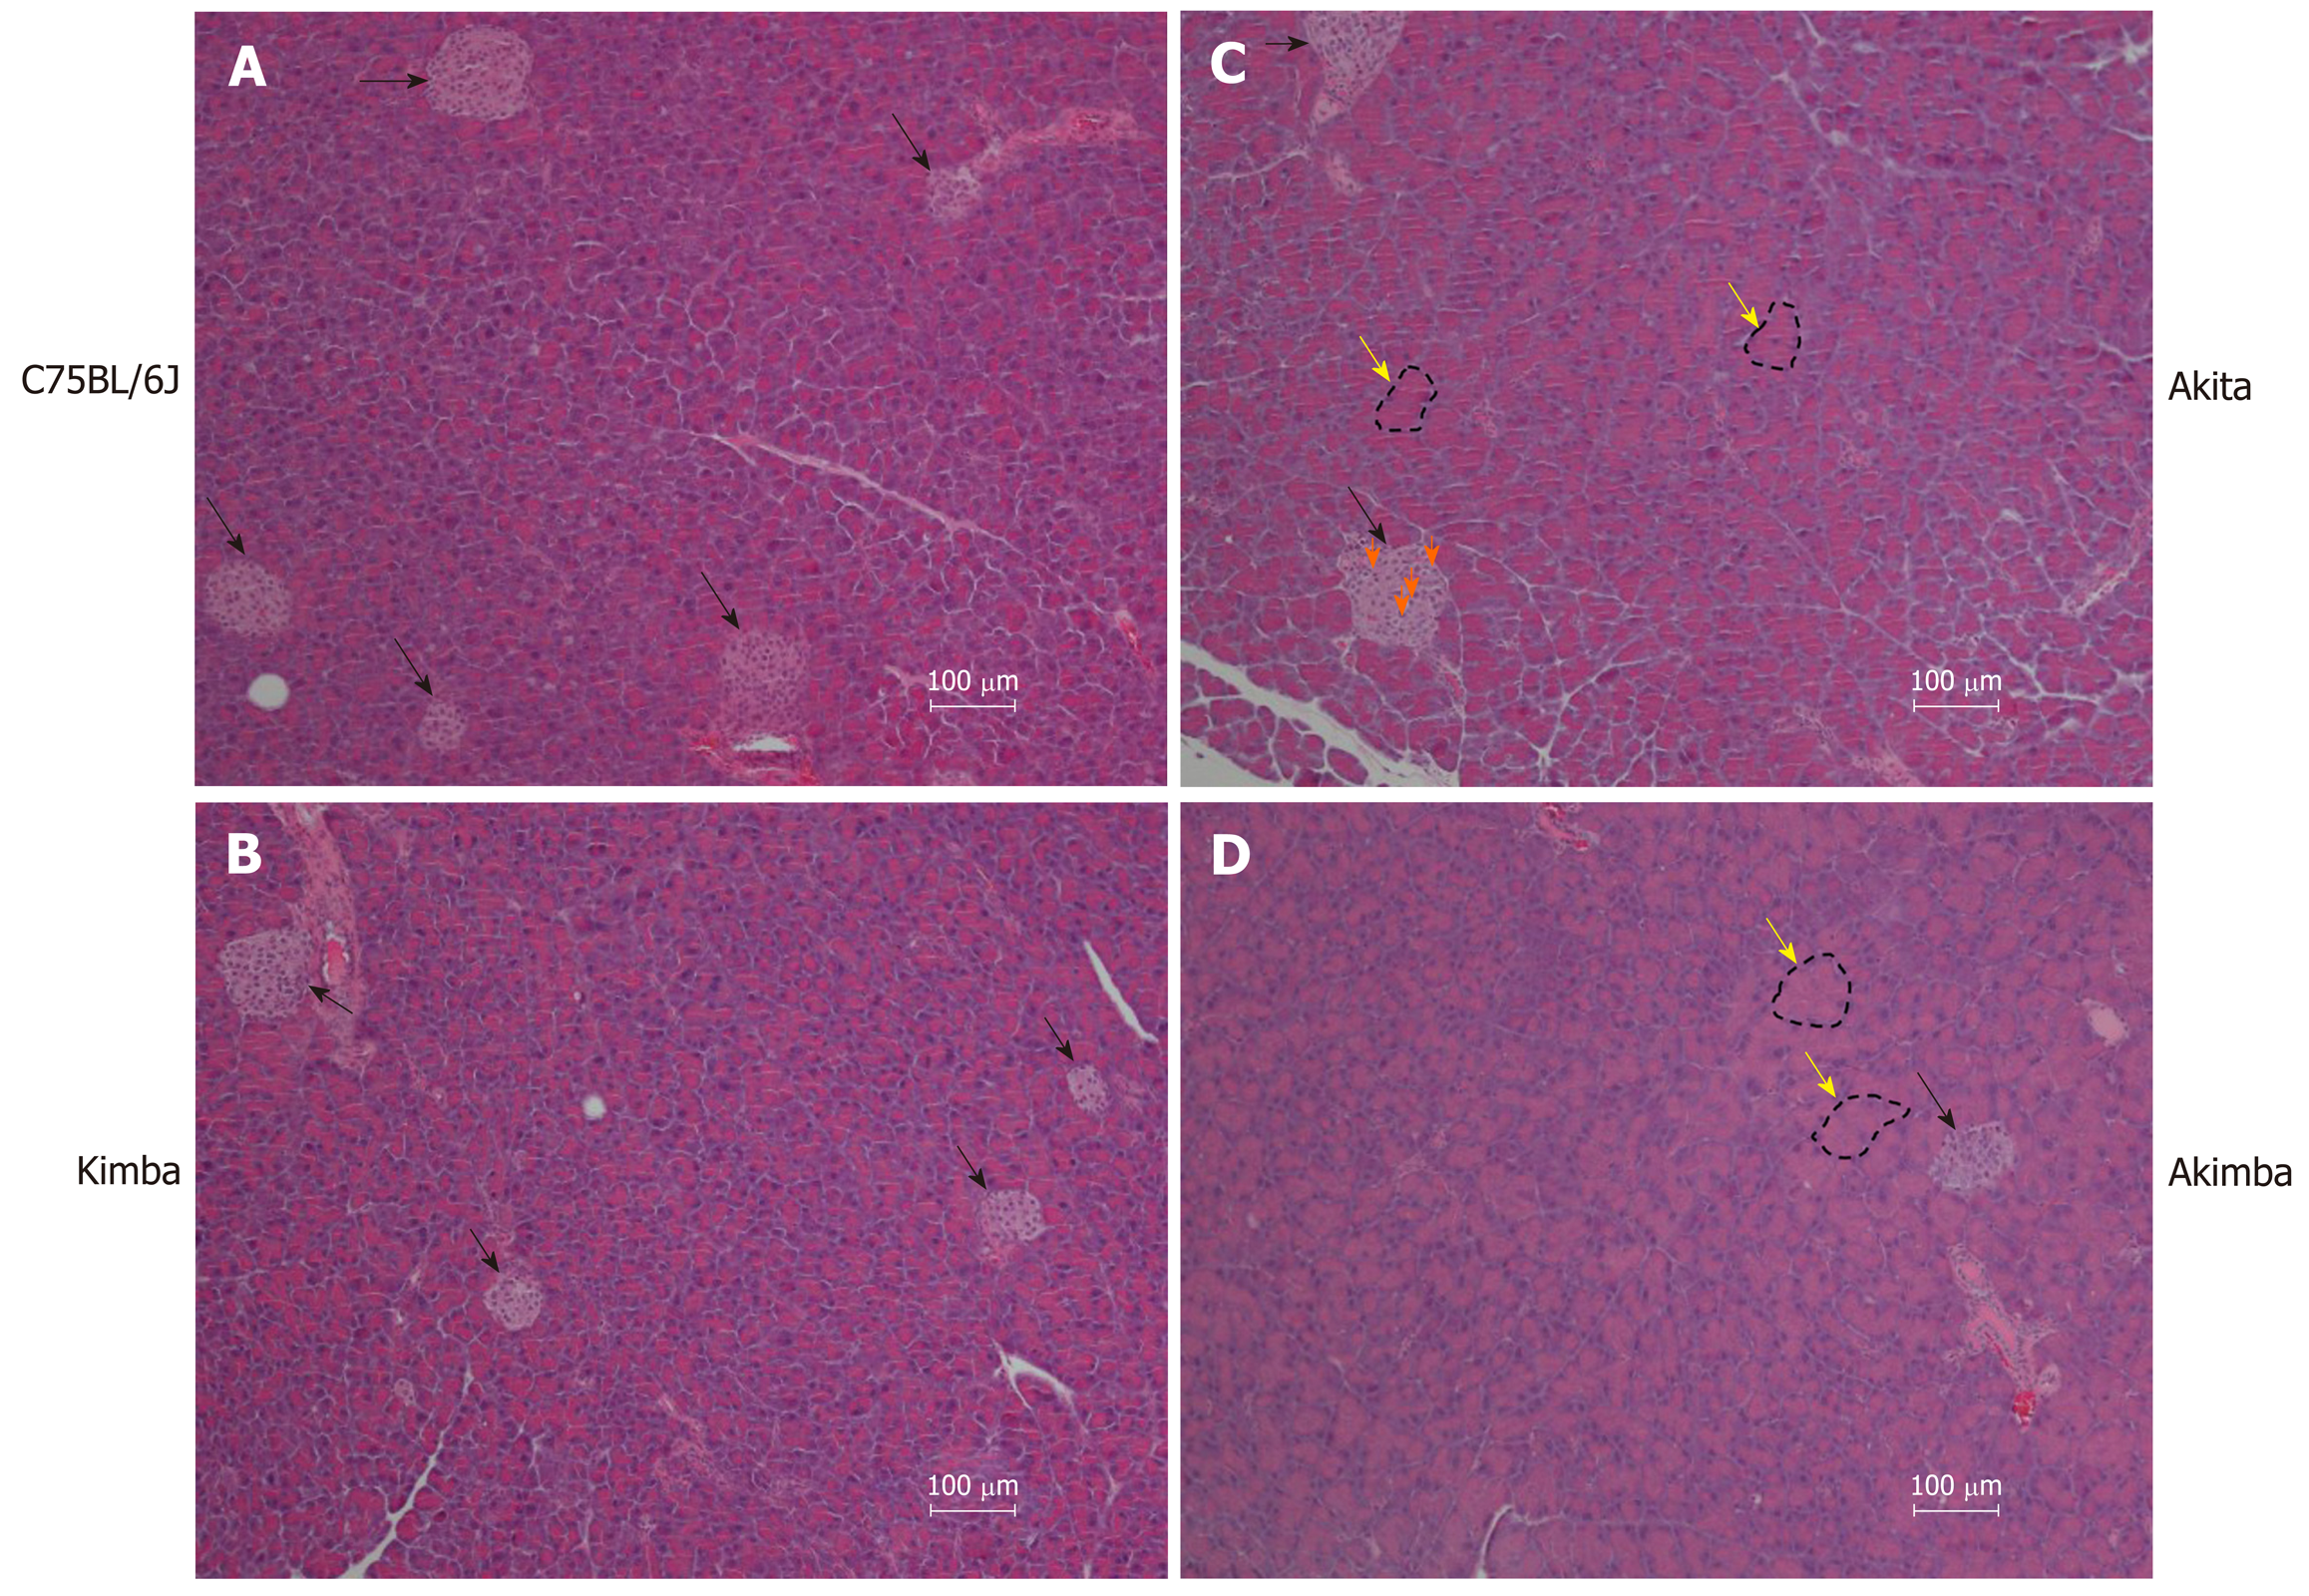
Figure 2 Acute pancreatic injury in Akita and Akimba mice.
A: Representative pancreatic images of C57BL/6J mice; B: Representative pancreatic images of Kimba mice; C: Representative pancreatic images of Akita mice; D: Representative pancreatic images of Akimba mice. Black arrows indicate islets; Yellow arrows and dotted outline indicates swollen acinar cells and orange arrows indicate apoptotic bodies in islets; Scale bar = 100 µm.
Figure 3 The diabetic retinopathy pathogenic metabolite, succinate, is downregulated with sodium glucose co-transporter 2 inhibition in Akimba mice.
A: Serum succinate levels in Akimba mice treated with dapapagliflozin; B: Serum succinate levels in Akimba mice treated with empagliflozin; C: Serum levels of the beneficial short chain fatty acid, butyric acid, are elevated in diabetic Akita mice with sodium glucose co-transporter 2 inhibition. n = 3-7 mice/group for all groups except for control Akimba (Figure 3B) where n = 2; aP < 0.03; Data represented as mean ± SE.
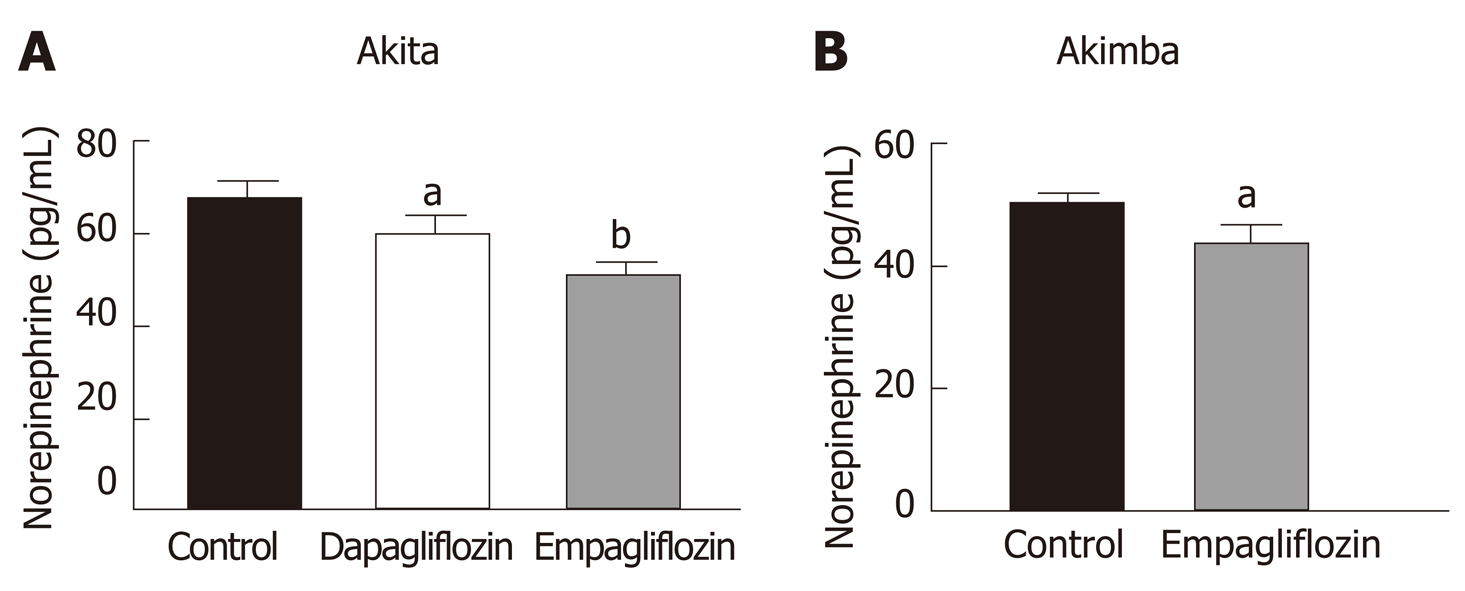
Figure 4 Inhibition of sodium glucose cotransporter 2 promotes sympathoinhibition in the kidney of diabetic Akita and Akimba mice.
A: Renal norepinephrine levels in Akita; B: Renal norepinephrine levels in Akimba mice. n = 3-7 mice/group; aP < 0.05; bP < 0.005; All data represented as mean ± SE.
Figure 5 Inhibition of sodium glucose cotransporter 2 reduces serum leptin levels.
A: Serum leptin levels in C57BL/6J. B: Serum leptin levels in Kimba mice treated with dapagliflozin. C: Serum leptin levels in Kimba mice treated with empagliflozin. n = 4-7 mice/group; aP < 0.05; All data represented as mean ± SE.
- Citation: Herat LY, Ward NC, Magno AL, Rakoczy EP, Kiuchi MG, Schlaich MP, Matthews VB. Sodium glucose co-transporter 2 inhibition reduces succinate levels in diabetic mice. World J Gastroenterol 2020; 26(23): 3225-3235
- URL: https://www.wjgnet.com/1007-9327/full/v26/i23/3225.htm
- DOI: https://dx.doi.org/10.3748/wjg.v26.i23.3225


