Copyright
©The Author(s) 2020.
World J Gastroenterol. Jun 14, 2020; 26(22): 3056-3075
Published online Jun 14, 2020. doi: 10.3748/wjg.v26.i22.3056
Published online Jun 14, 2020. doi: 10.3748/wjg.v26.i22.3056
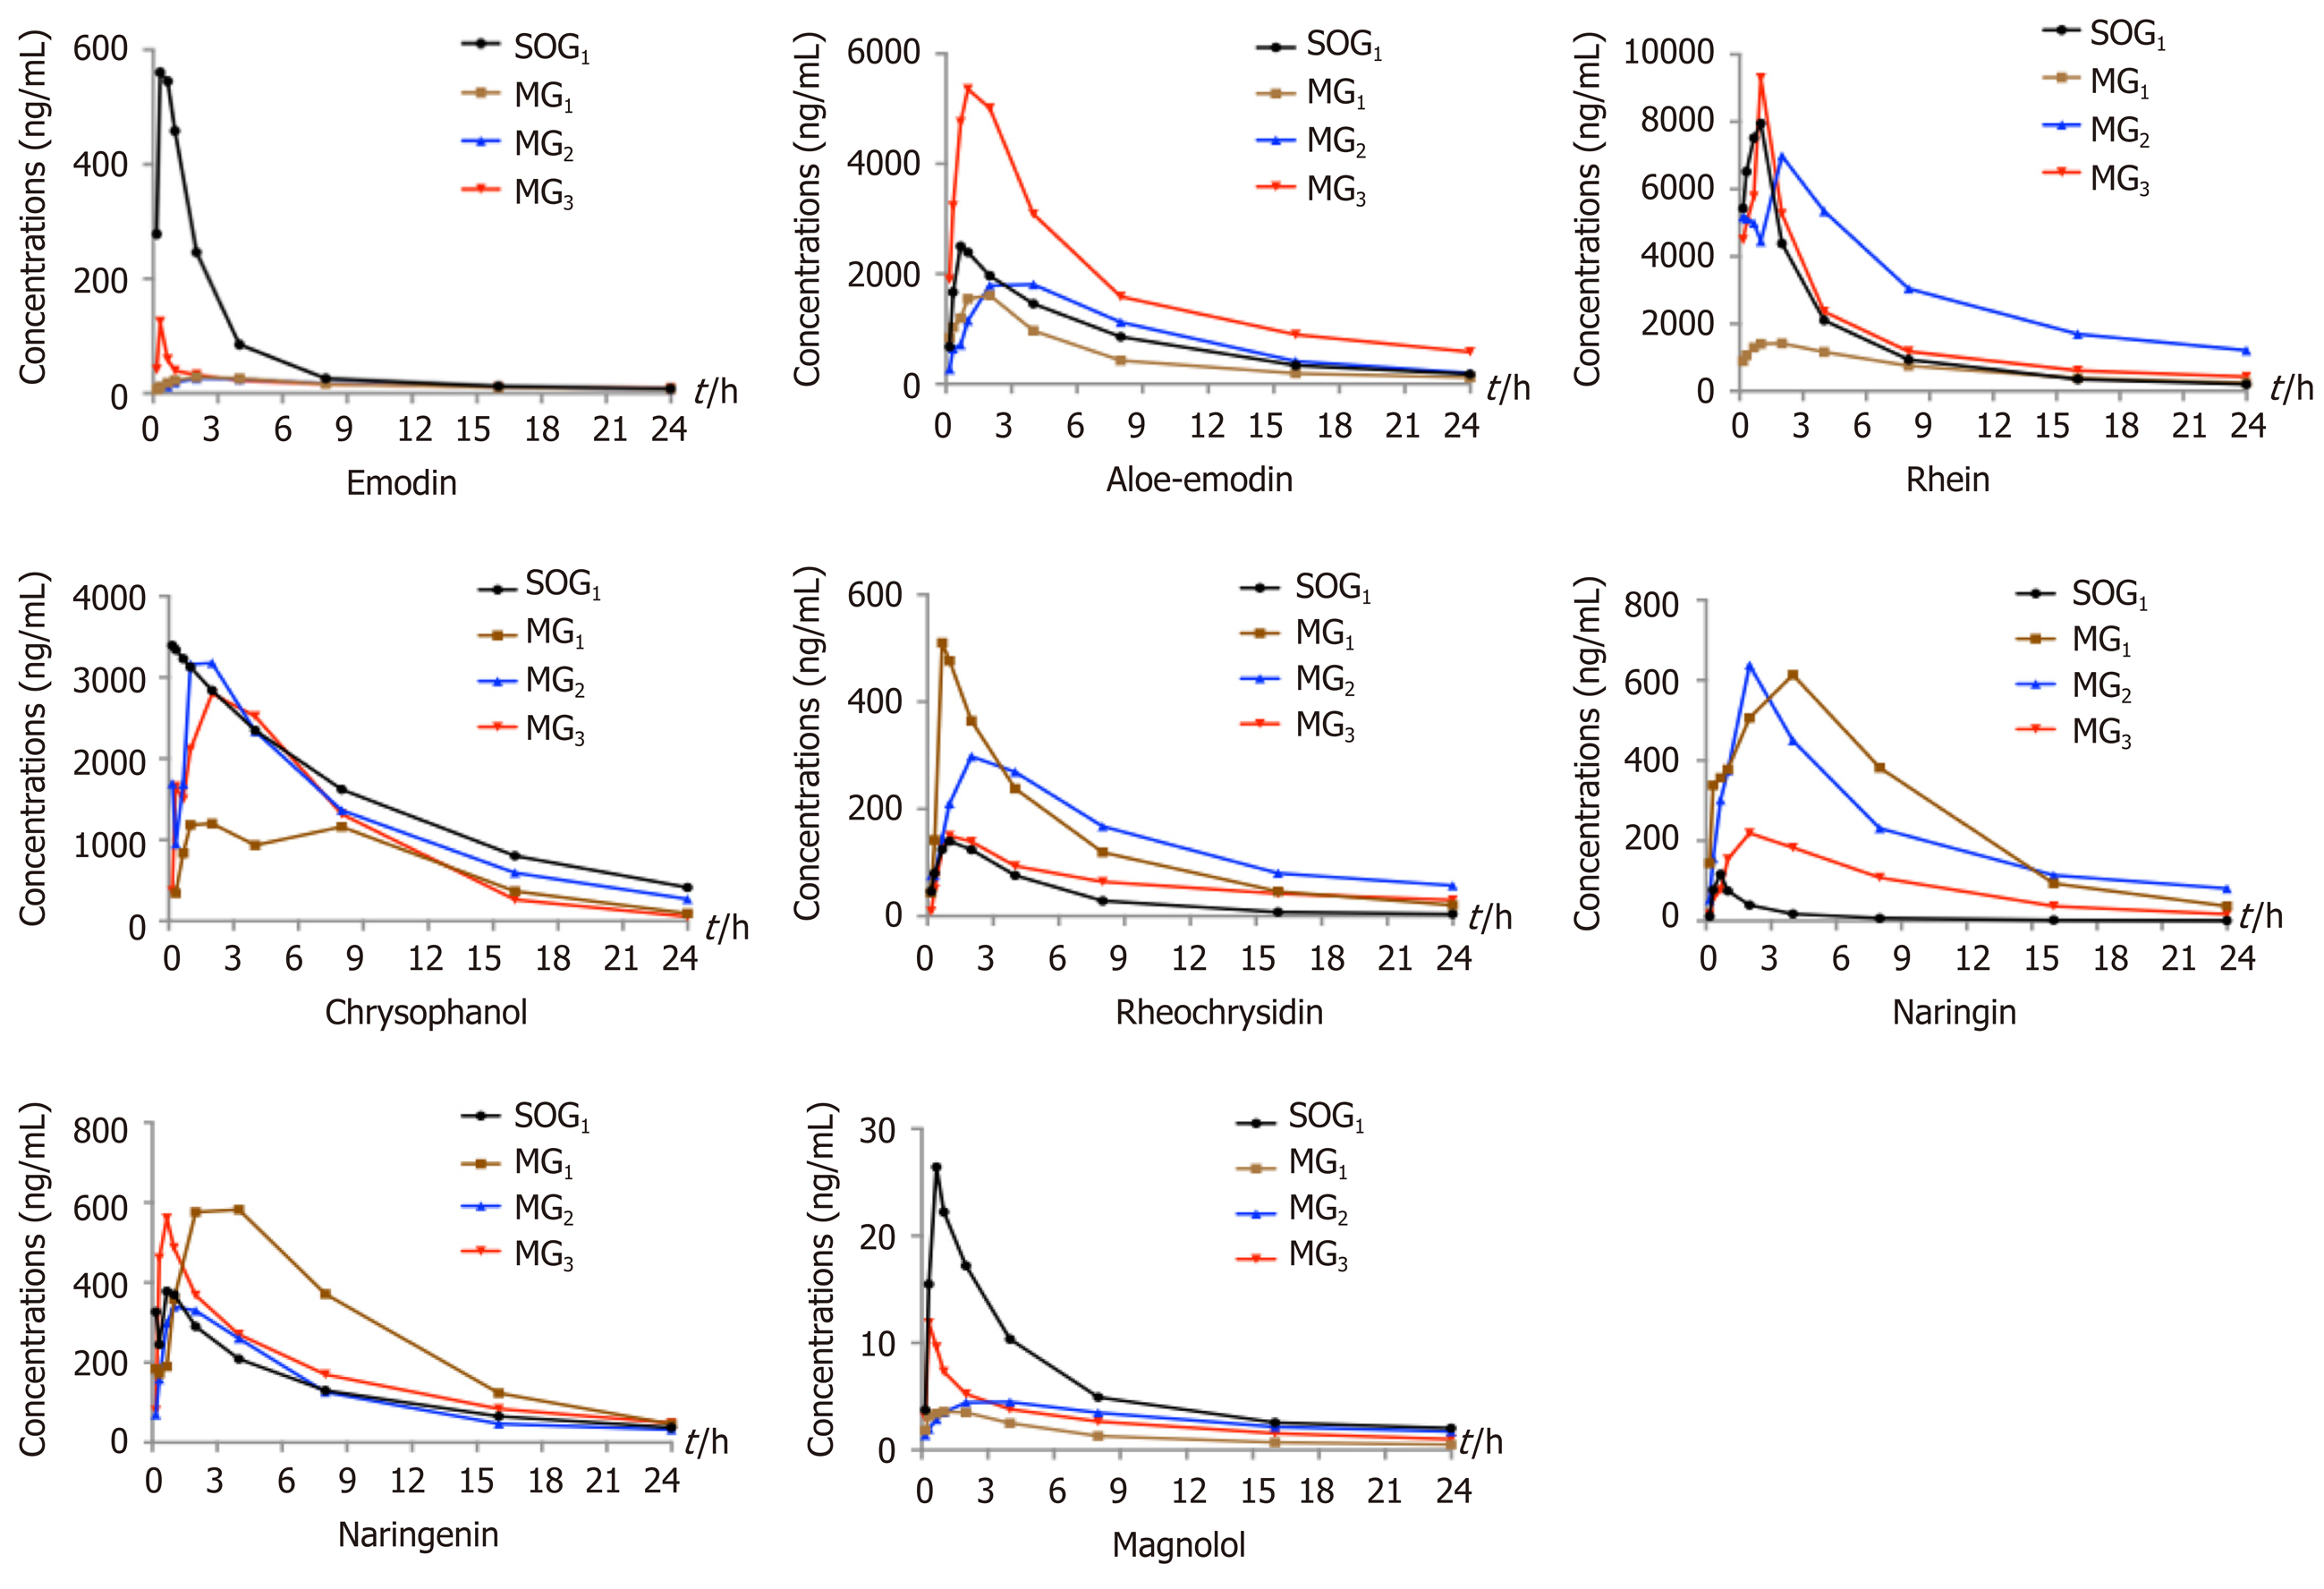
Figure 1 Estimated concentration-time curves of eight components of Dachengqi decoction in the four groups.
Twenty-four male Sprague-Dawley rats were randomly divided into SOG1 and three model groups (MG1, MG2, and MG3), and orally dosed with Dachengqi decoction (DCQD) (10 g/kg). Blood samples were collected via the tail vein at 10 min, 20 min, 40 min, 1 h, 2 h, 4 h, 8 h, 12 h, and 24 h after a single dose of DCQD to detect its main components. SOG1: Sham-operated group with the dosing time at 4 h after operation. MG1, MG2, and MG3: rats were dosed orally with DCQD at 4 h, 12 h, and 24 h after AP induction, respectively.
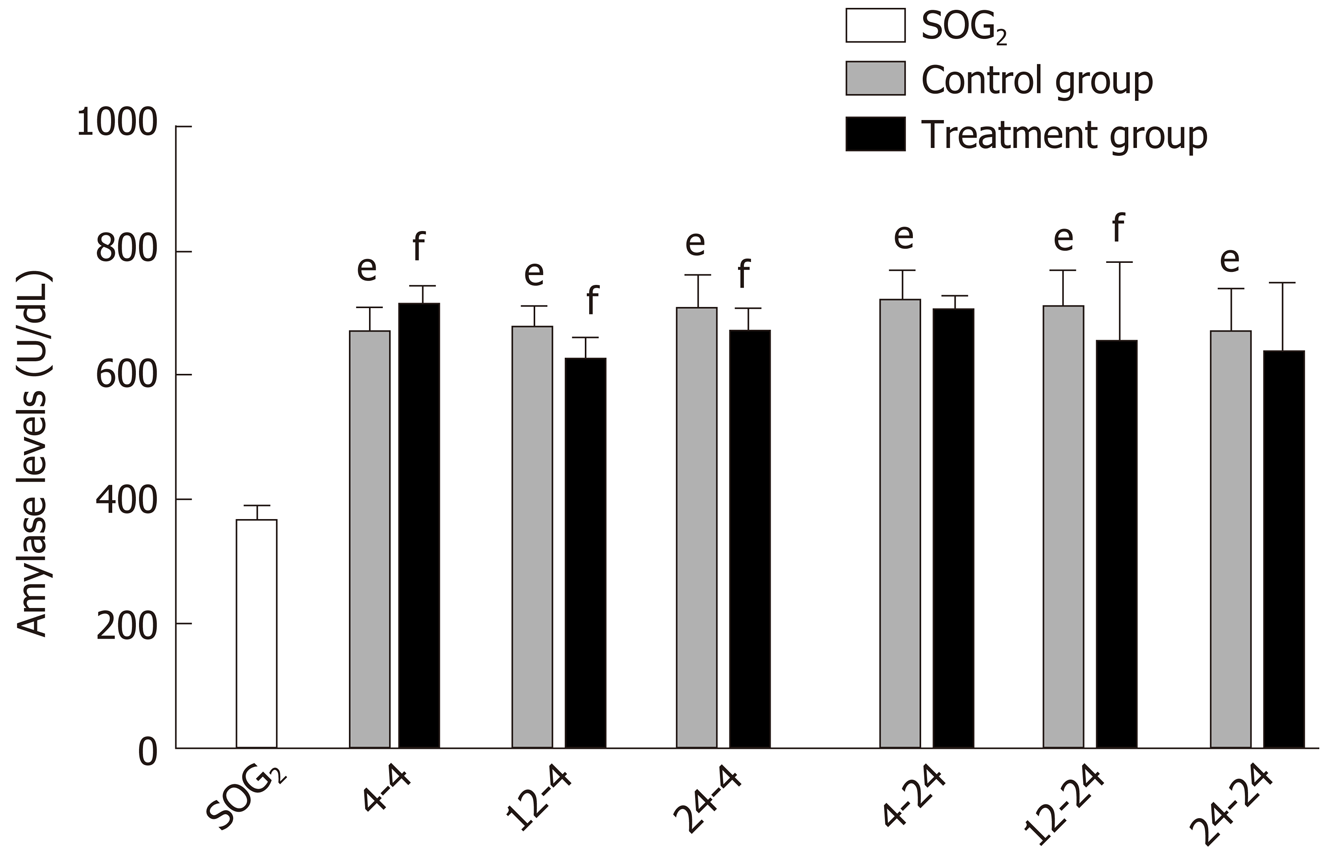
Figure 2 Serum amylase levels in rats.
Rats in each treatment group were orally administered with Dachengqi decoction (DCQD), and rats in each control group and SOG2 were orally administered with normal saline. SOG2: Sham-operated group with the dosing time at 4 h after operation; 4-4, 12-4, and 24-4: Rats were dosed with DCQD at 4 h, 12 h, and 24 h, respectively, after AP induction and were euthanized at 4 h after dosing; 4-24, 12-24, and 24-24: Rats were dosed with DCQD at 4 h, 12 h, and 24 h, respectively, after AP induction and were euthanized at 24 h after dosing. Heart blood samples were collected to detect the amylase levels. Data are expressed as the mean ± SD (n = 6). eP < 0.05 vs SOG2, fP < 0.05 vs control group.
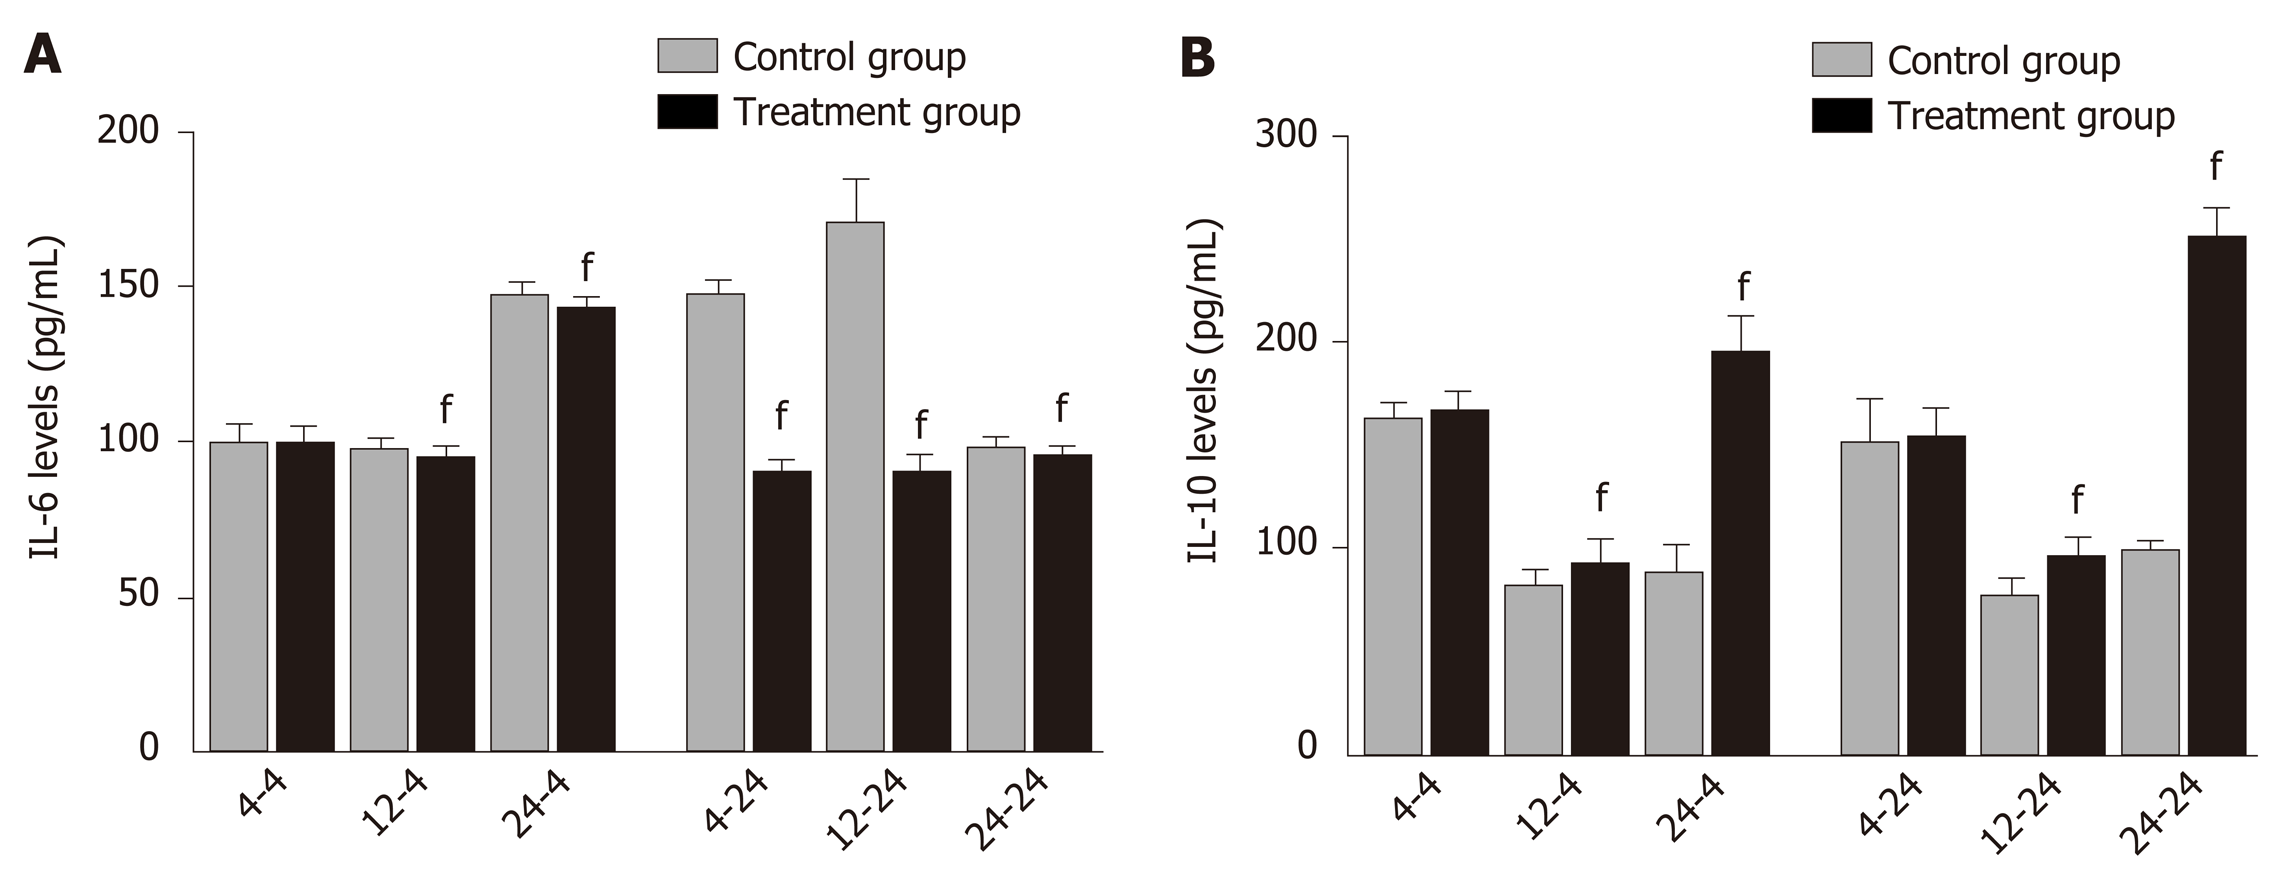
Figure 3 Serum inflammatory cytokine levels in rats.
Rats in each treatment group were orally administered with Dachengqi decoction (DCQD), and rats in each control group were orally administered with normal saline. 4-4, 12-4, and 24-4: Rats were dosed with DCQD at 4 h, 12 h, and 24 h, respectively, after AP induction and were euthanized at 4 h after dosing; 4-24, 12-24, and 24-24: Rats were dosed with DCQD at 4 h, 12 h, and 24 h, respectively, after AP induction and were euthanized at 24 h after dosing. Heart blood samples were collected to detect the inflammatory cytokine levels. The results are presented as the mean ± SD (n = 6). fP < 0.05 vs control group.
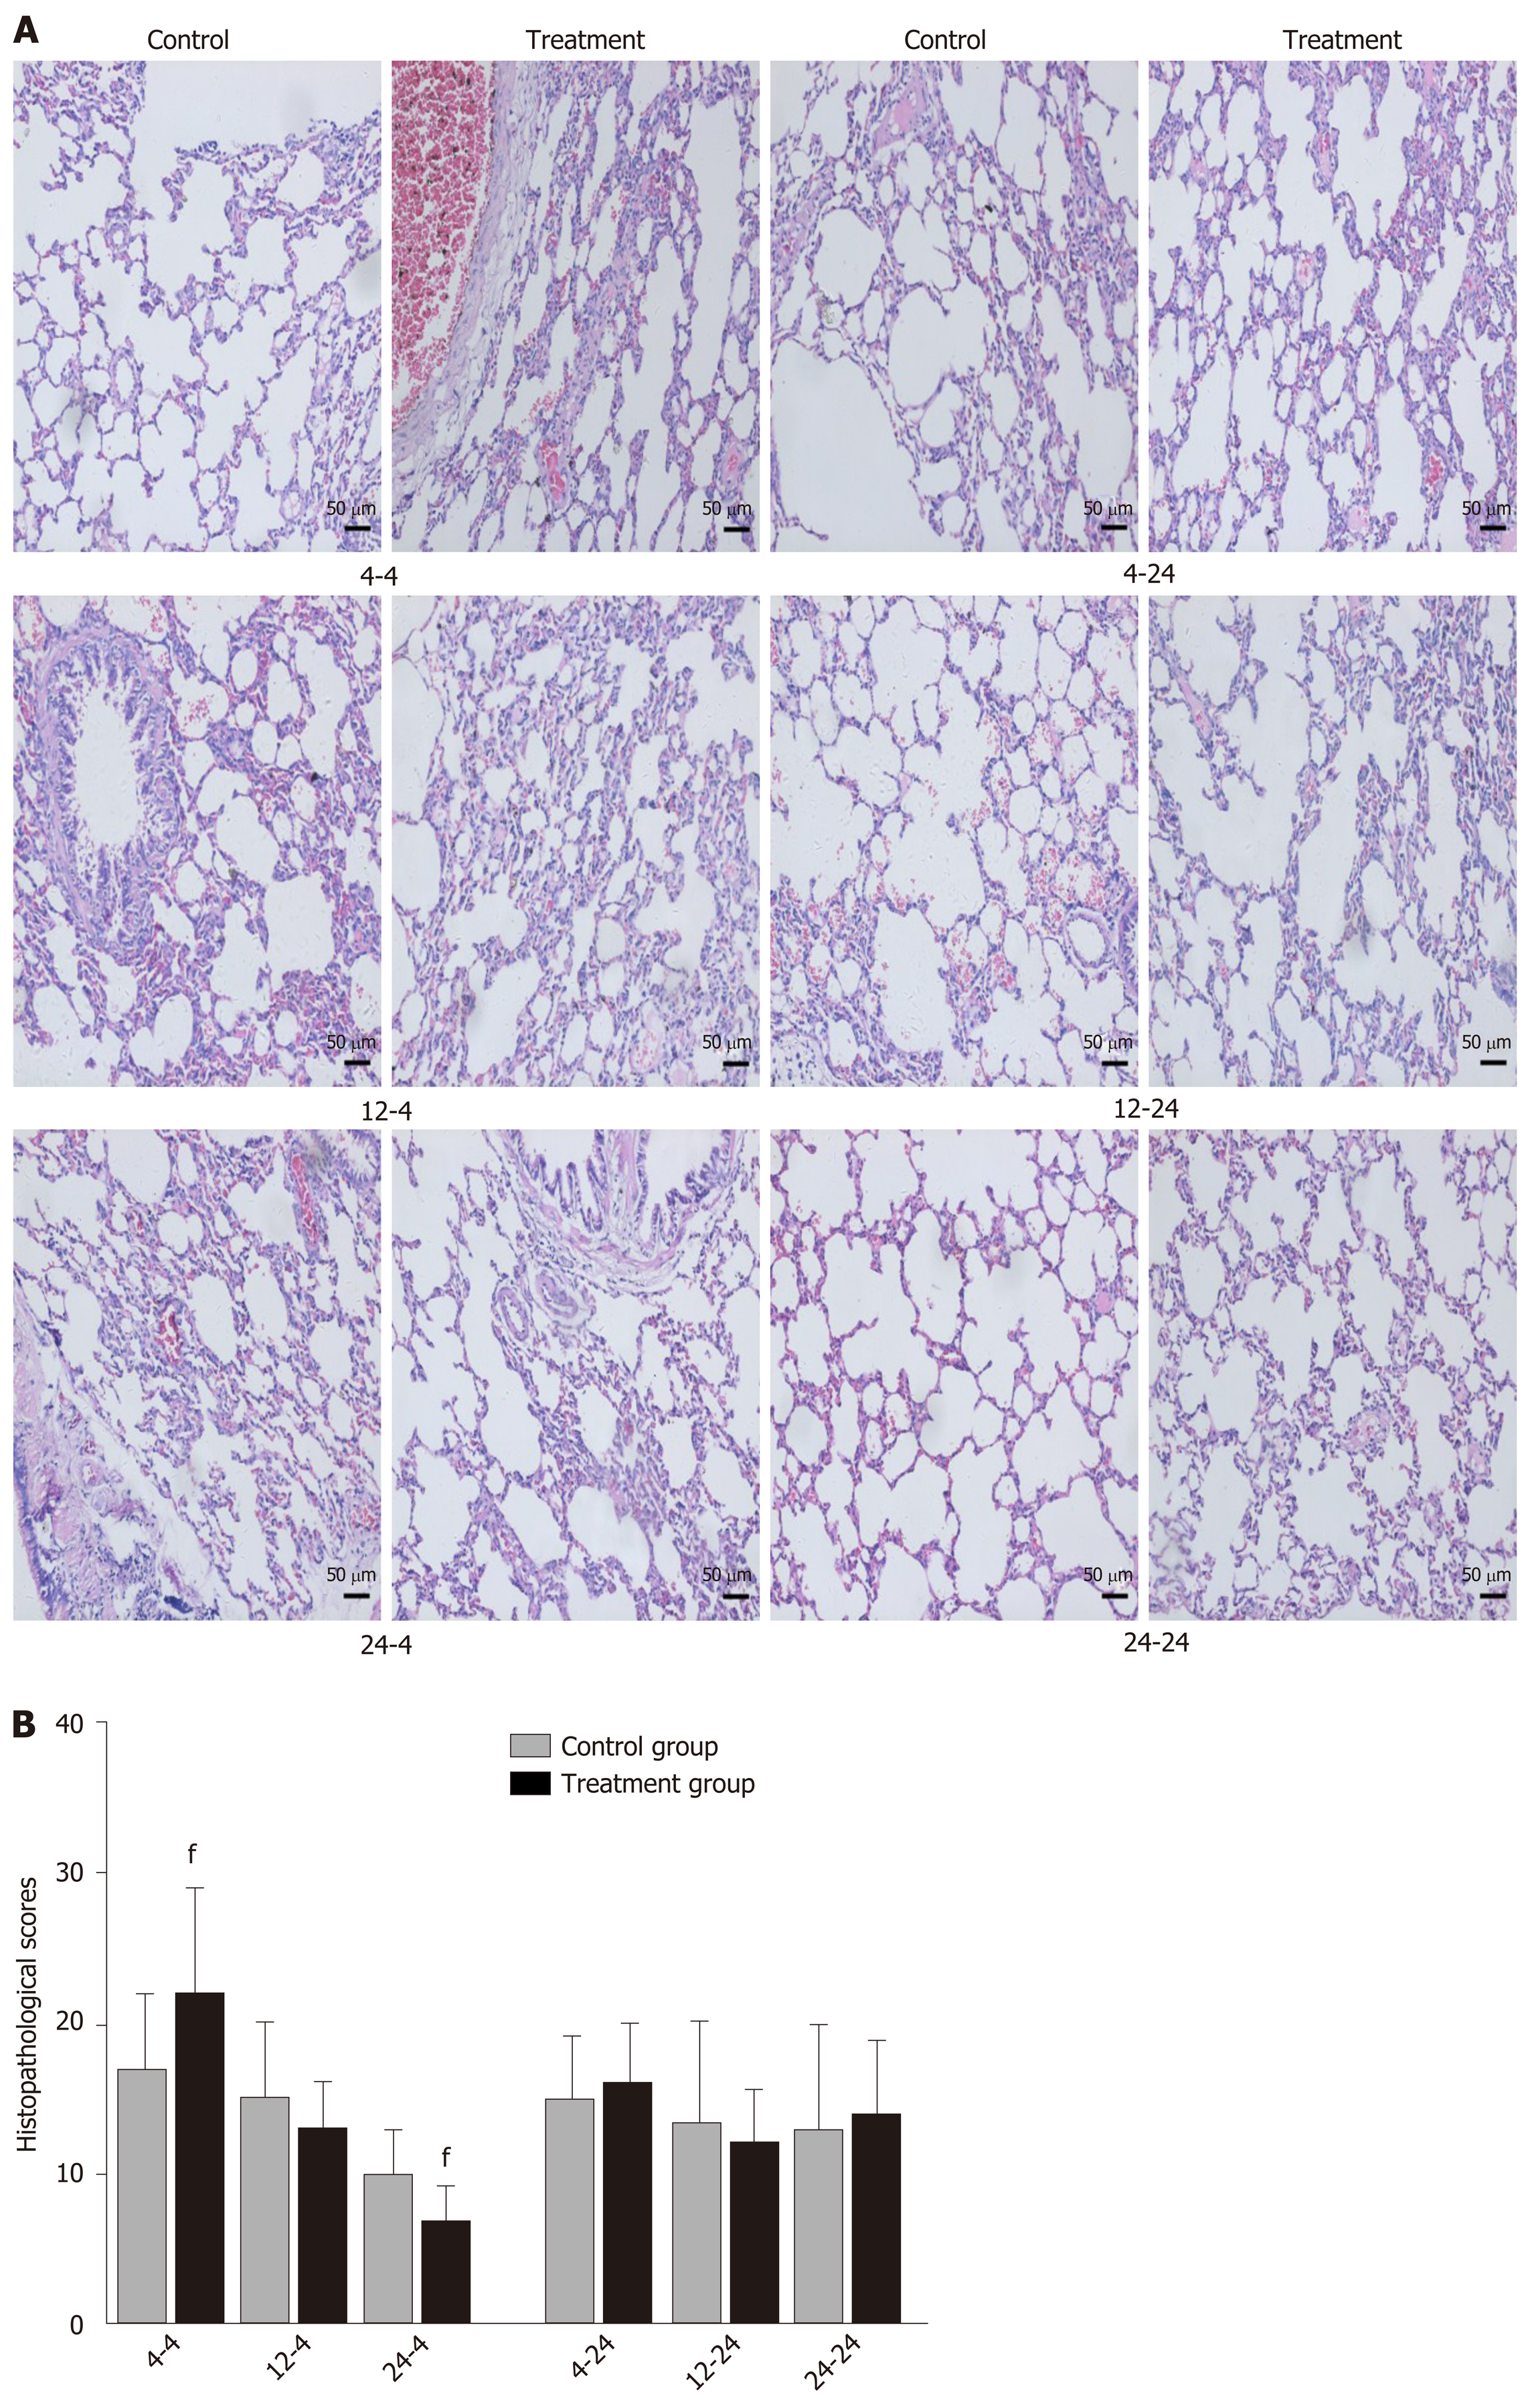
Figure 4 Pathological images and histopathological scores of lung tissues in rats.
Rats in each treatment group were orally administered with Dachengqi decoction (DCQD), and rats in each control group were orally administered with normal saline. 4-4, 12-4, and 24-4: Rats were dosed with DCQD at 4 h, 12 h, and 24 h, respectively, after AP induction and were euthanized at 4 h after dosing. 4-24, 12-24, and 24-24: Rats were dosed with DCQD at 4 h, 12 h, and 24 h, respectively, after AP induction and were euthanized at 24 h after dosing. The lung tissues were collected for pathological examination by hematoxylin and eosin (HE) staining. A: Pathological images of the lung (HE, × 200). B: Histopathological scores of lung injury. Data are presented as the mean ± SD (n = 6). fP < 0.05 vs control group.
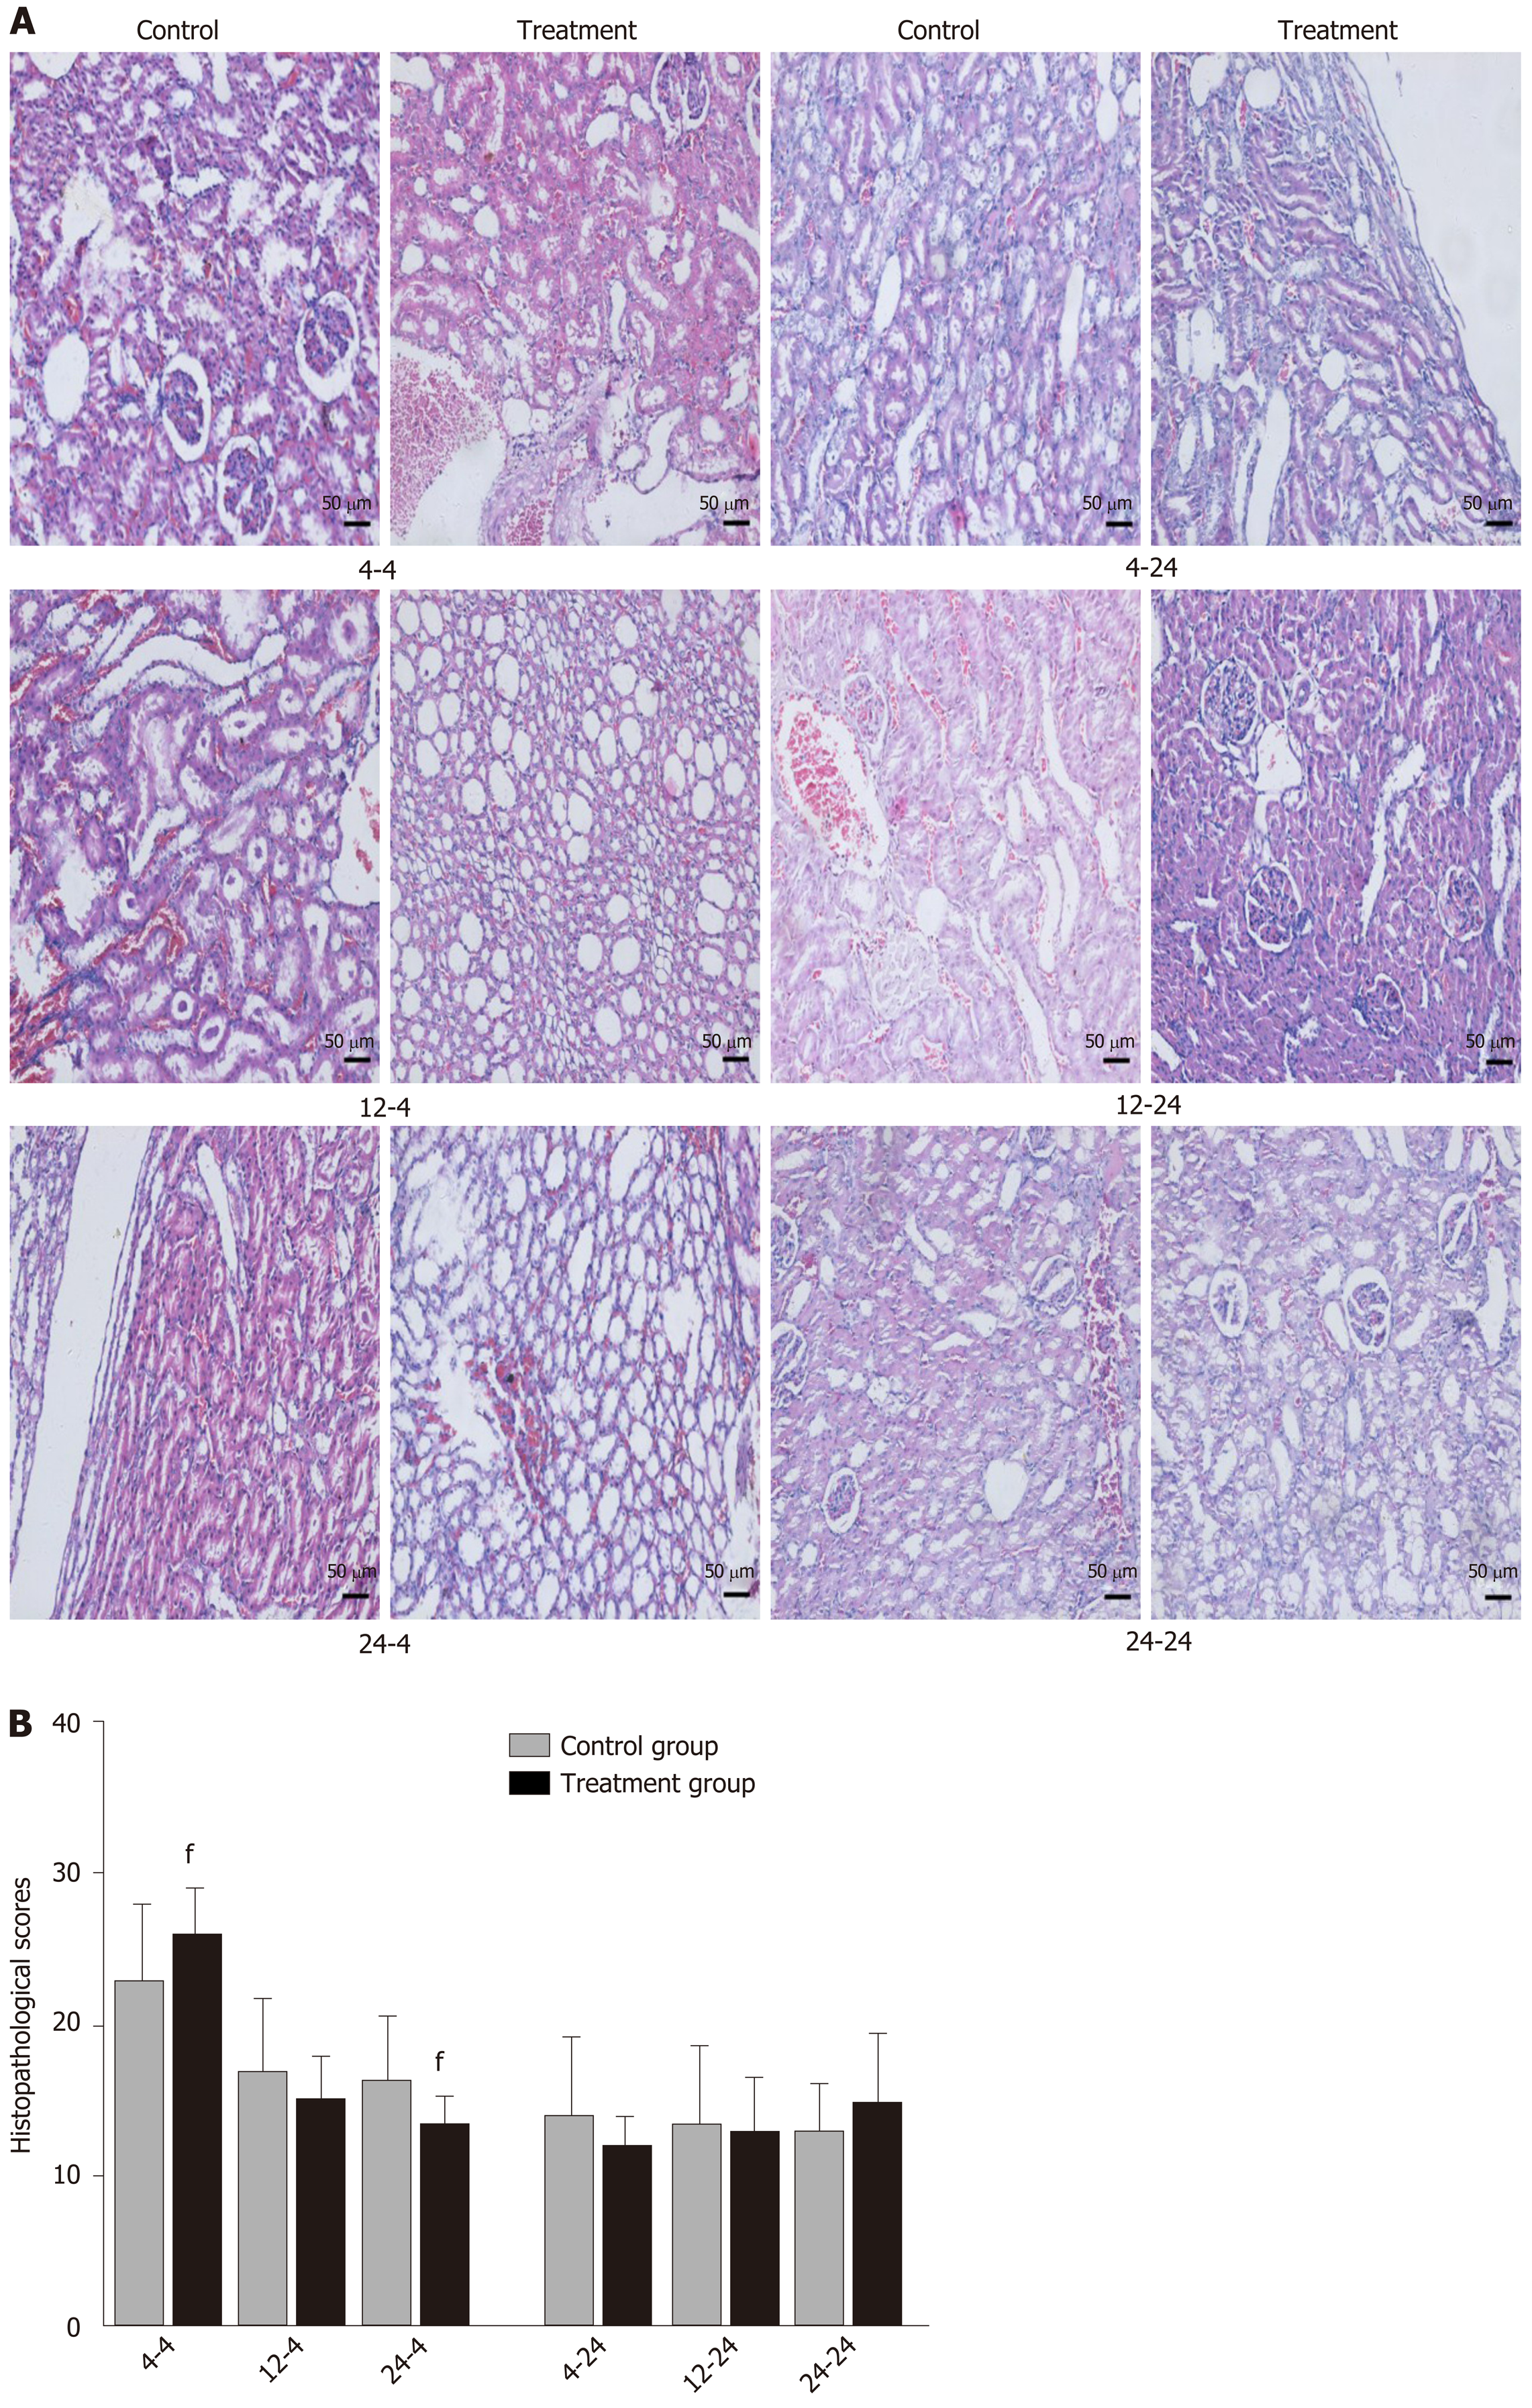
Figure 5 Pathological images and histopathological scores of kidney tissues in rats.
Rats in each treatment group were orally administered with Dachengqi decoction (DCQD), and rats in each control group were orally administered with normal saline. 4-4, 12-4, and 24-4: Rats were dosed with DCQD at 4 h, 12 h, and 24 h, respectively, after AP induction and were euthanized at 4 h after dosing. 4-24, 12-24, and 24-24: Rats were dosed with DCQD at 4 h, 12 h, and 24 h, respectively, after AP induction and were euthanized at 24 h after dosing. The kidney tissues were collected for pathological examination by hematoxylin and eosin (HE) staining. A: Pathological images of the kidney (HE, × 200). B: Histopathological scores of heart injury. Data are presented as the mean ± SD (n = 6). fP < 0.05 vs control group.
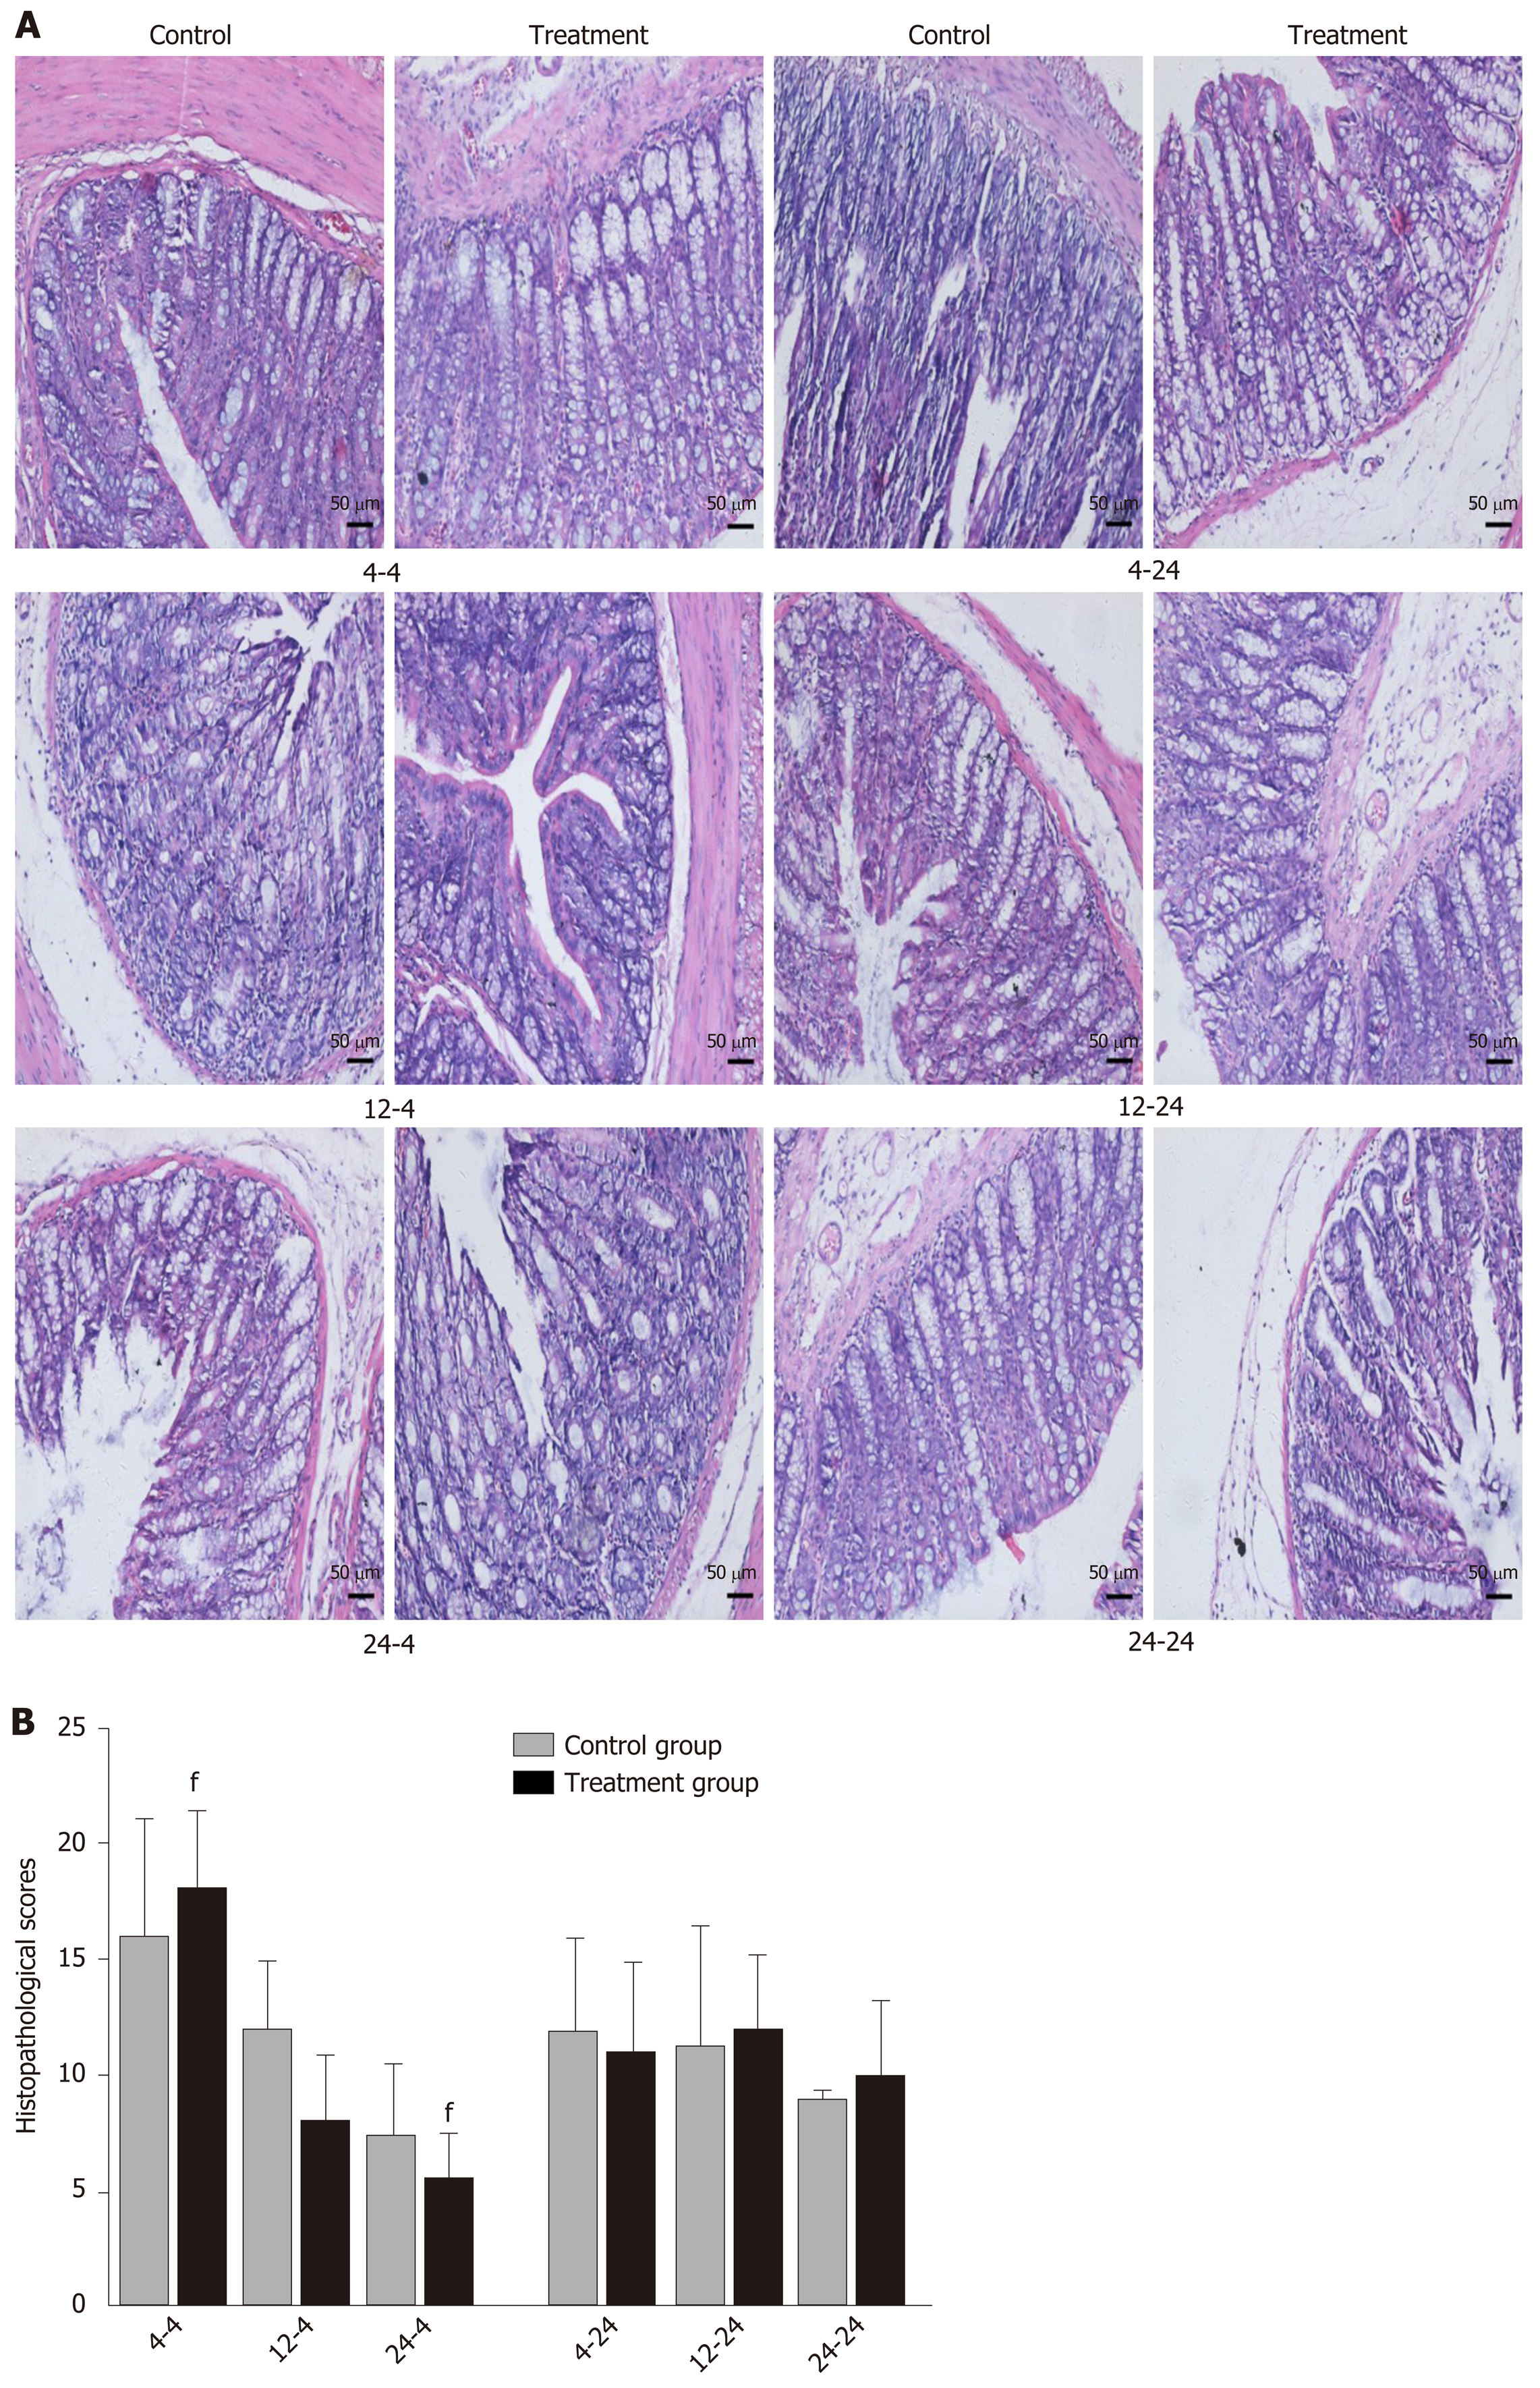
Figure 6 Pathological images and histopathological scores of intestinal tissues in rats.
Rats in each treatment group were orally administered with Dachengqi decoction (DCQD), and rats in each control group were orally administered with normal saline. 4-4, 12-4, and 24-4: Rats were dosed with DCQD at 4 h, 12 h, and 24 h, respectively, after AP induction and were euthanized at 4 h after dosing. 4-24, 12-24, and 24-24: Rats were dosed with DCQD at 4 h, 12 h, and 24 h, respectively, after AP induction and were euthanized at 24 h after dosing. The intestine tissues were collected for pathological examination by hematoxylin and eosin (HE) staining. A: Pathological images of the intestine (HE, × 100). B: Histopathological scores of intestinal injury. Data are presented as the mean ± SD (n = 6). fP < 0.05 vs control group.
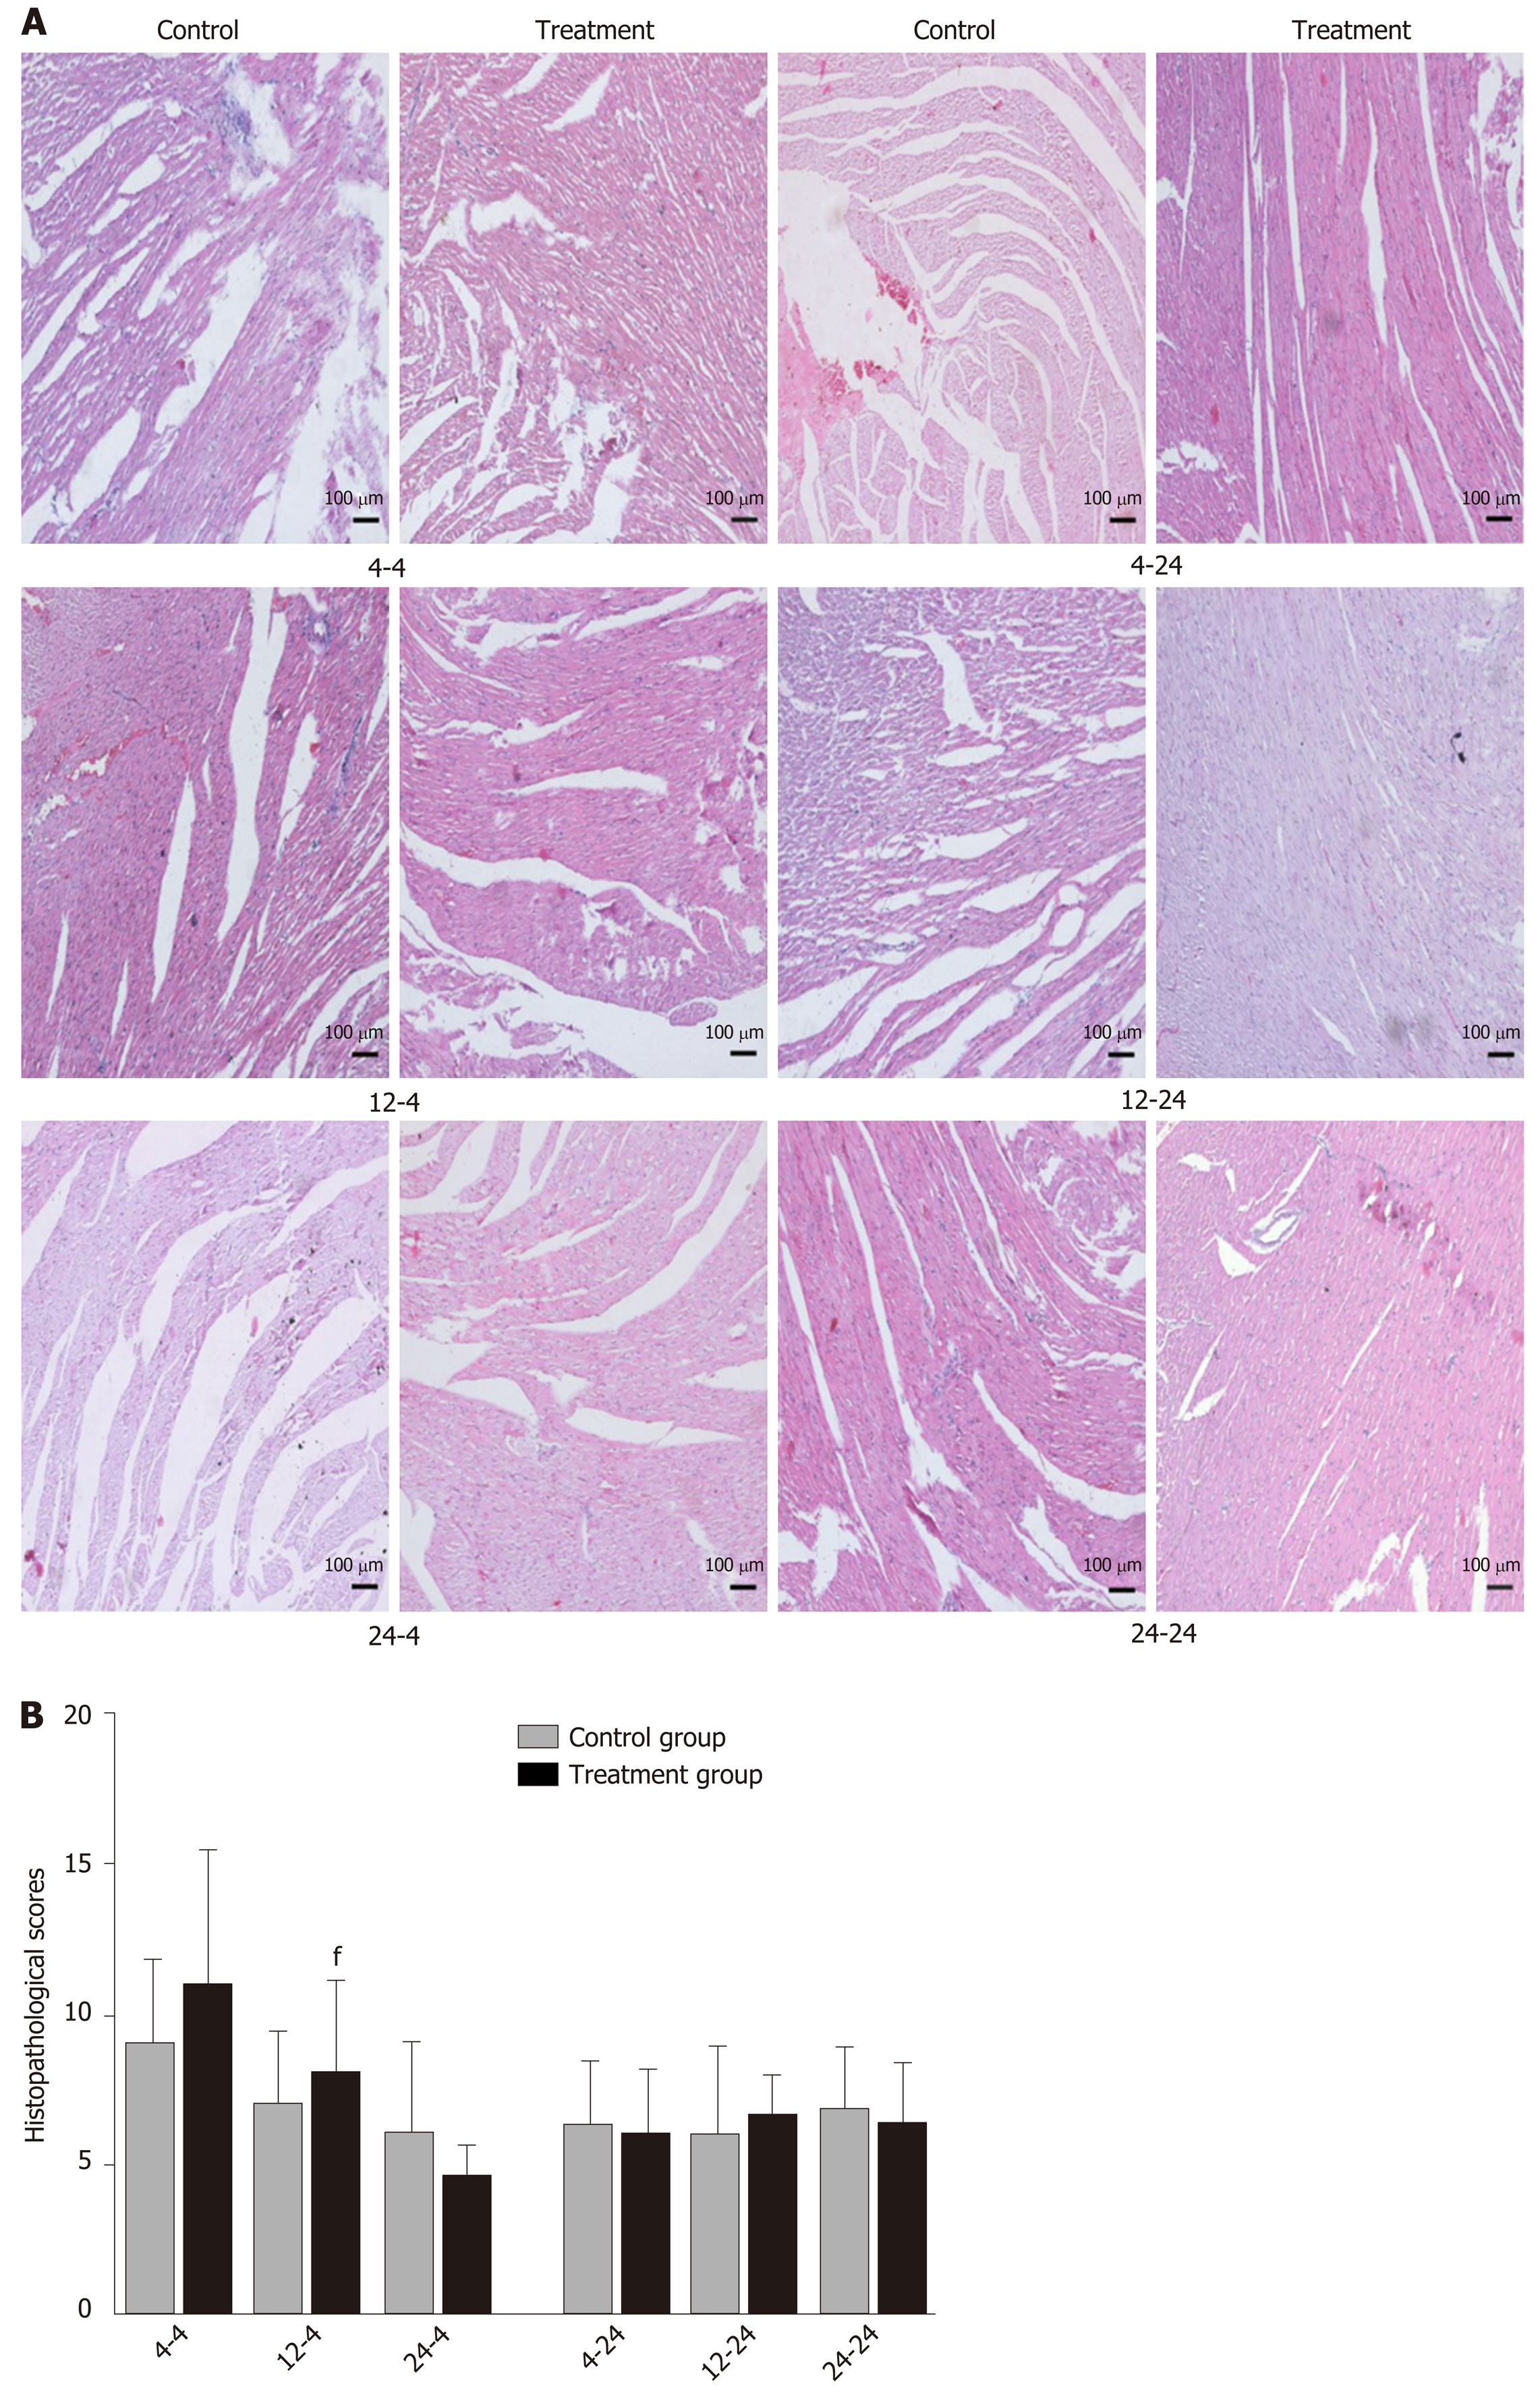
Figure 7 Pathological images and histopathological scores of heart tissues in rats.
Rats in each treatment group were orally administered with Dachengqi decoction (DCQD), and rats in each control group were orally administered with normal saline. 4-4, 12-4, and 24-4: Rats were dosed with DCQD at 4 h, 12 h, and 24 h, respectively, after AP induction and were euthanized at 4 h after dosing. 4-24, 12-24, and 24-24: Rats were dosed with DCQD at 4 h, 12 h, and 24 h, respectively, after AP induction and were euthanized at 24 h after dosing. The heart tissues were collected for pathological examination by hematoxylin and eosin (HE) staining. A: Pathological images of the heart (HE, × 100). B: Histopathological scores of heart injury. Data are presented as the mean ± SD (n = 6). fP < 0.05 vs control group.
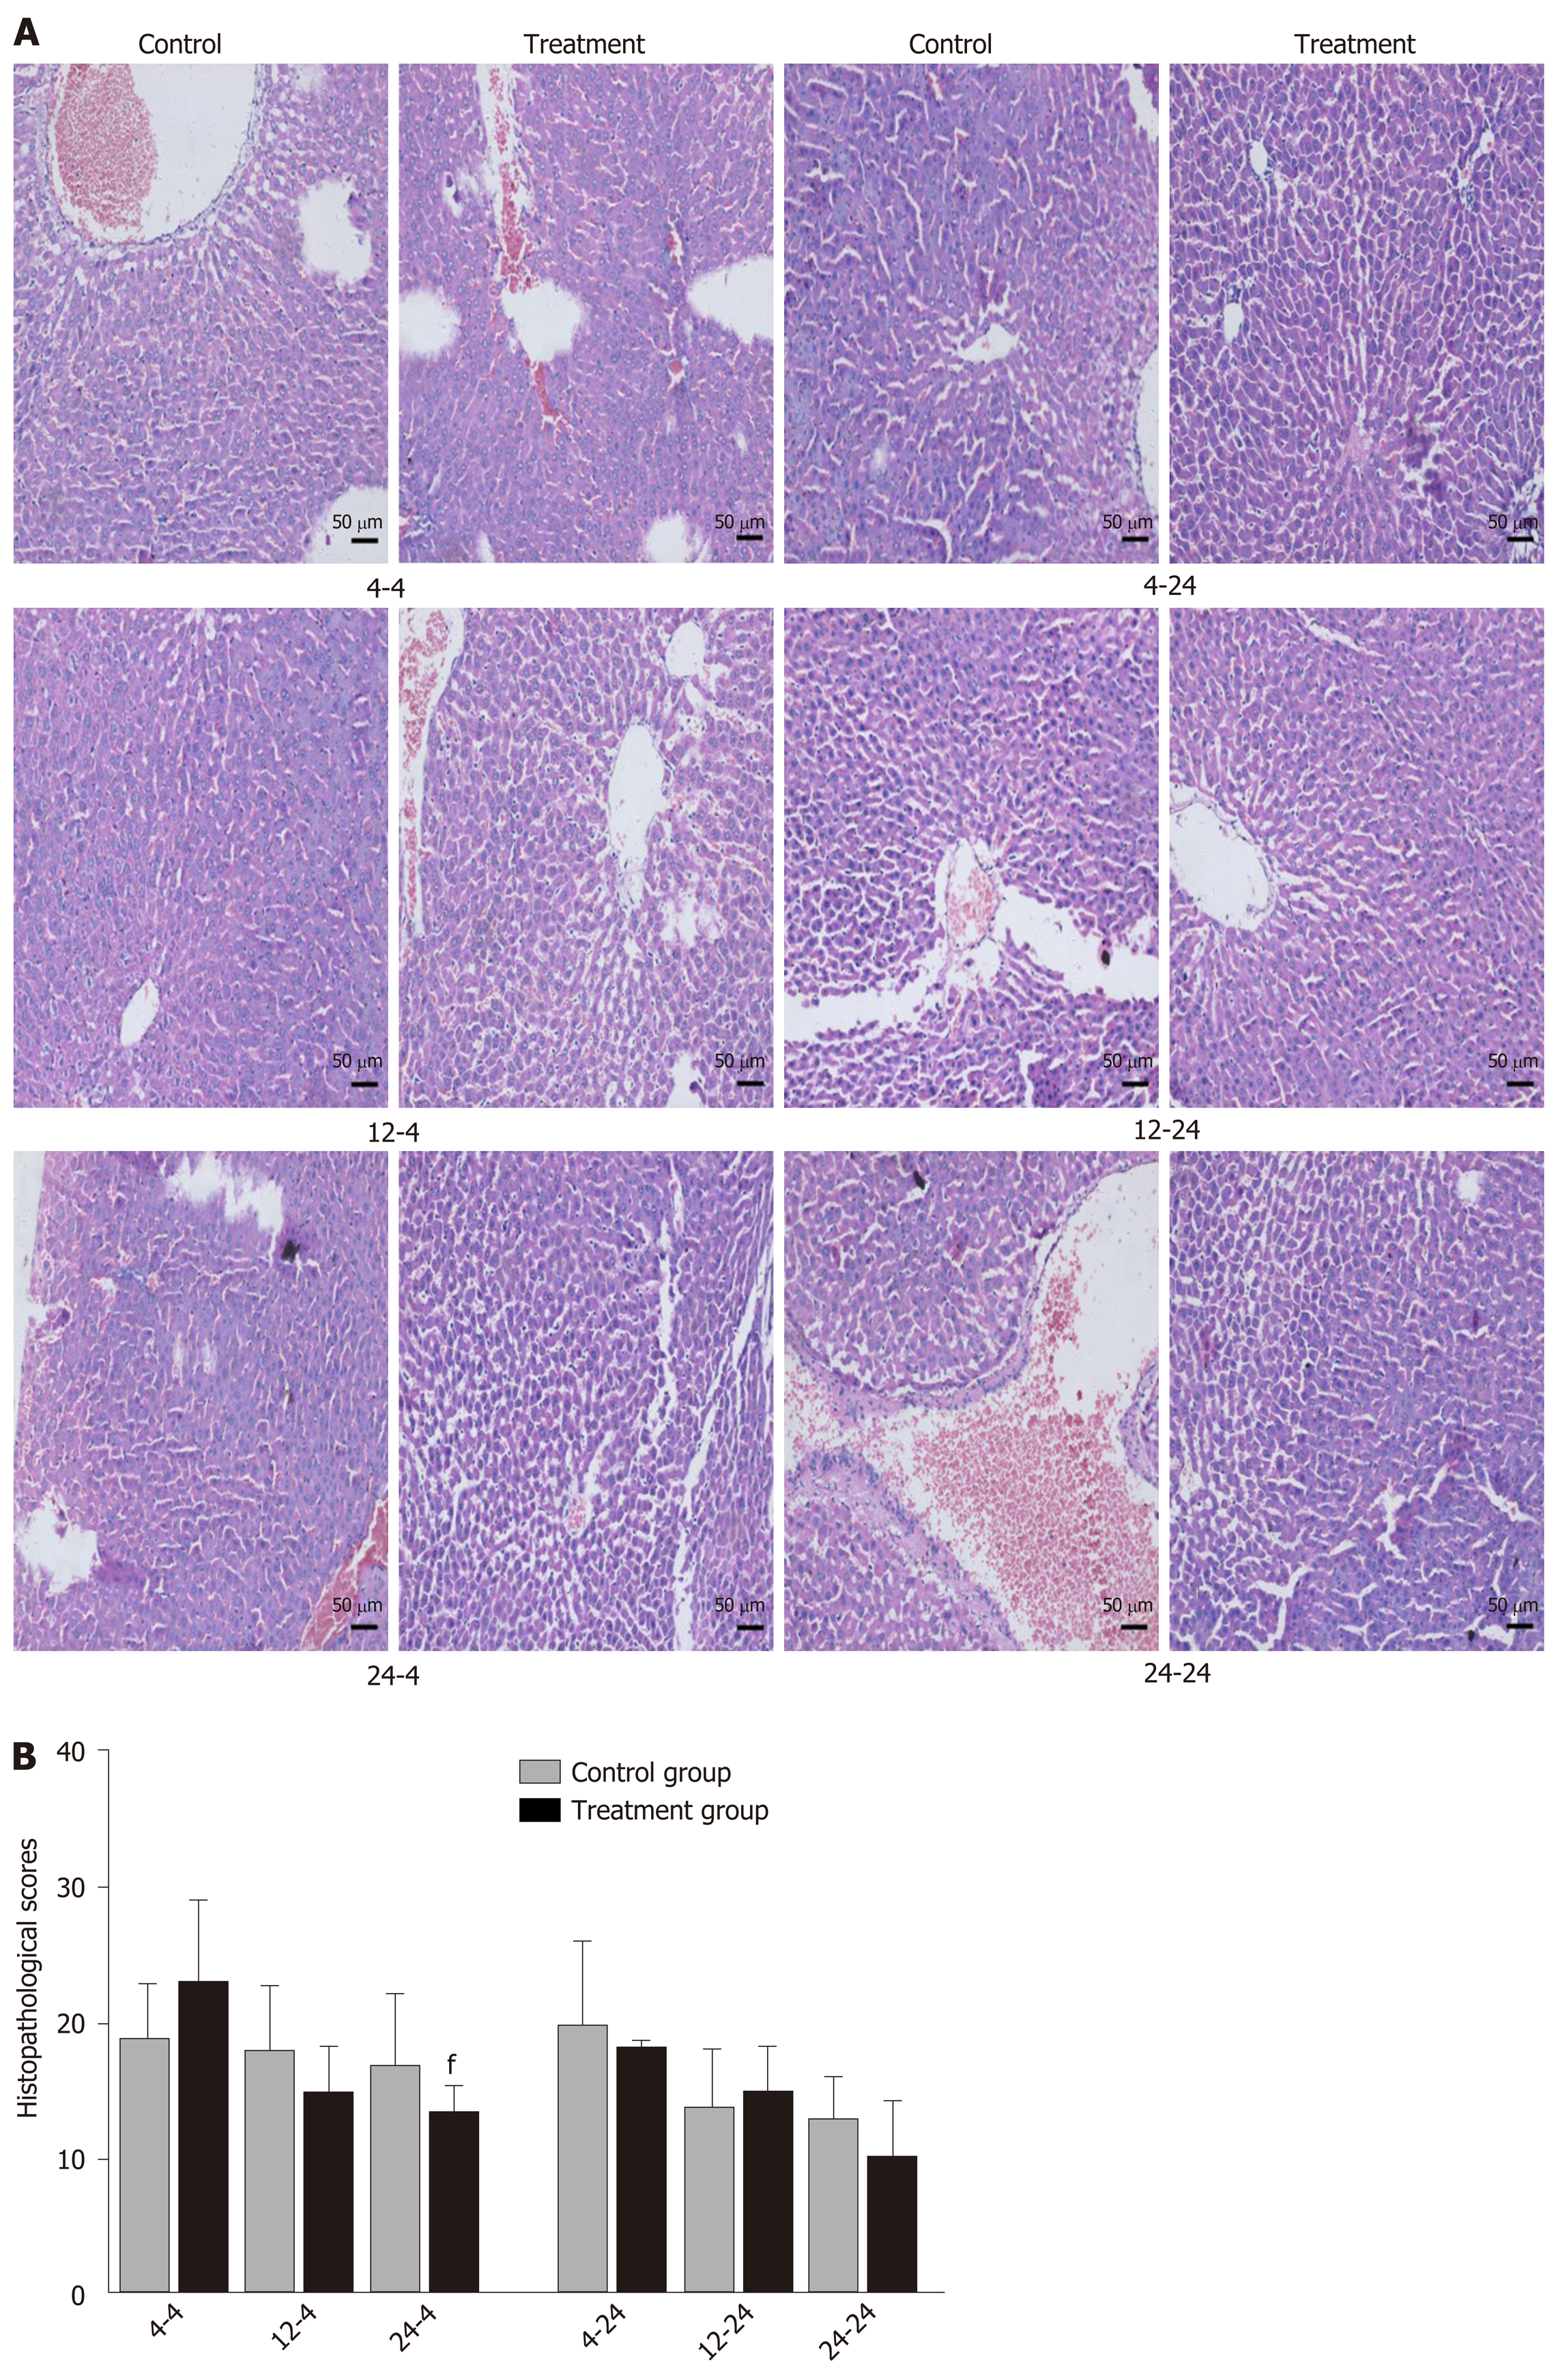
Figure 8 Pathological images and histopathological scores of liver tissues in rats.
Rats in each treatment group were orally administered with Dachengqi decoction (DCQD), and rats in each control group were orally administered with normal saline. 4-4, 12-4, and 24-4: Rats were dosed with DCQD at 4 h, 12 h, and 24 h, respectively, after AP induction and were euthanized at 4 h after dosing. 4-24, 12-24, and 24-24: Rats were dosed with DCQD at 4 h, 12 h, and 24 h, respectively, after AP induction and were euthanized at 24 h after dosing. The liver tissues were collected for pathological examination by hematoxylin and eosin (HE) staining. A: Pathological images of the liver (HE, × 200). B: Histopathological scores of liver injury. Data are presented as the mean ± SD (n = 6). fP < 0.05 vs control group.
- Citation: Yao JQ, Zhu L, Miao YF, Zhu L, Chen H, Yuan L, Hu J, Yi XL, Wu QT, Yang XJ, Wan MH, Tang WF. Optimal dosing time of Dachengqi decoction for protection of extrapancreatic organs in rats with experimental acute pancreatitis. World J Gastroenterol 2020; 26(22): 3056-3075
- URL: https://www.wjgnet.com/1007-9327/full/v26/i22/3056.htm
- DOI: https://dx.doi.org/10.3748/wjg.v26.i22.3056


