Copyright
©The Author(s) 2020.
World J Gastroenterol. Jan 14, 2020; 26(2): 184-198
Published online Jan 14, 2020. doi: 10.3748/wjg.v26.i2.184
Published online Jan 14, 2020. doi: 10.3748/wjg.v26.i2.184
Figure 1 Demethylation and expression status of the GFRA1 gene in human cancer cell lines.
A: Chromatograms of methylated and demethylated GFRA1 (mGFRA1 and dmGFRA1) PCR products for 20 cell lines using denaturing high performance liquid chromatography. Blood DNA with and without M.sssI methylation was used as mGFRA1 and dmGFRA1 controls, respectively; B: The results of bisulfate sequencing for four representative cell lines containing only dmGFRA1 alleles or mGFRA1 alleles. Each line represents one clone; each red dot represents one methylated CpG site. The GFRA1 amplicon containing 42 CpG sites is also displayed at the top; C: Comparison of relative GFRA1 mRNA levels in 20 cell lines with different demethylation statuses; D: Dot chart for correlation between the levels of dmGFRA1 and GFRA1 mRNA in these cell lines.
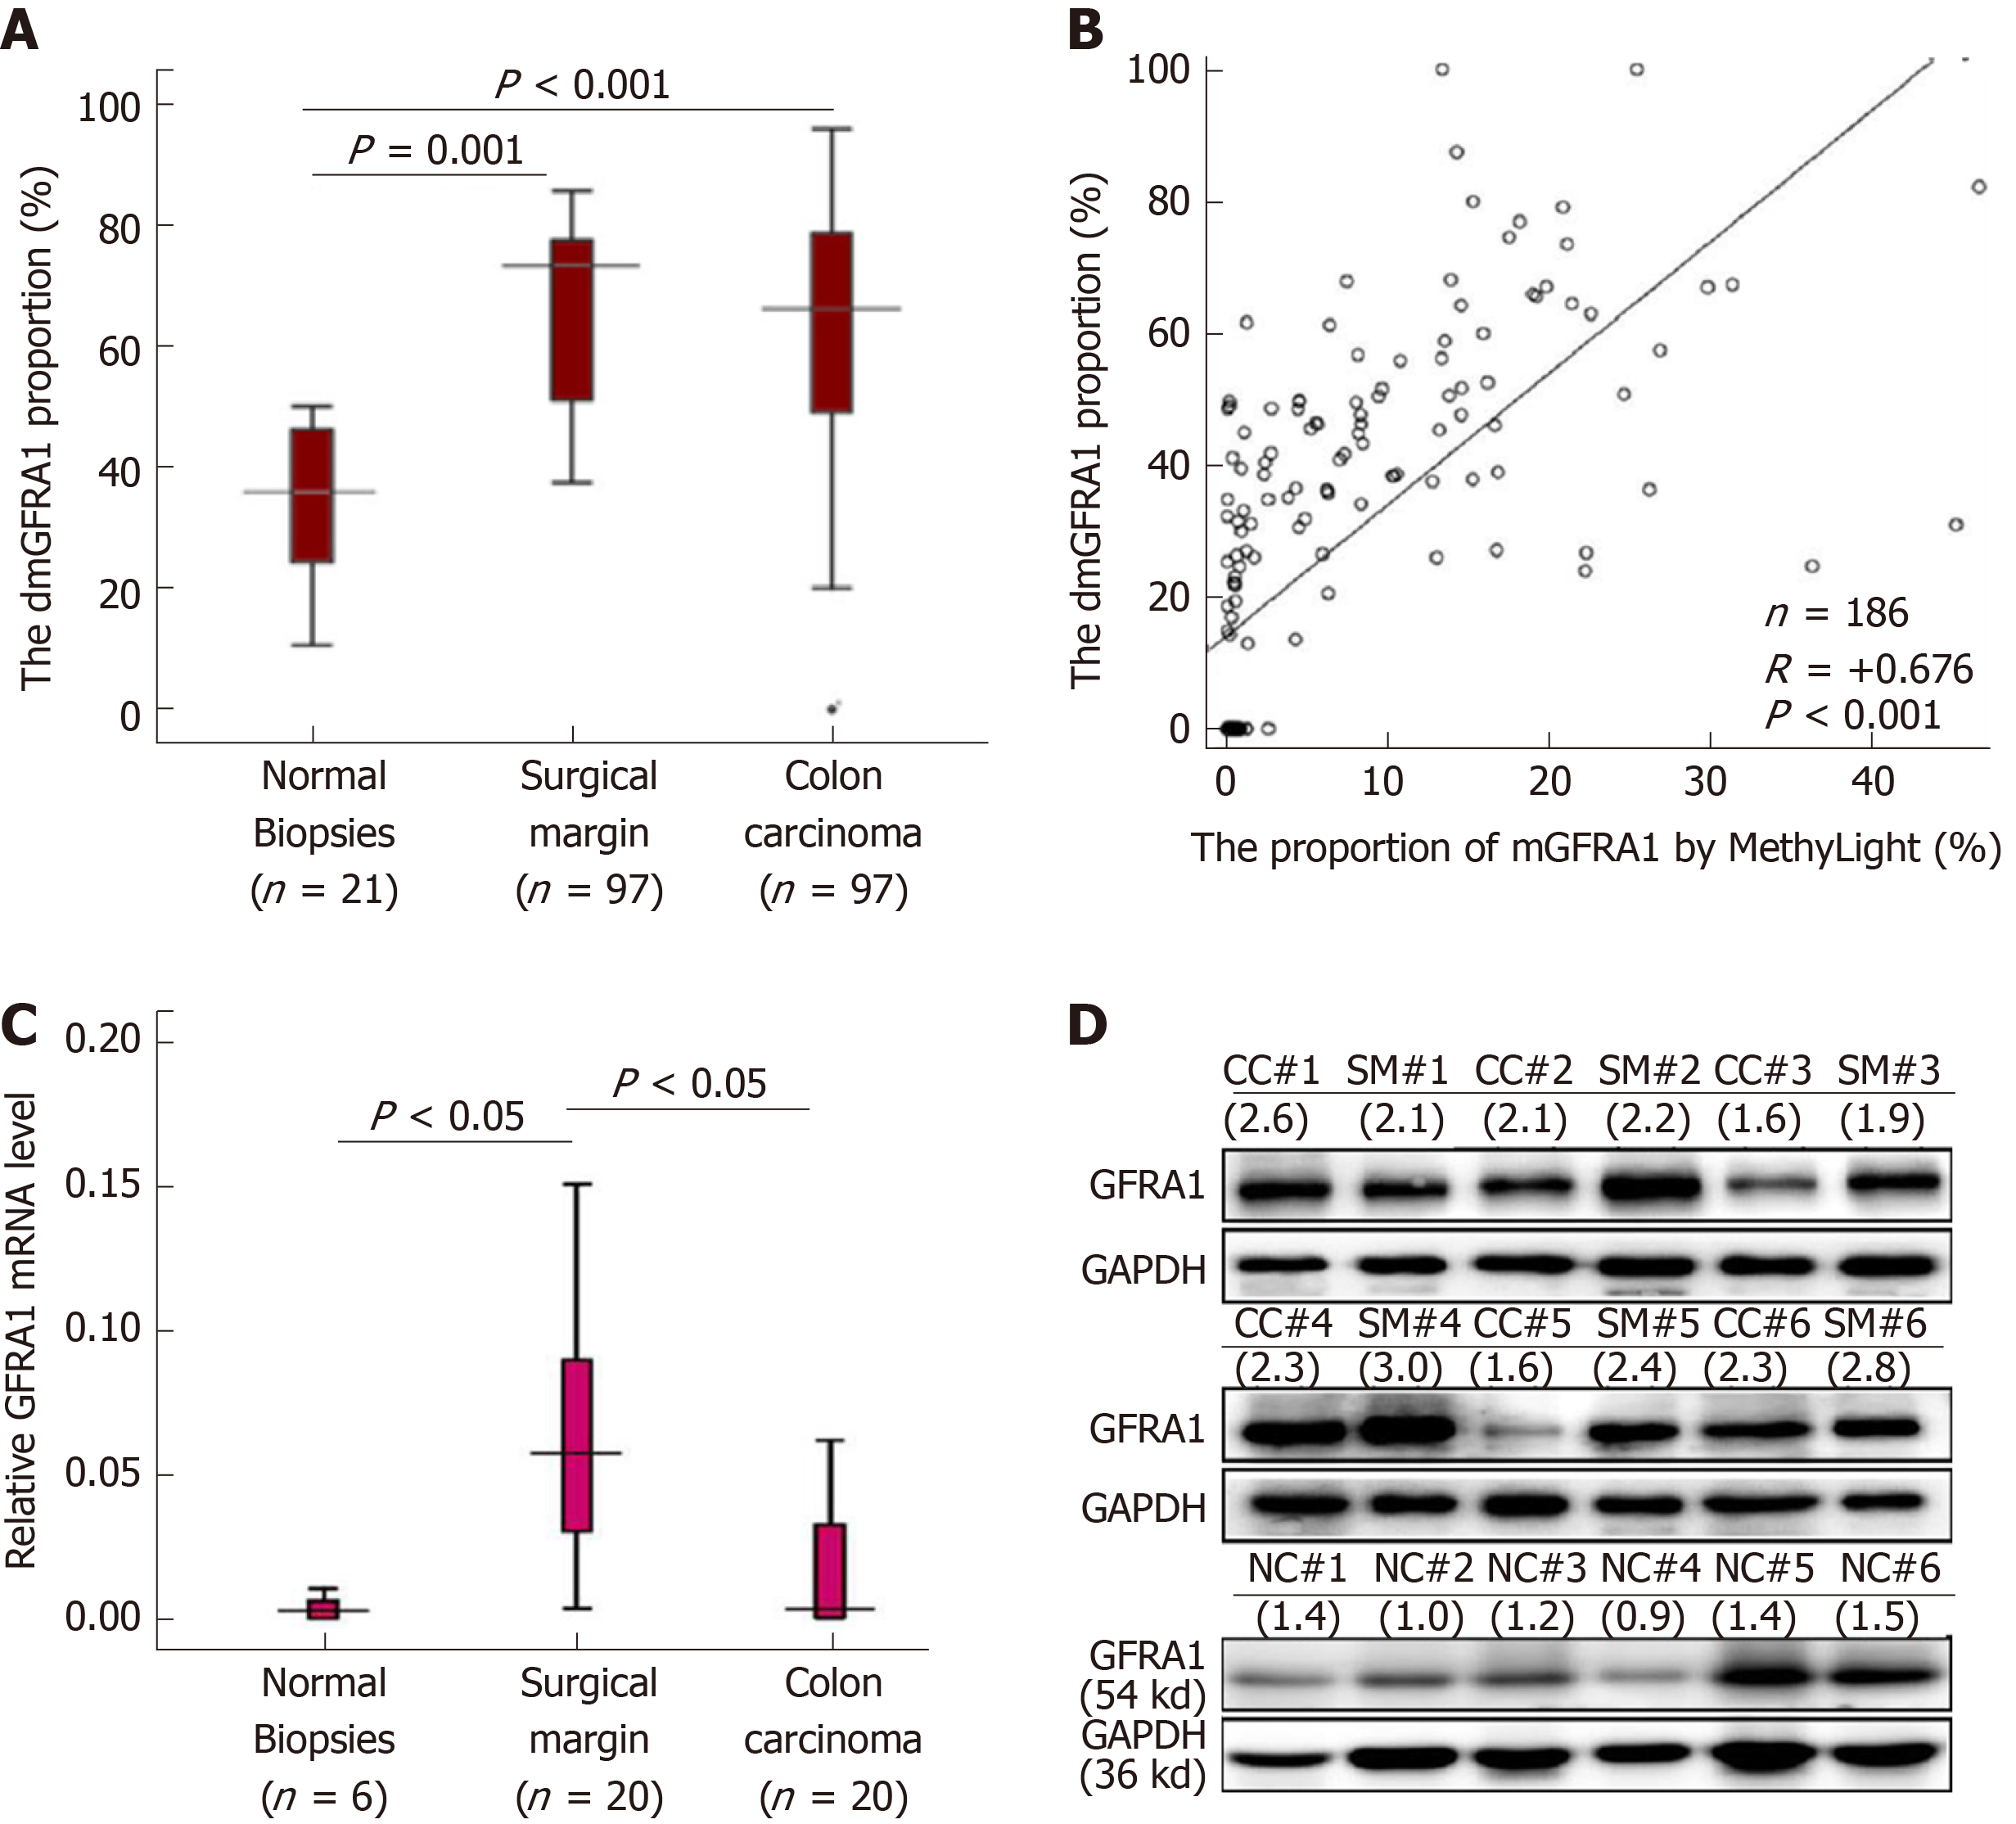
Figure 2 Demethylation and expression status of the GFRA1 gene in colon carcinoma.
A: The demethylated GFRA1 (dmGFRA1) peak area proportions in normal colon mucosal biopsies from noncancer patients (n = 21) as well as CC and SM samples from inpatients (n = 97) based on MethyLight analysis; B: Correlation analysis of the methylated GFRA1 (mGFRA1) levels in colon cancer and paired surgical margin tissue samples from 93 patients by denaturing high performance liquid chromatography and MethyLight; C: GFRA1 mRNA levels in representative colon tissue samples with different pathological lesions by qRT-PCR analysis; D: GFRA1 protein levels in the representative colon tissue samples with different pathological lesions based on Western blot analysis. The density ratio of GFRA1 to GAPDH is listed below each sample id. Note: The mGFRA1 peak area proportion (%) = 100%-the dmGFRA1 peak area proportion (%). dmGFRA1: Demethylated GFRA1; mGFRA1: Methylated GFRA1.
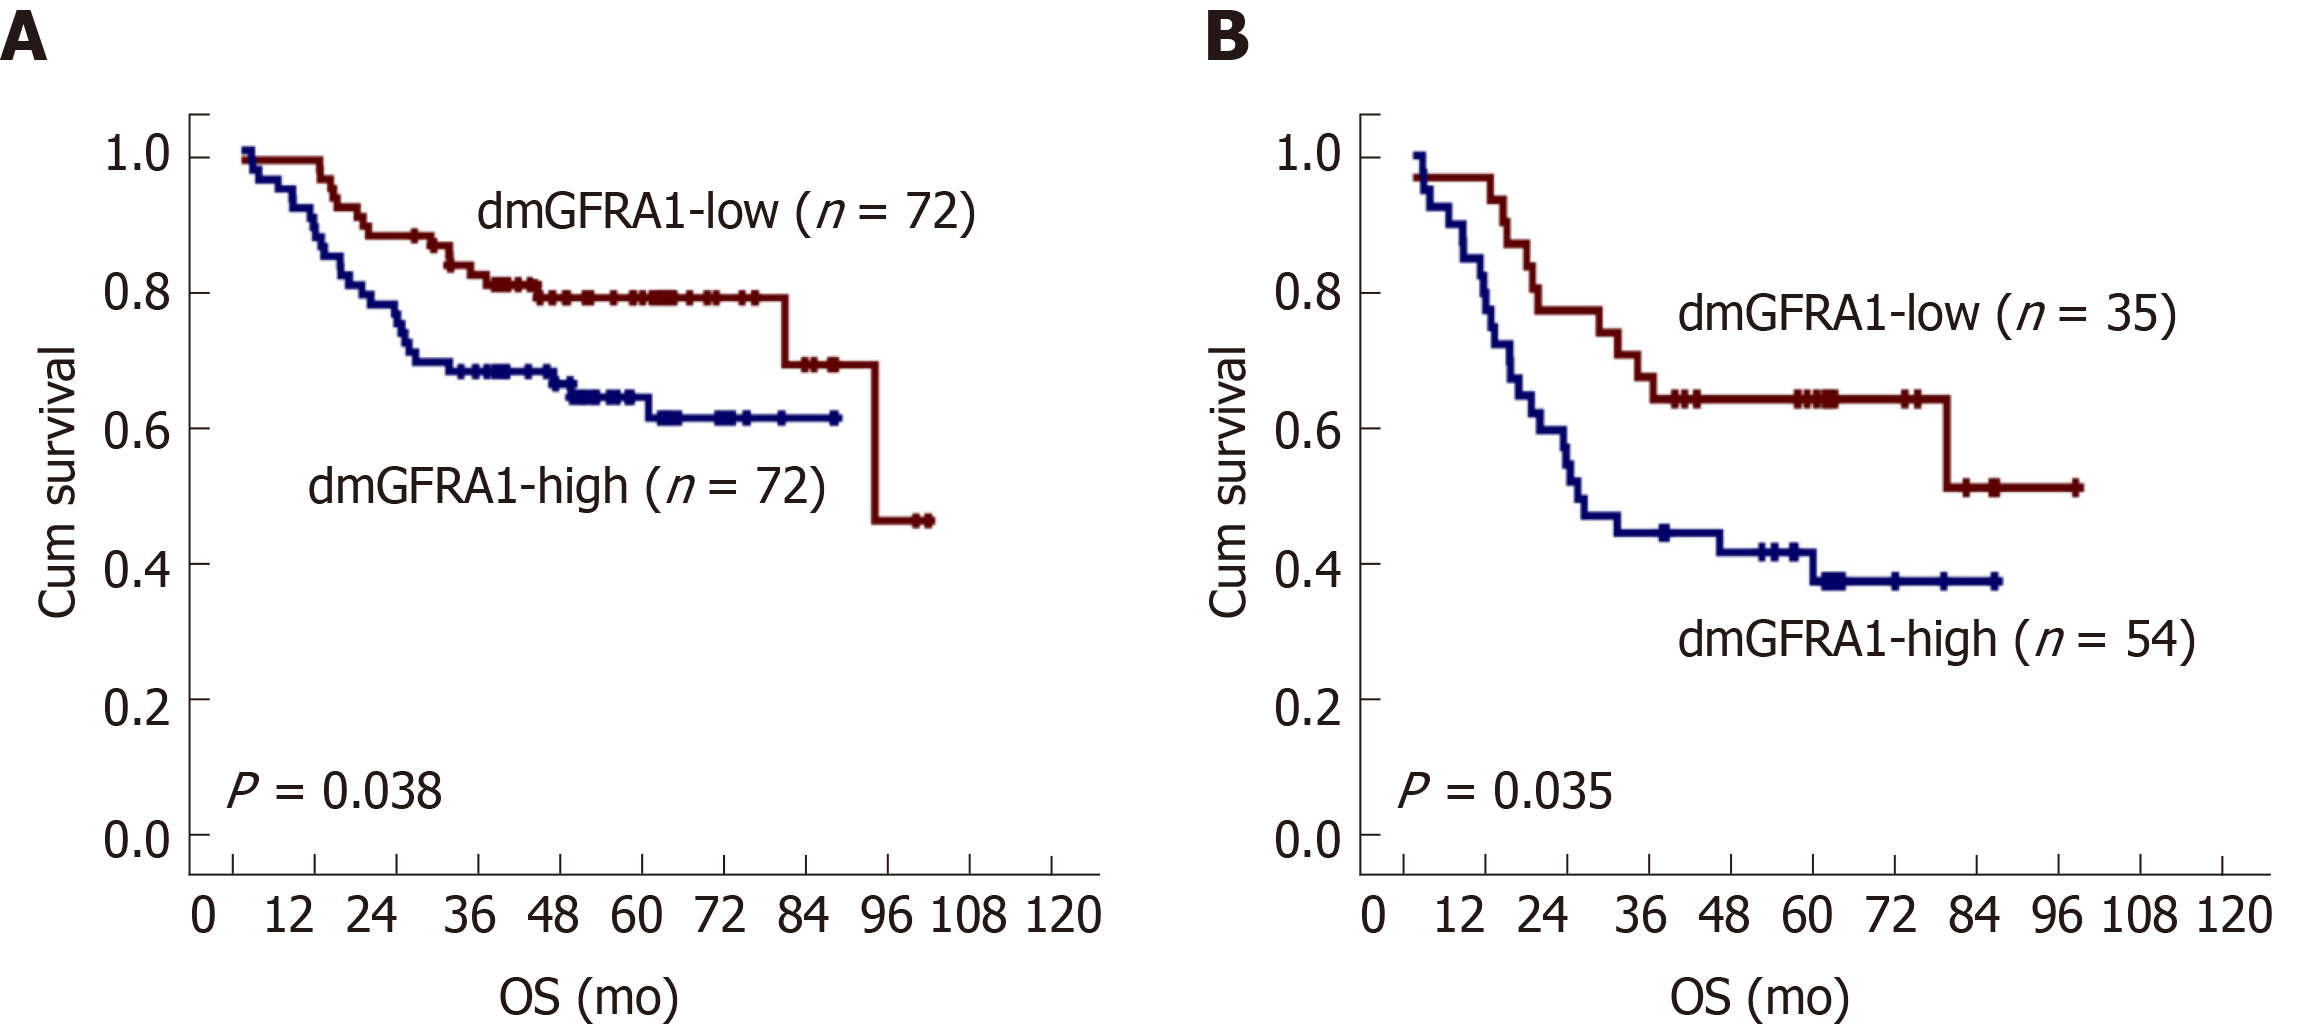
Figure 3 Kaplan-Meier overall survival curves for patient groups with demethylated GFRA1-high and demethylated GFRA1-low colon cancer.
A: For 144 patients; B: For 89 patients with local or distant metastasis. The median GFRA1 demethylation value by MethyLight was used as the cutoff to define demethylated GFRA1 (dmGFRA1)-high and dmGFRA1-low samples. The P value in the log-rank test is also labeled. dmGFRA1: Demethylated GFRA1.
Figure 4 GFRA1b overexpression promotes the proliferation of colon cancer cells in vitro.
A: GFRA1 expression status in RKO and HCT116 cells transfected with the pLenti-empty control vector or pLenti-GFRA1b vector, determined by Western blot; B: Proliferation curves for RKO and HCT116 cells, determined using the IncuCyte systems; C: Migration curves for RKO and HCT116, determined using the IncuCyte systems. Error bars represent S.D.; bP < 0.01; D: Invasion curves for RKO and HCT116, determined using the IncuCyte systems. Error bars represent S.D.; aP < 0.05. Ctrl: Control.
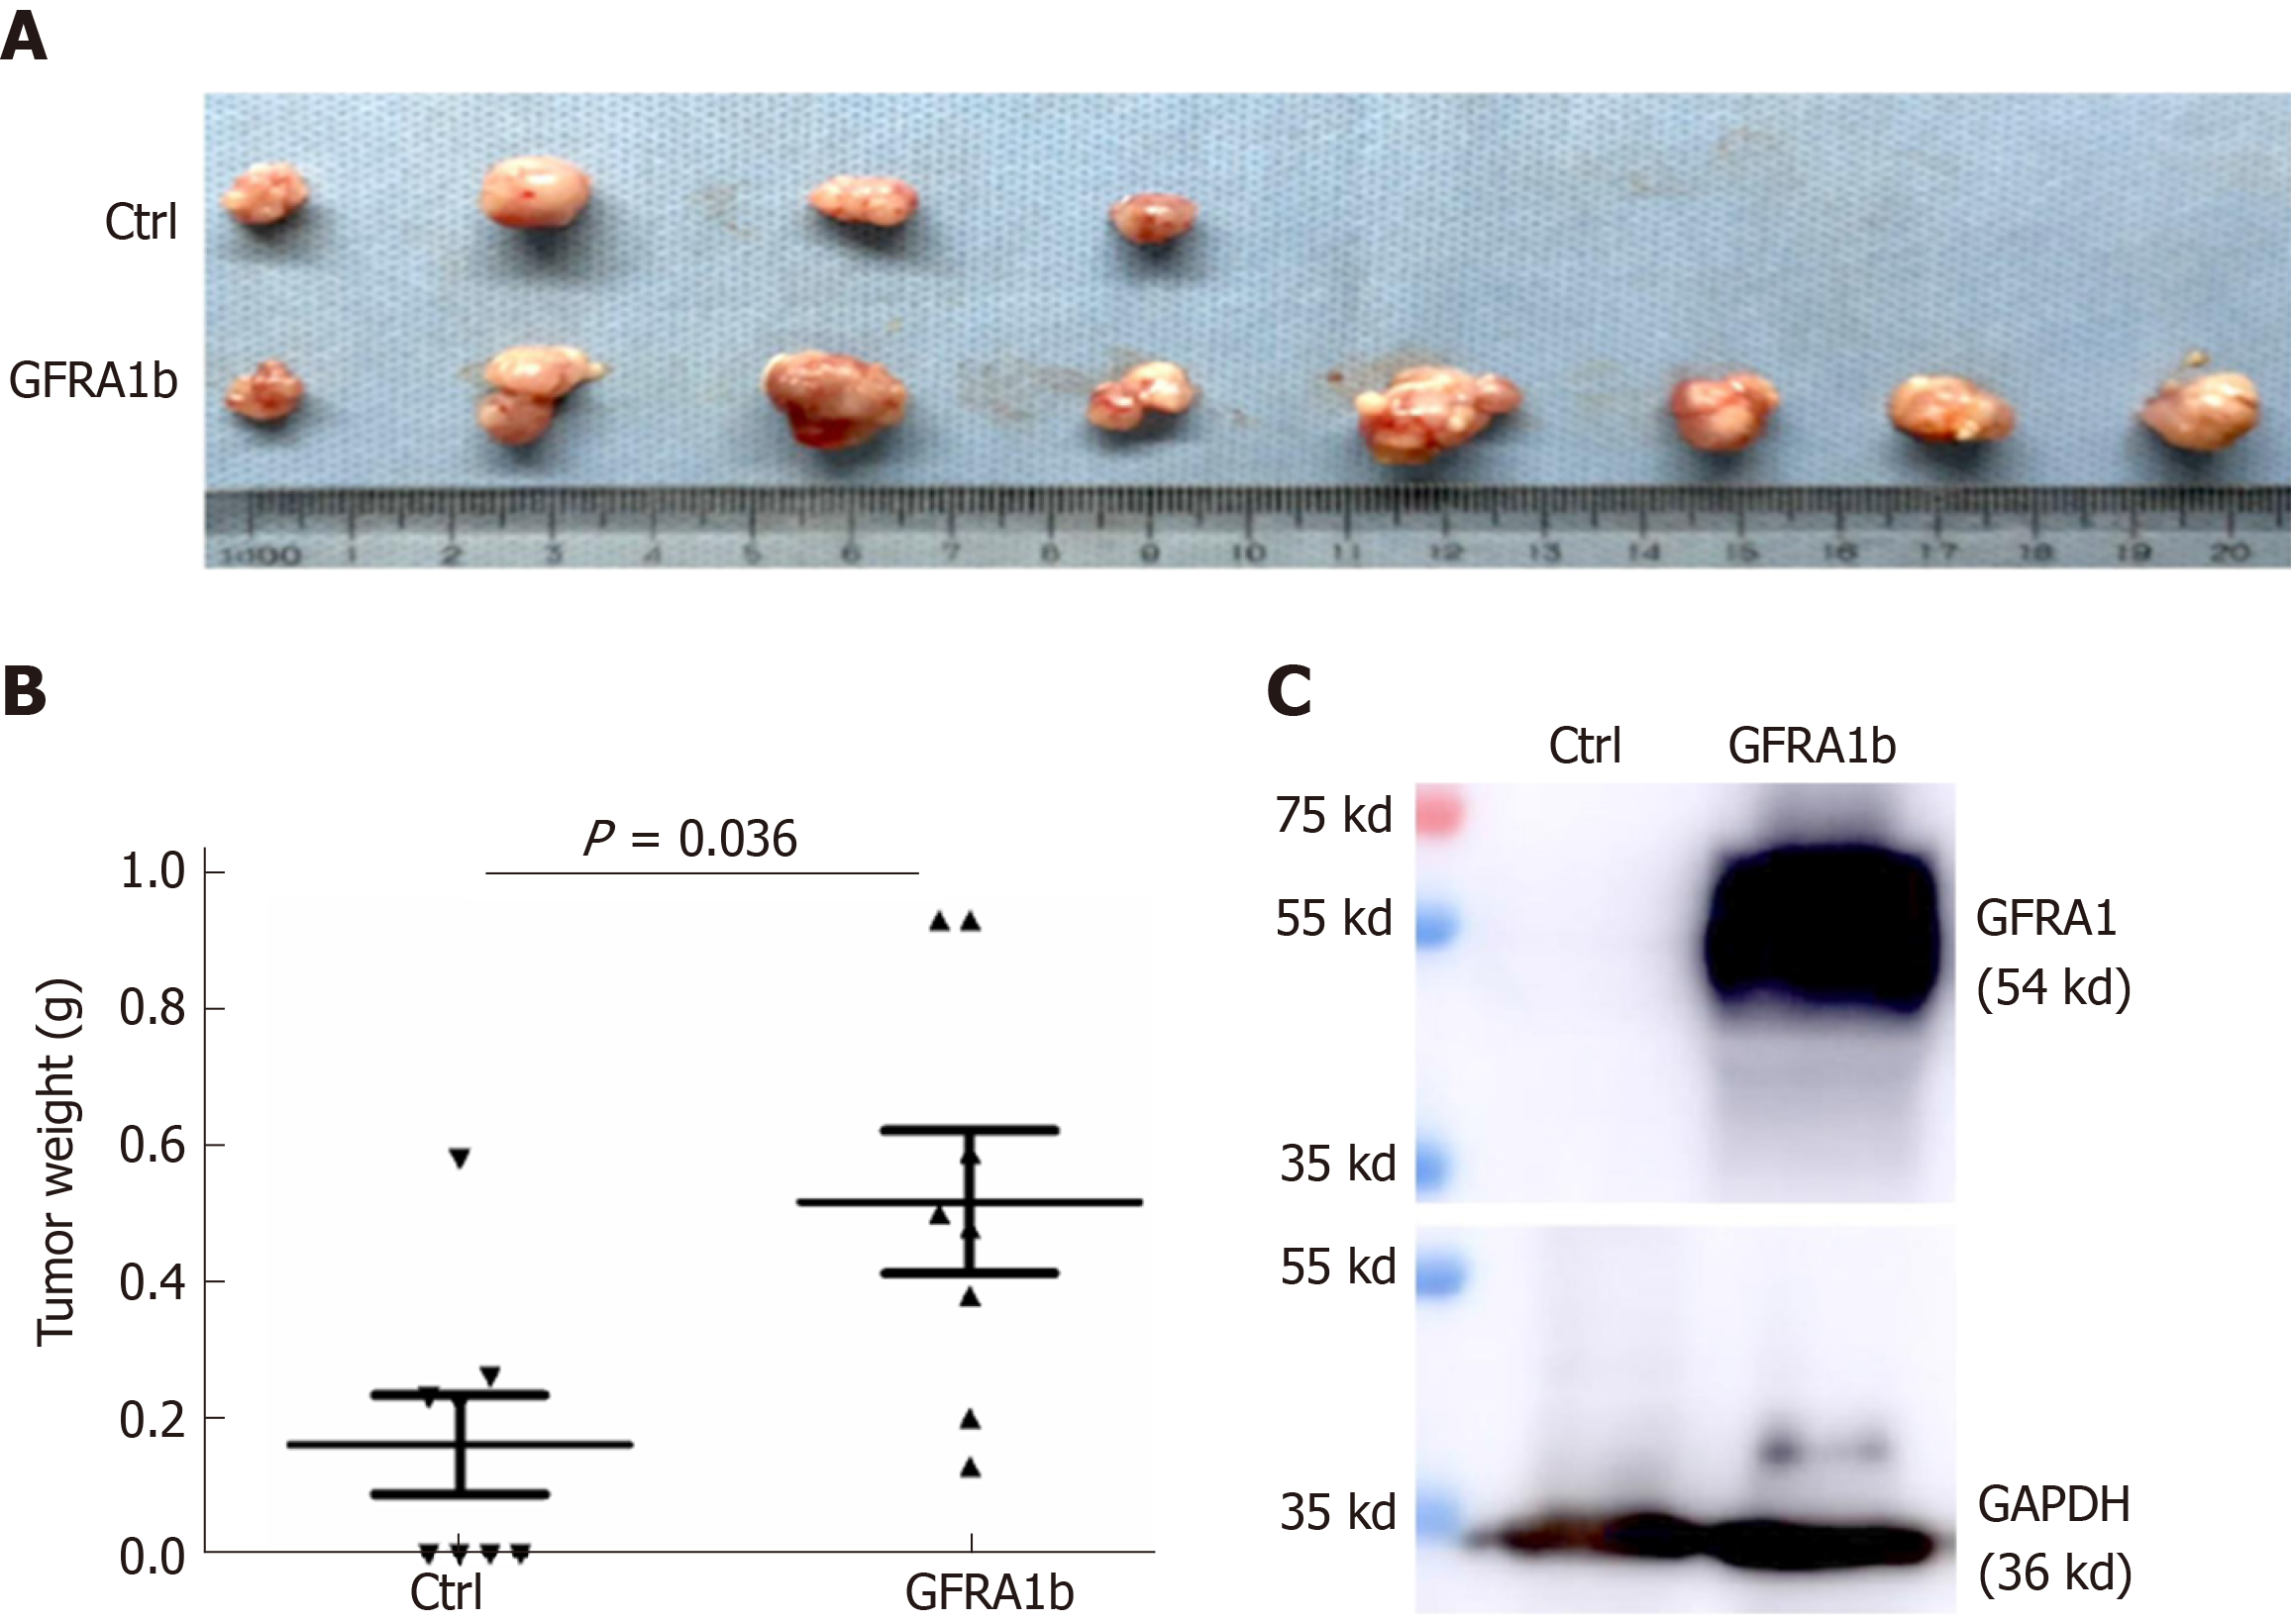
Figure 5 Overexpression of GFRA1b promotes the growth of RKO colon cancer cells in nude mice.
A: Xenograft tumors in the GFRA1b-expressing and negative control (Ctrl) groups on the 29th day post-transplantation. Four mice in the control group did not develop tumors; B: Comparison of the tumor weight in the GFRA1b-expressing and negative control groups (0.518 g vs 0.161 g; Mann-Whitney U-test, P = 0.036); C: Expression status of the GFRA1 protein in one representative tumor from the GFRA1b-expressing and negative control groups by Western blot. Ctrl: Control.
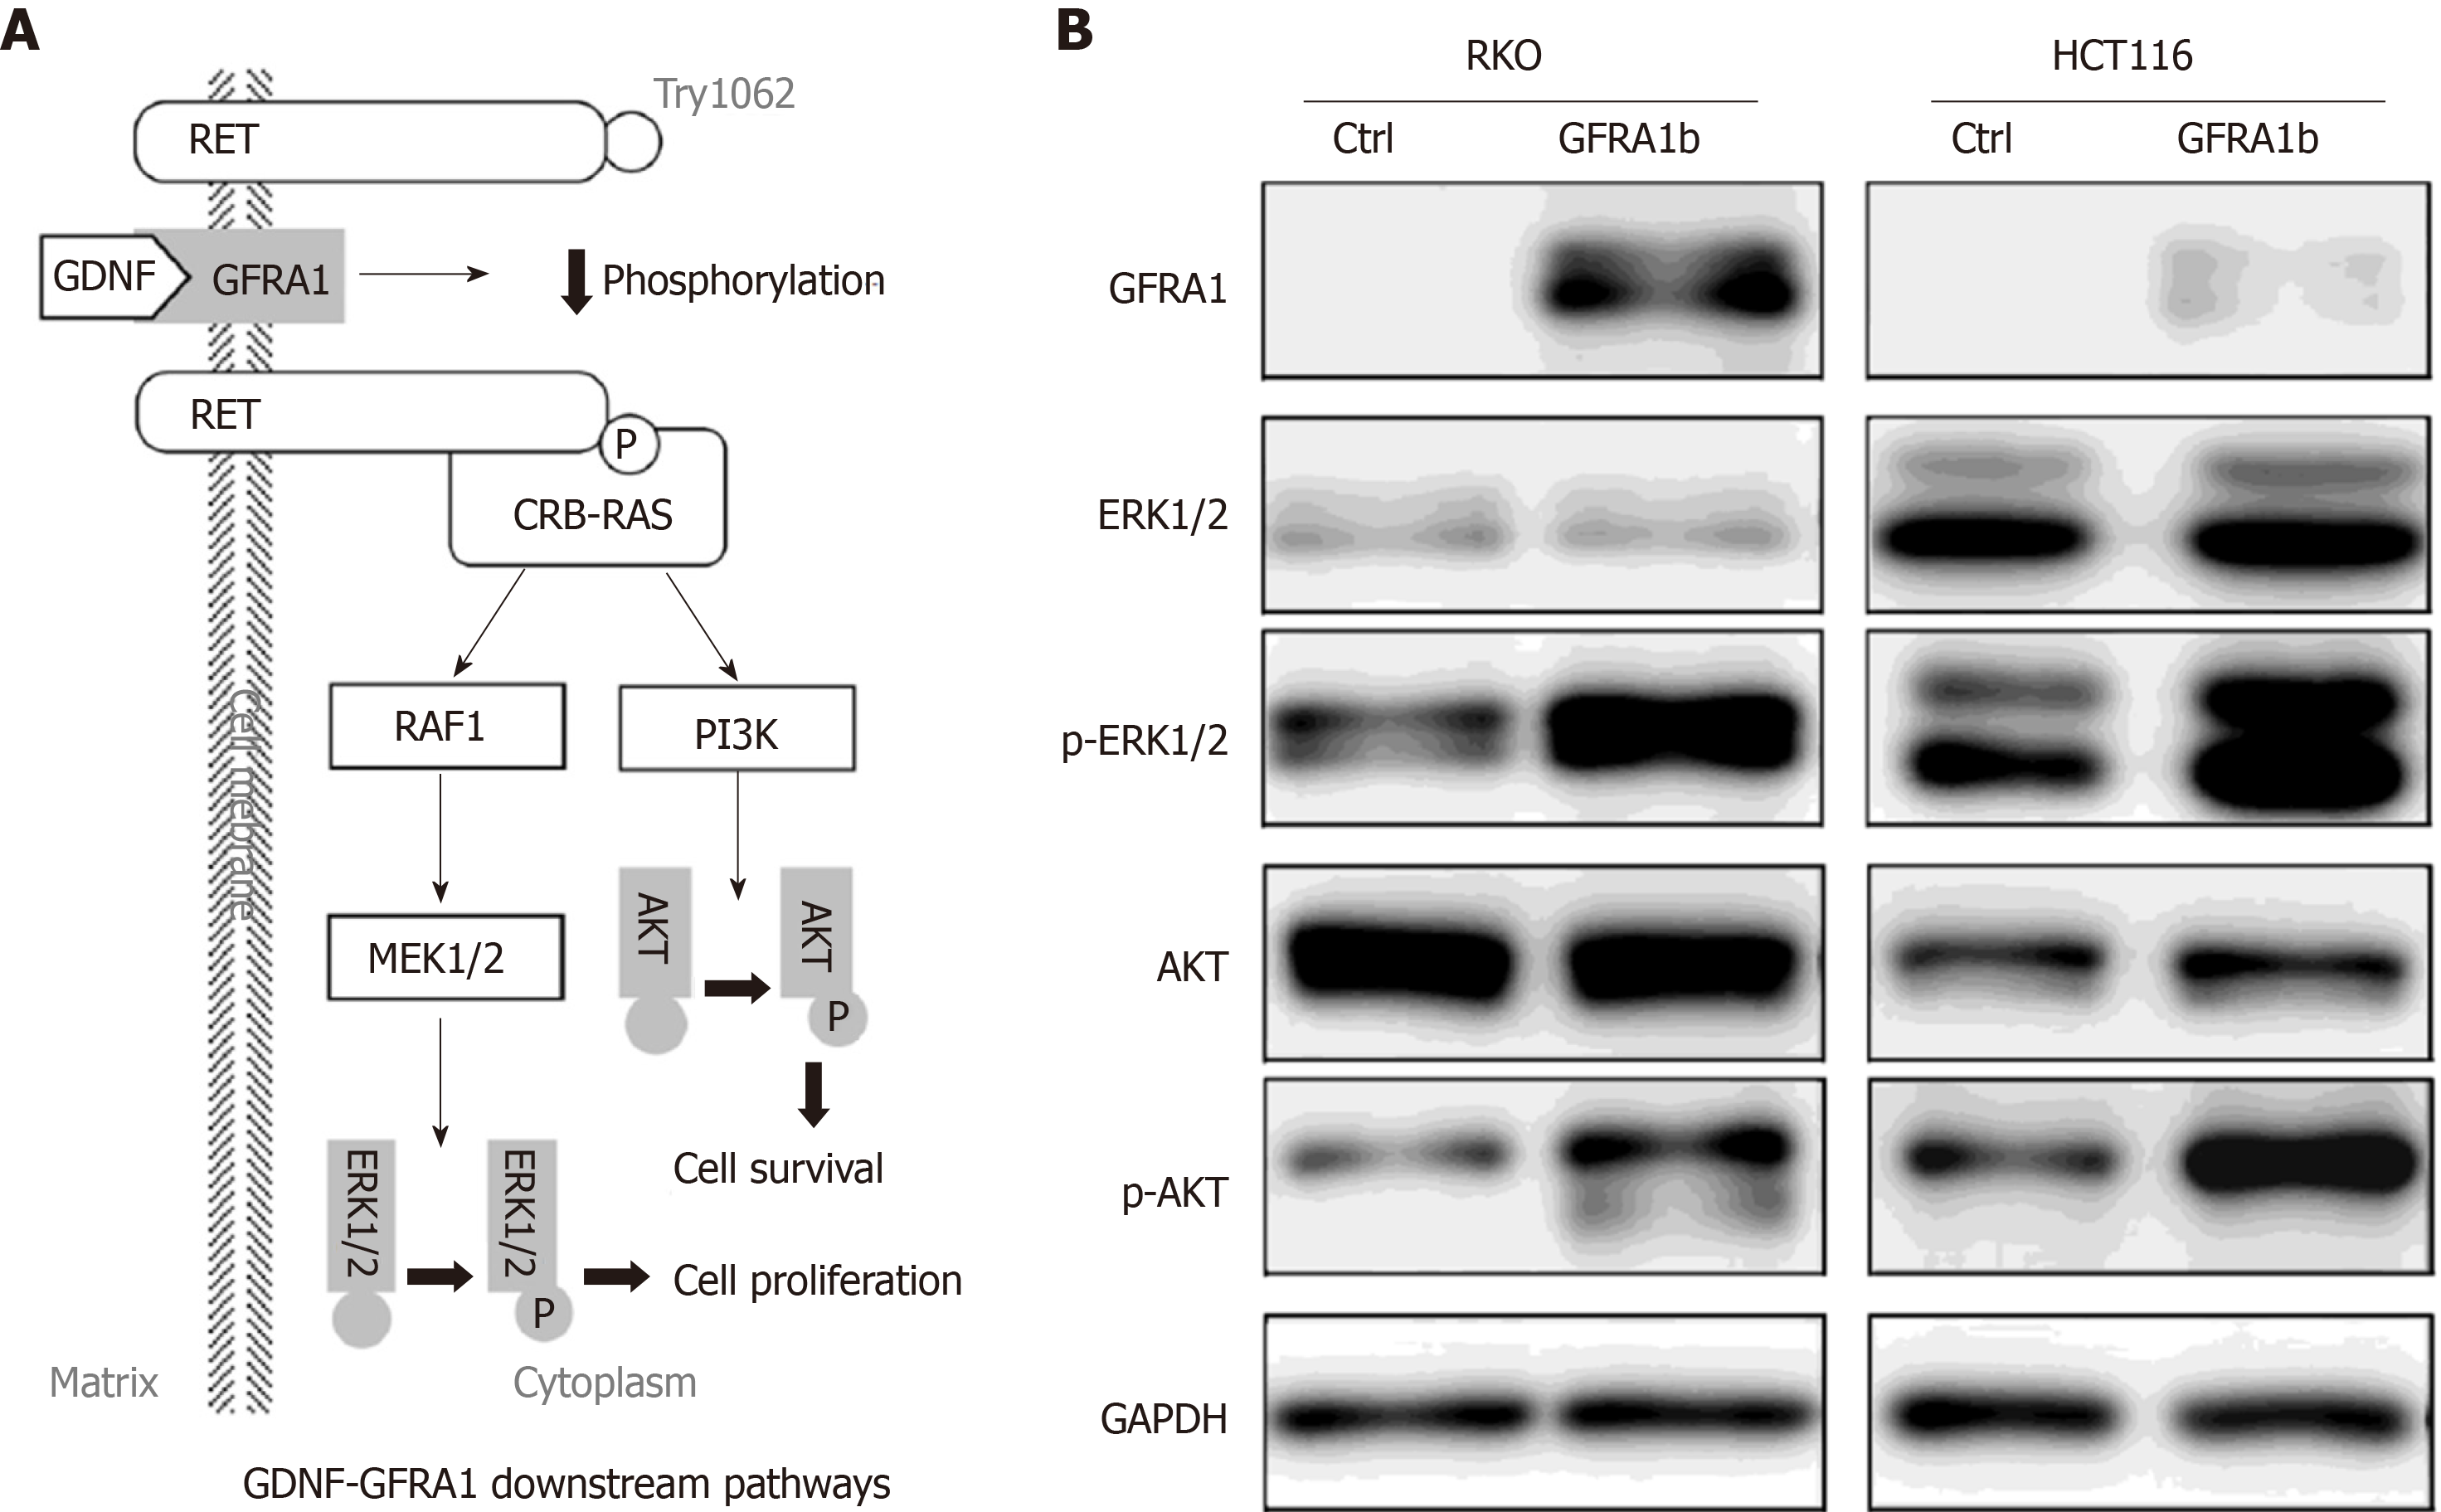
Figure 6 Effect of GFRA1b overexpression on the phosphorylation and expression levels of AKT and ERK proteins in colon cancer cells.
A: GDNF-GFRA1-related downstream RET-RAS-PI3K-AKT and RET-RAS-RAF1-MEK1/2-ERK1/2 signaling pathways[6-8]; B: Phosphorylation and expression levels of AKT and ERK proteins in RKO and HCT116 cells with and without GFRA1 overexpression by Western blot. p-AKT and p-ERK represent phosphorylated AKT and ERK proteins, respectively.
- Citation: Ma WR, Xu P, Liu ZJ, Zhou J, Gu LK, Zhang J, Deng DJ. Impact of GFRA1 gene reactivation by DNA demethylation on prognosis of patients with metastatic colon cancer. World J Gastroenterol 2020; 26(2): 184-198
- URL: https://www.wjgnet.com/1007-9327/full/v26/i2/184.htm
- DOI: https://dx.doi.org/10.3748/wjg.v26.i2.184


