Copyright
©The Author(s) 2020.
World J Gastroenterol. Jan 14, 2020; 26(2): 154-167
Published online Jan 14, 2020. doi: 10.3748/wjg.v26.i2.154
Published online Jan 14, 2020. doi: 10.3748/wjg.v26.i2.154
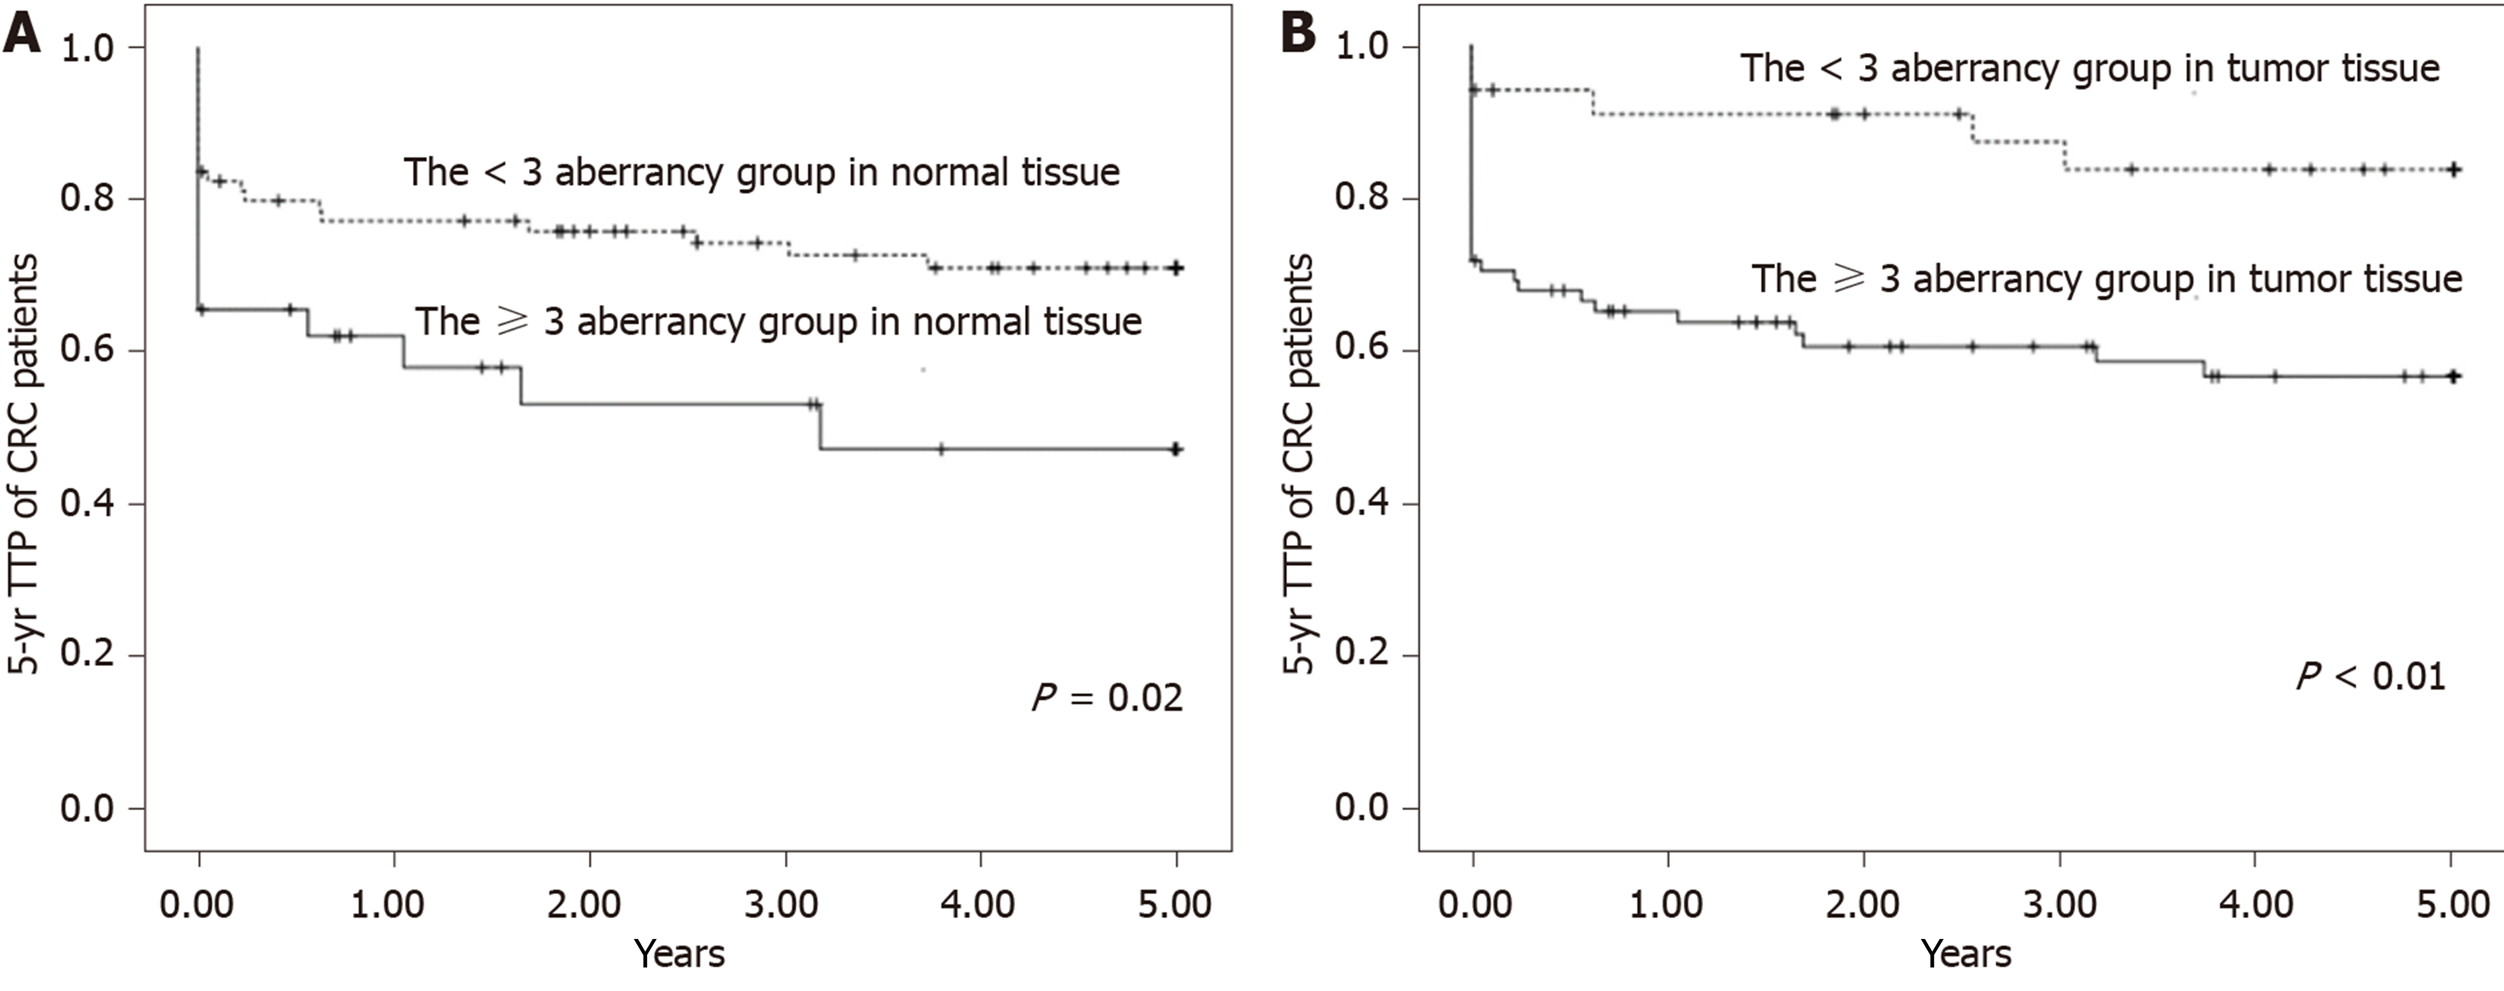
Figure 1 Kaplan–Meier survival curves depicting the effect of ≥ 3 aberrancies in (A) normal tissue and (B) tumor tissue on 5-year time to progression of colorectal cancer patients.
Vertical tick marks indicate censored events. TTP: Time to progression; CRC: Colorectal cancer.
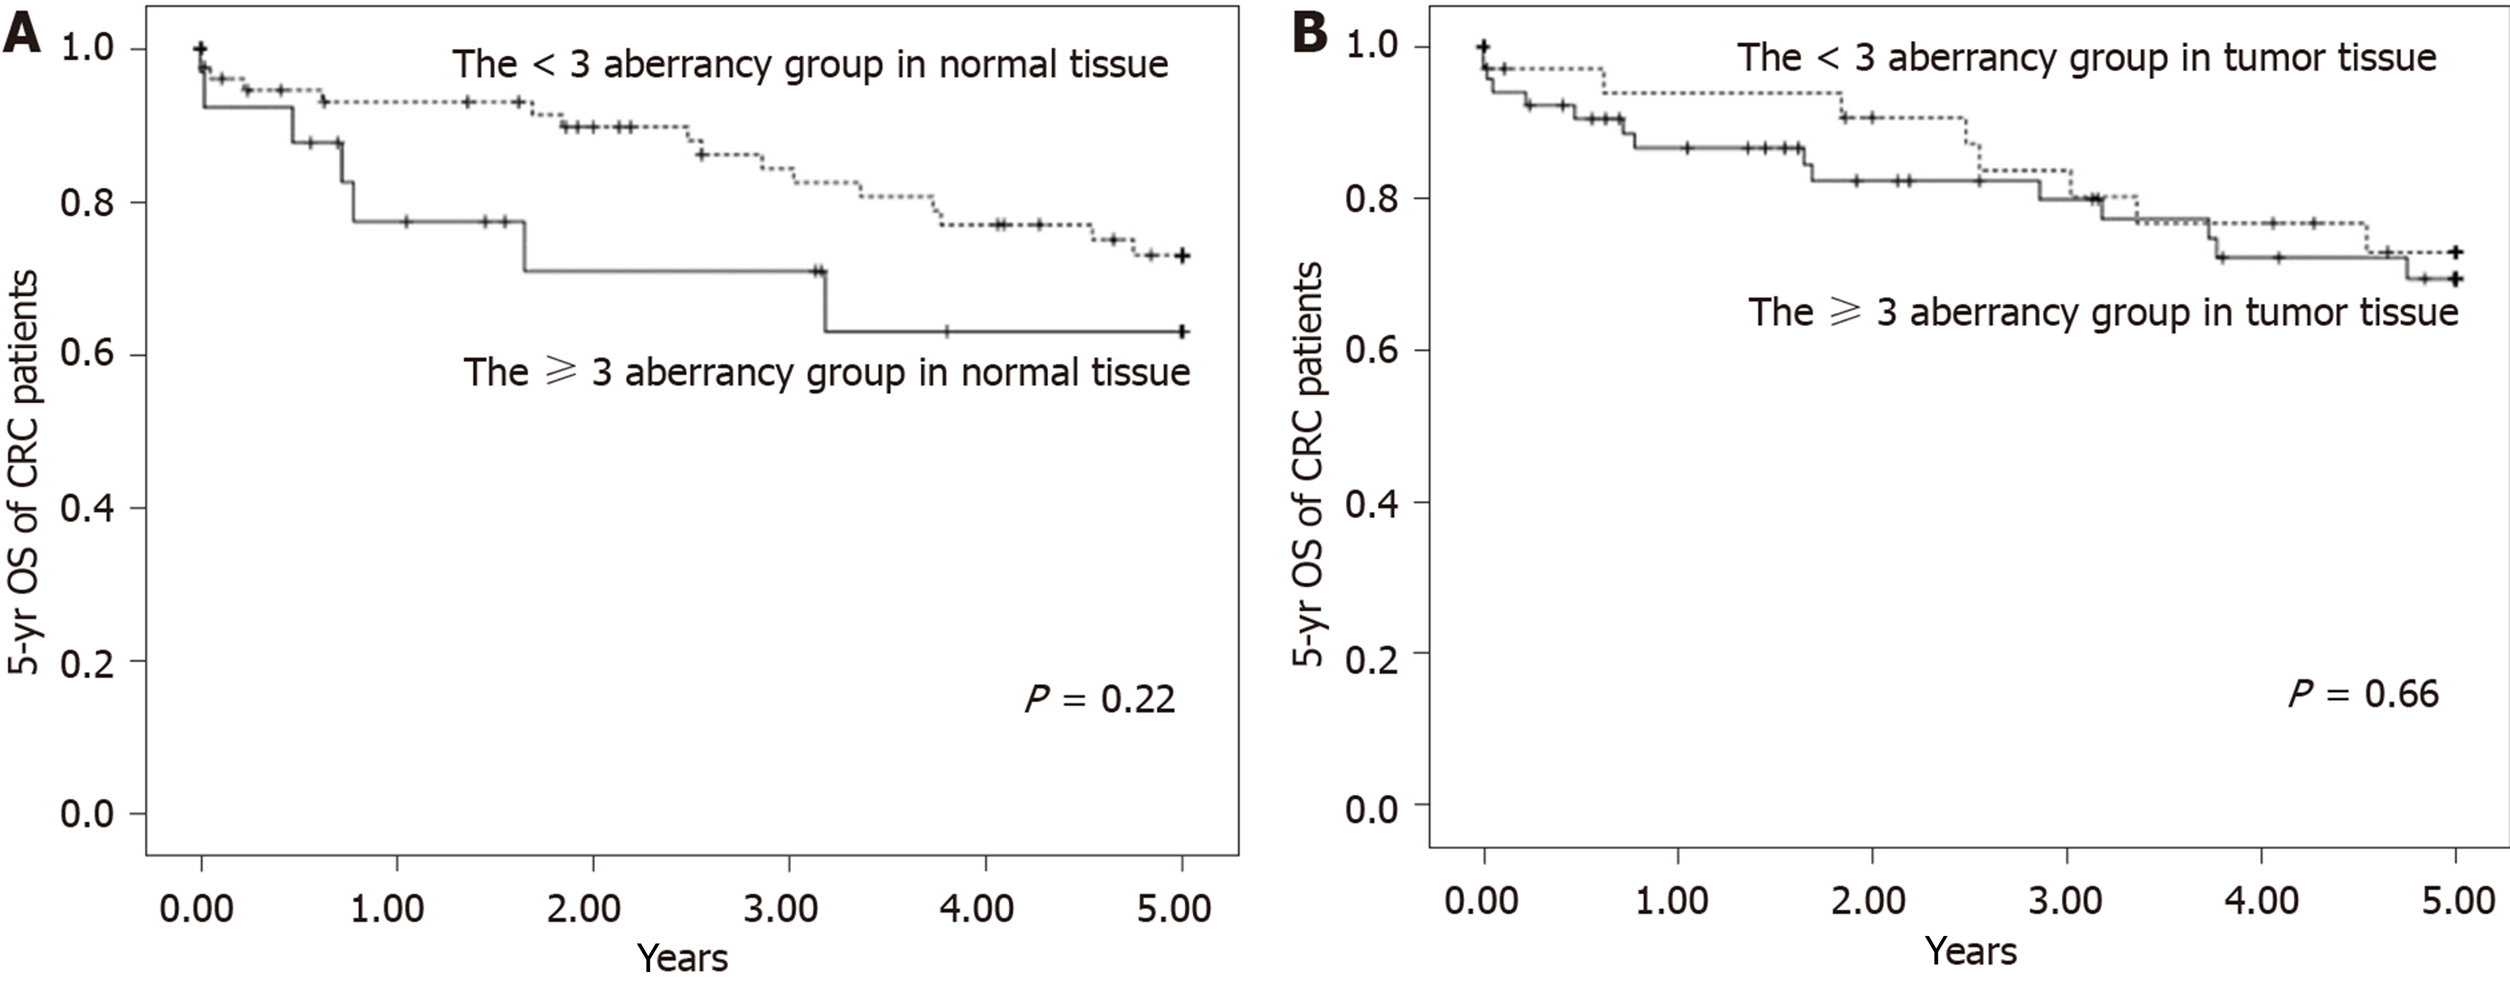
Figure 2 Kaplan–Meier survival curves depicting the effect of ≥ 3 aberrancies in (A) normal tissue and (B) tumor tissue on 5-year overall survival of colorectal cancer patients.
Vertical tick marks indicate censored events. OS: Overall survival; CRC: Colorectal cancer.
- Citation: Hsu CH, Hsiao CW, Sun CA, Wu WC, Yang T, Hu JM, Huang CH, Liao YC, Chen CY, Lin FH, Chou YC. Novel methylation gene panel in adjacent normal tissues predicts poor prognosis of colorectal cancer in Taiwan. World J Gastroenterol 2020; 26(2): 154-167
- URL: https://www.wjgnet.com/1007-9327/full/v26/i2/154.htm
- DOI: https://dx.doi.org/10.3748/wjg.v26.i2.154


