Copyright
©The Author(s) 2020.
World J Gastroenterol. May 7, 2020; 26(17): 2082-2096
Published online May 7, 2020. doi: 10.3748/wjg.v26.i17.2082
Published online May 7, 2020. doi: 10.3748/wjg.v26.i17.2082
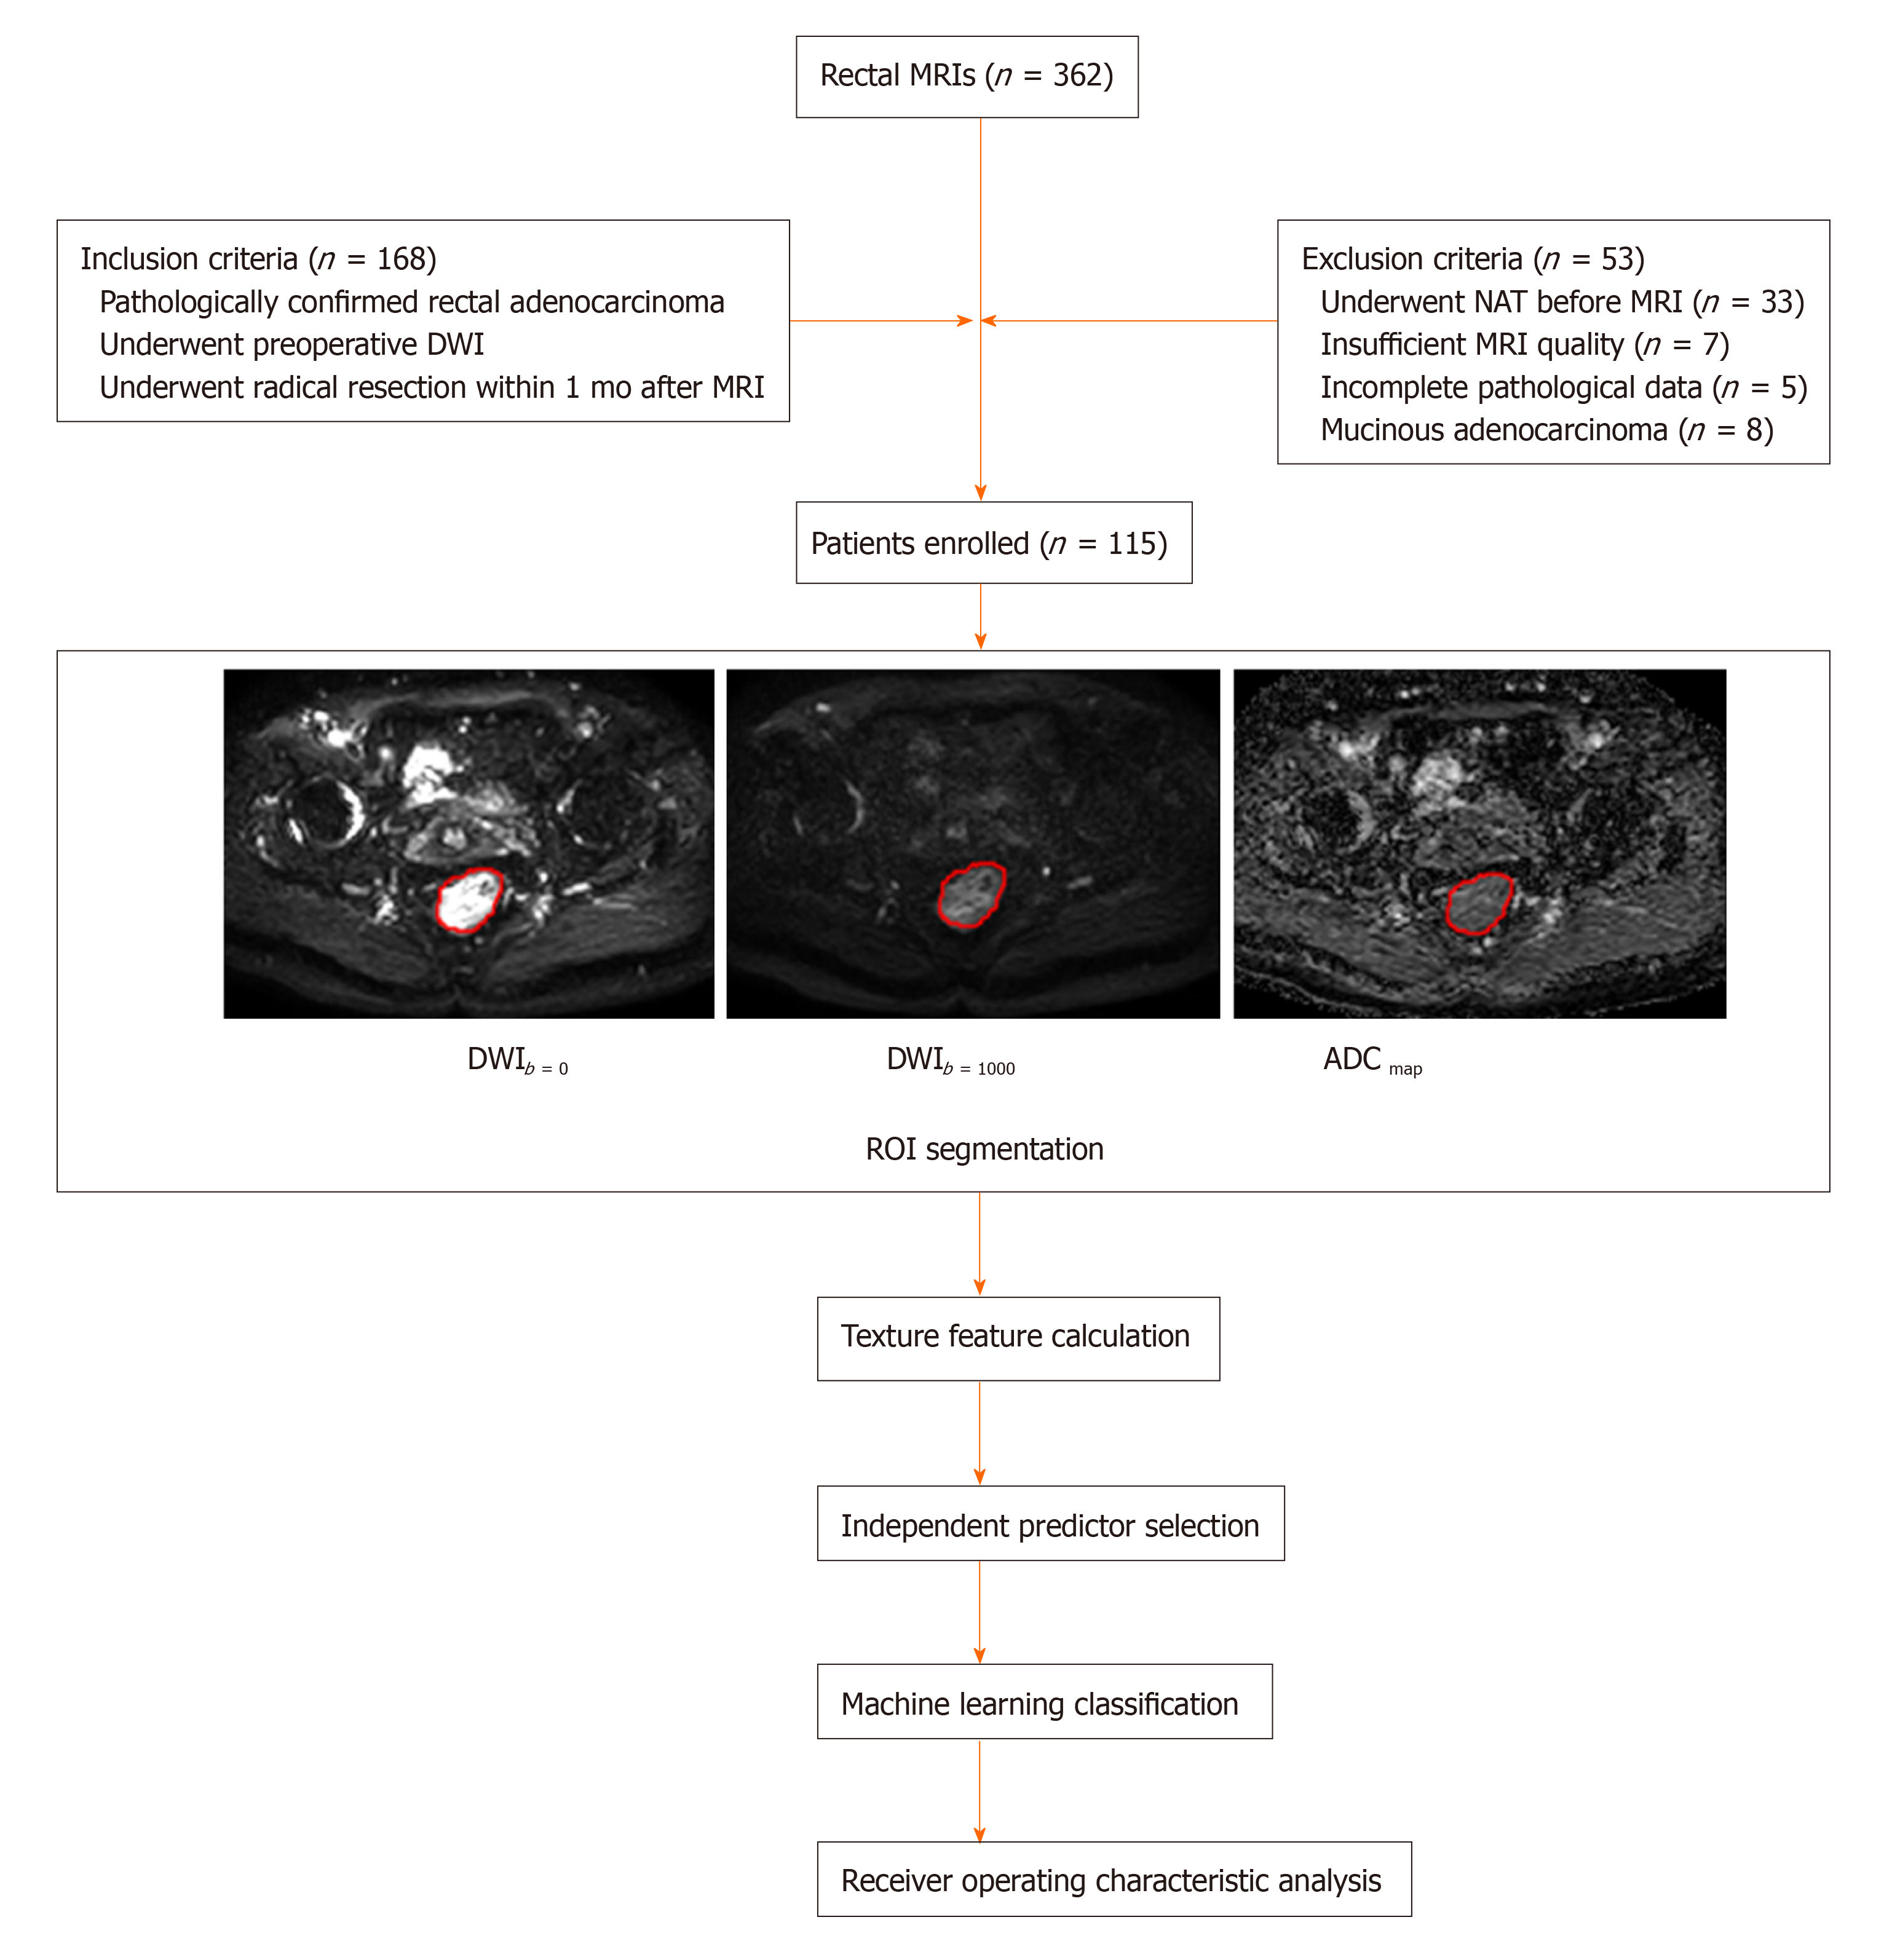
Figure 1 Flow chart adopted in this study.
MRI: Magnetic resonance imaging; DWI: Diffusion-weighted imaging; NAT: Neoadjuvant chemoradiotherapy; ADC: Apparent diffusion coefficient; ROI: Region of interest.
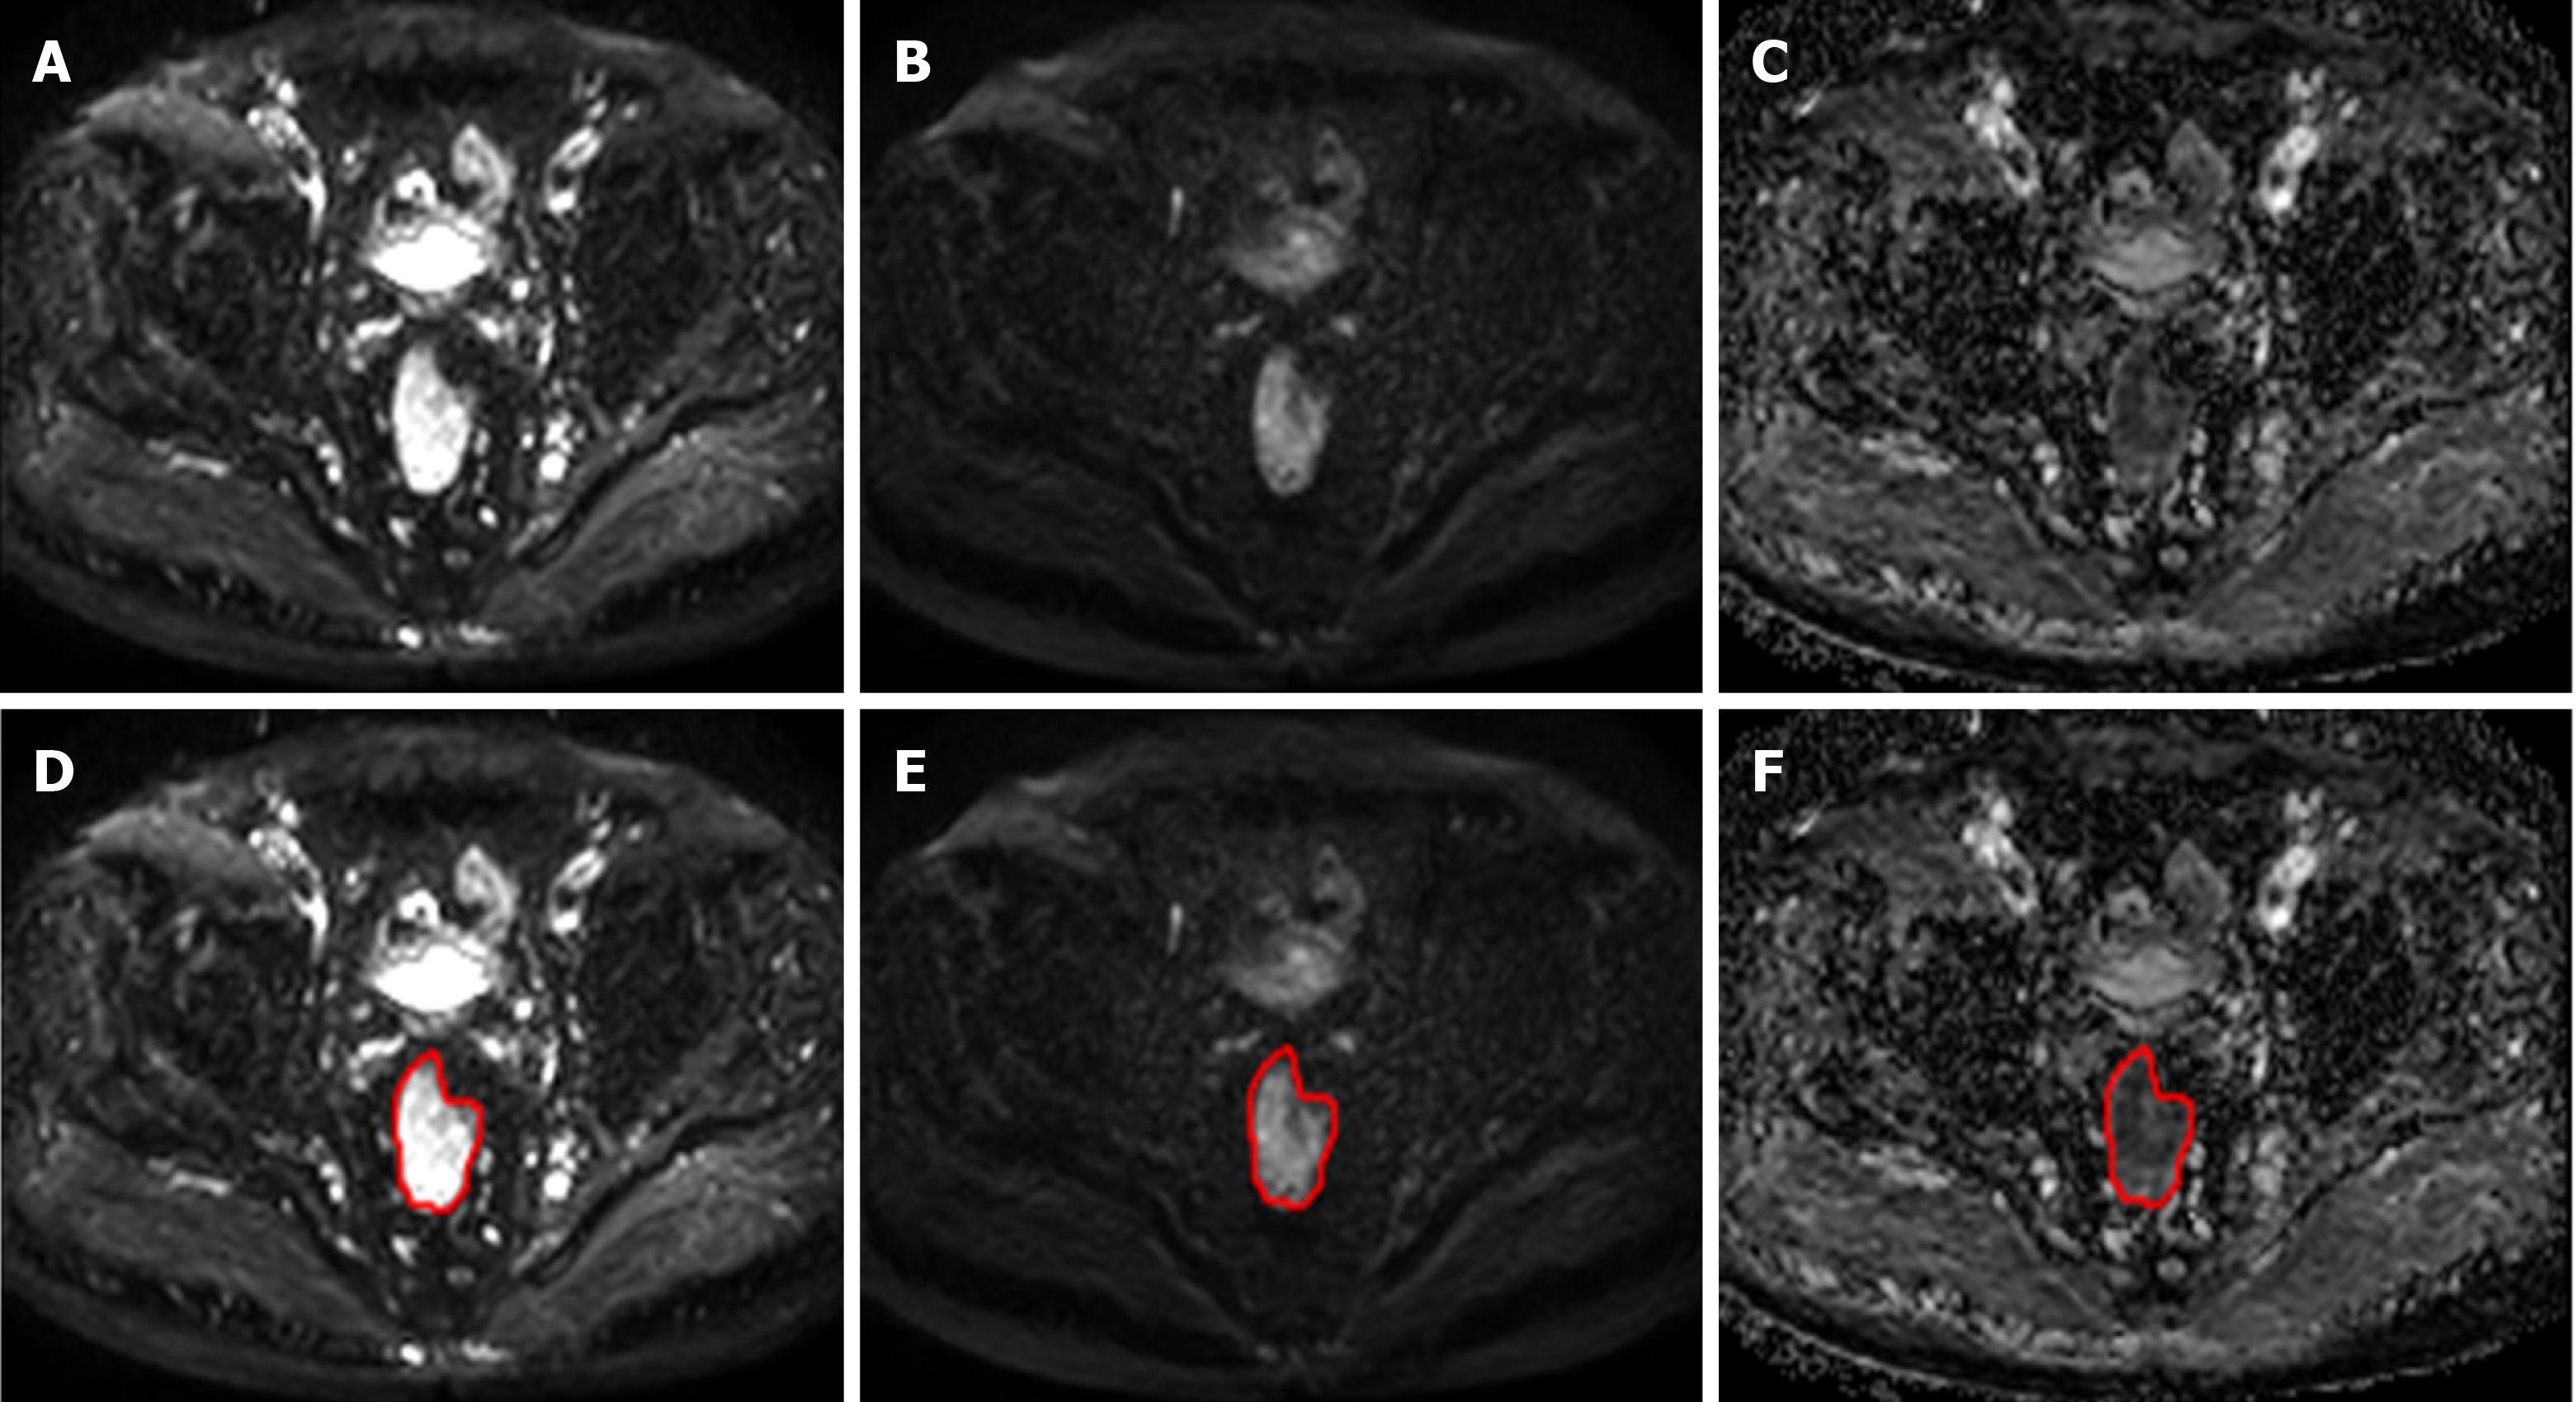
Figure 2 The region of interest segmentation results for a randomly selected case.
A-C: Represent diffusion-weighted imaging (DWI)b=0, DWIb=1000 and the apparent diffusion coefficient image on the same slice, respectively; D-F: With regard to T2WI and DWI, the lesion region of interest was drawn on the apparent diffusion coefficient map (F) and copied onto the DWIb=0 (D) and DWIb=1000 (E) images.
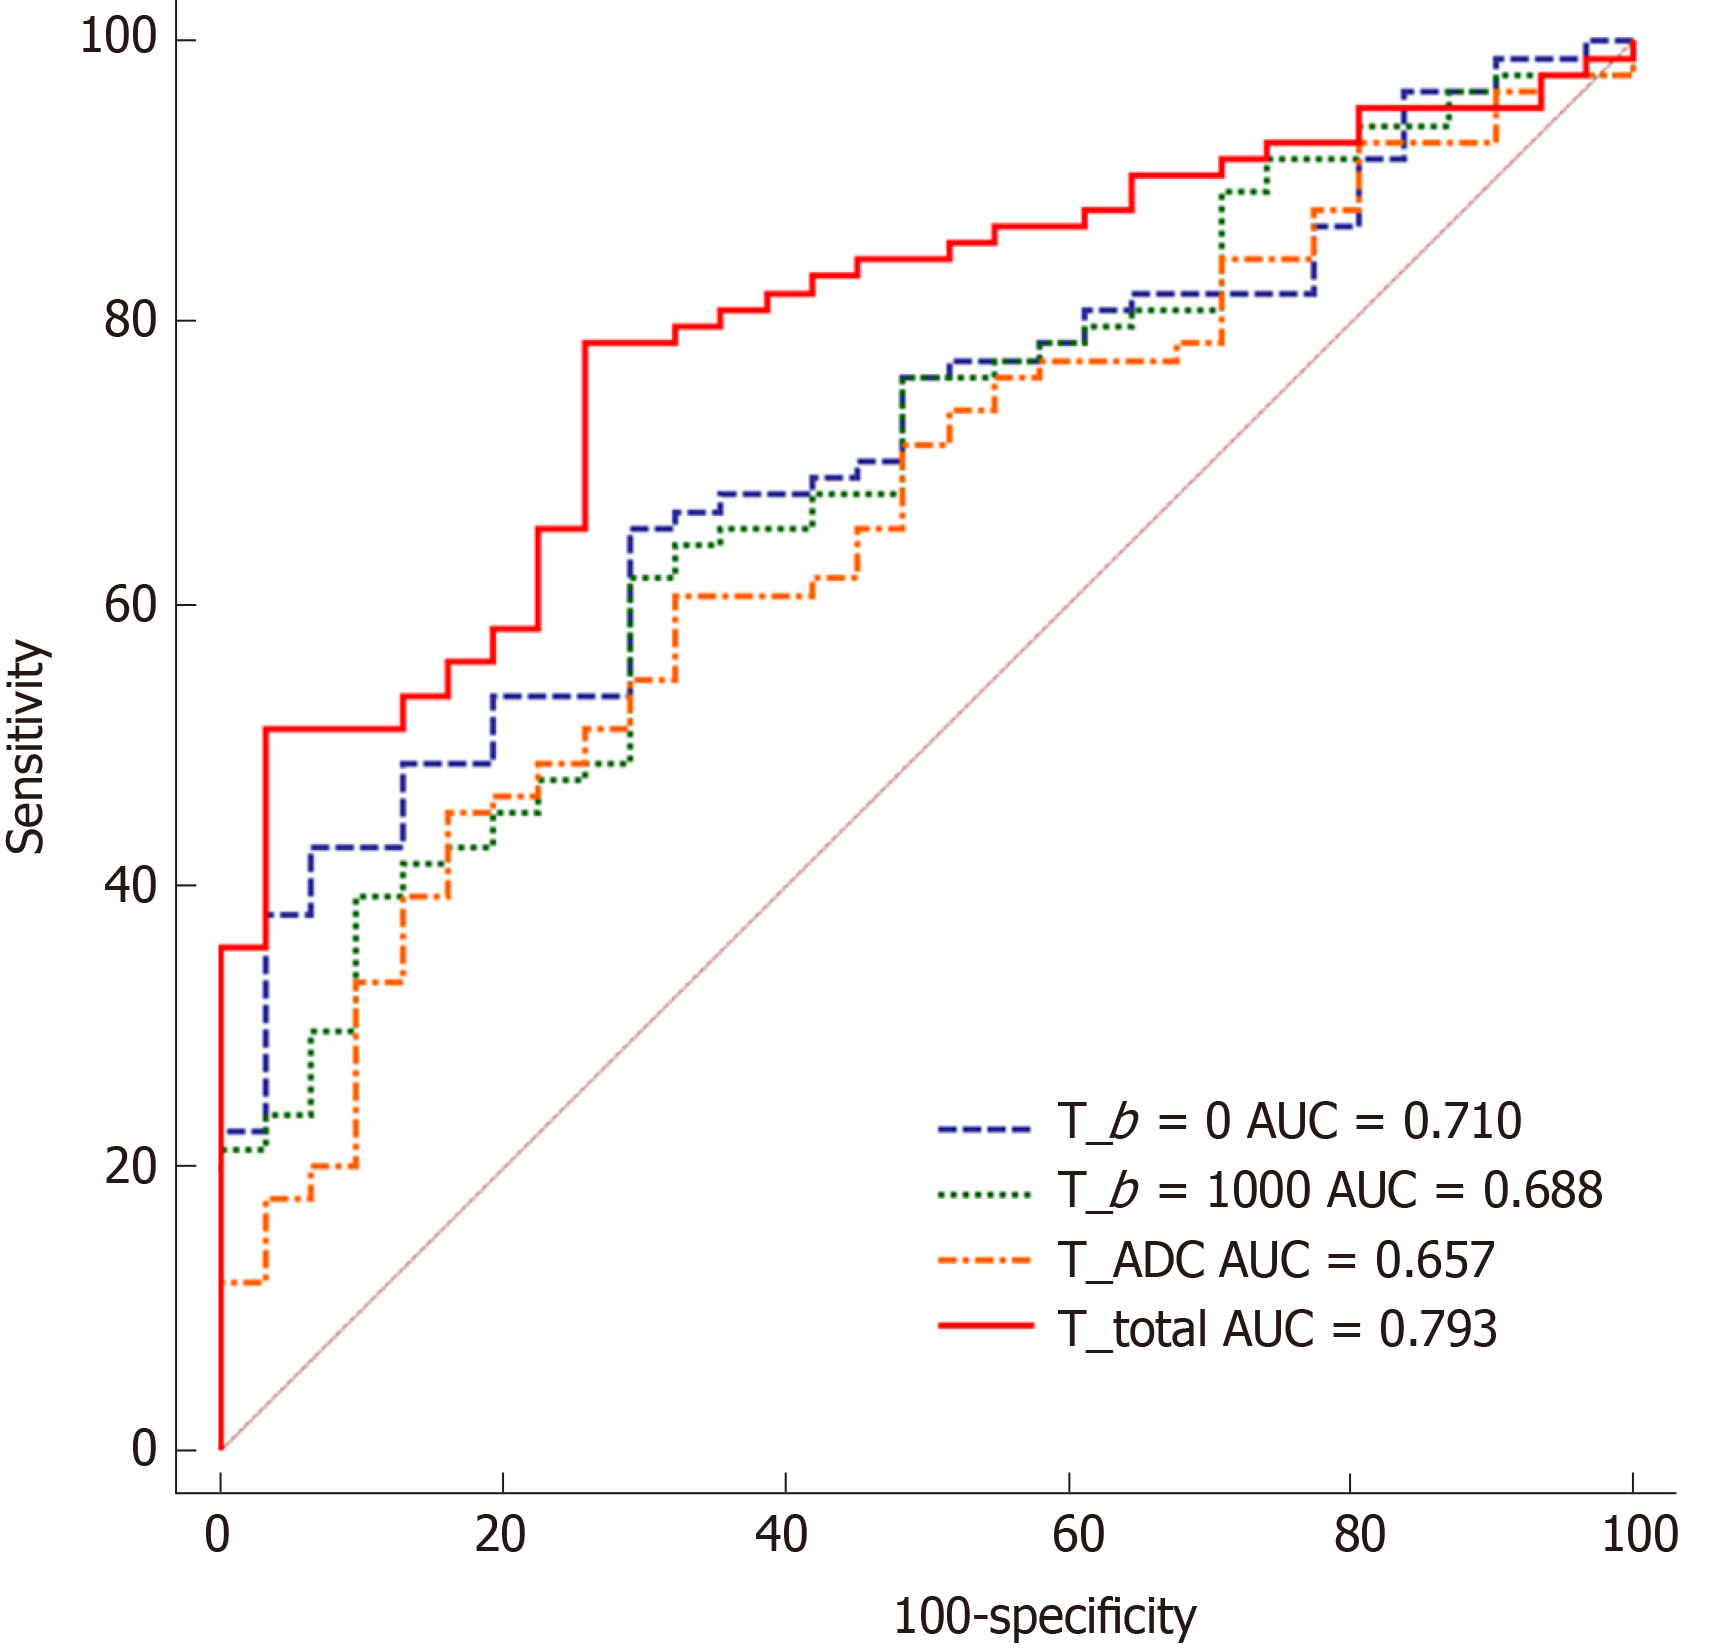
Figure 3 Receiver operating characteristic curves obtained with different discriminatory models for predicting T1-2 and T3-4 stage tumors.
AUC: Area under the receiver operating characteristic curve; ADC: Apparent diffusion coefficient.
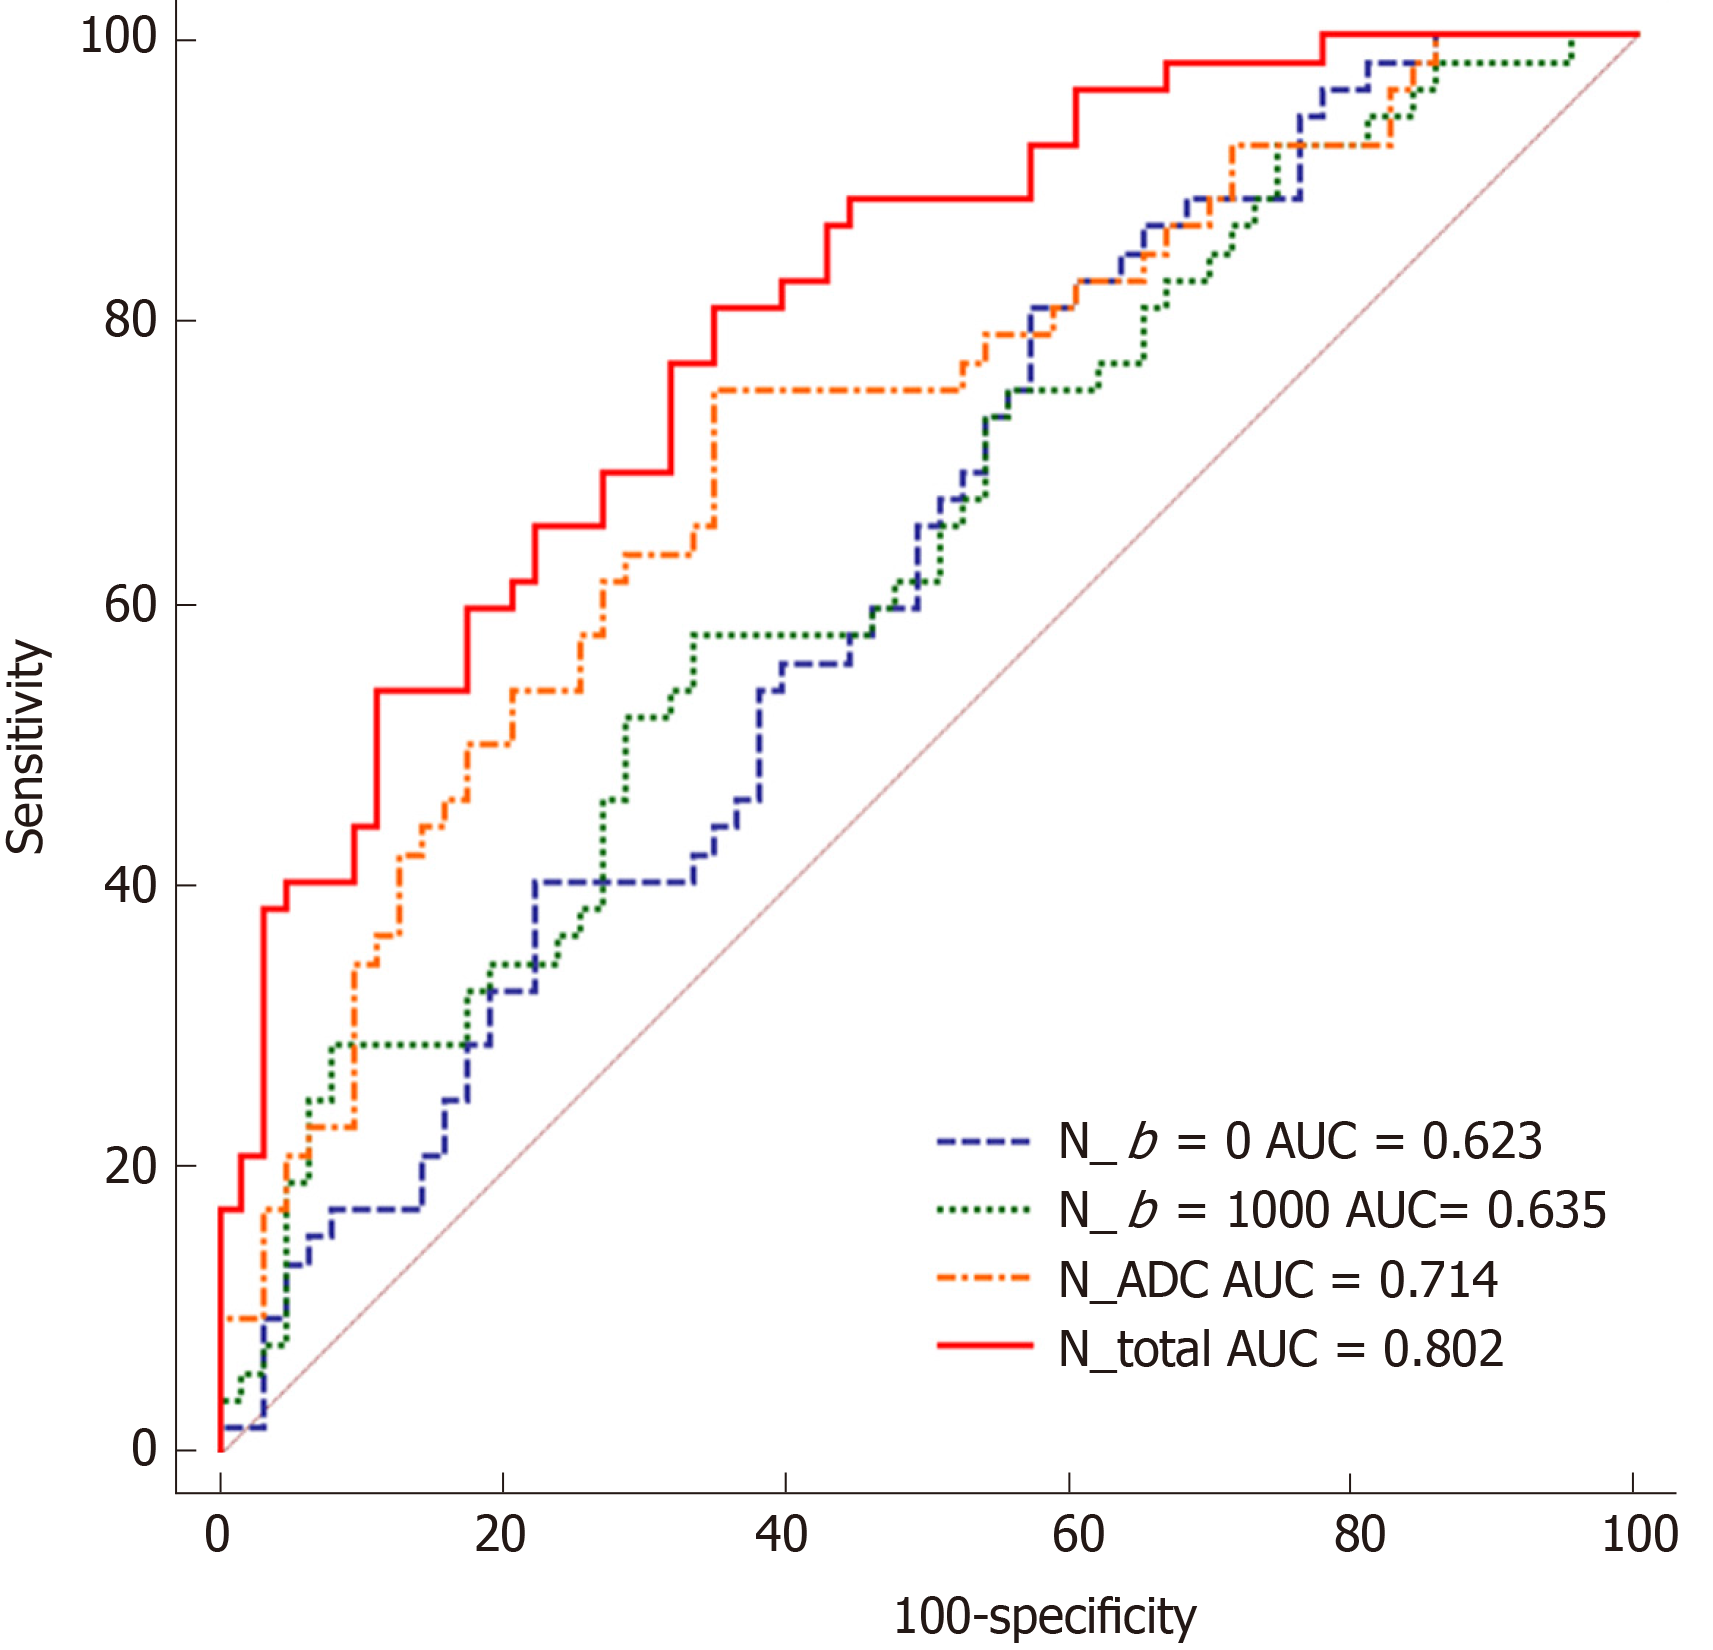
Figure 4 Receiver operating characteristic curves obtained with different discriminatory models for predicting N0 and N1-2 stage tumors.
AUC: Area under the receiver operating characteristic curve; ADC: Apparent diffusion coefficient.
- Citation: Yin JD, Song LR, Lu HC, Zheng X. Prediction of different stages of rectal cancer: Texture analysis based on diffusion-weighted images and apparent diffusion coefficient maps. World J Gastroenterol 2020; 26(17): 2082-2096
- URL: https://www.wjgnet.com/1007-9327/full/v26/i17/2082.htm
- DOI: https://dx.doi.org/10.3748/wjg.v26.i17.2082


