Copyright
©The Author(s) 2020.
World J Gastroenterol. Mar 21, 2020; 26(11): 1142-1155
Published online Mar 21, 2020. doi: 10.3748/wjg.v26.i11.1142
Published online Mar 21, 2020. doi: 10.3748/wjg.v26.i11.1142
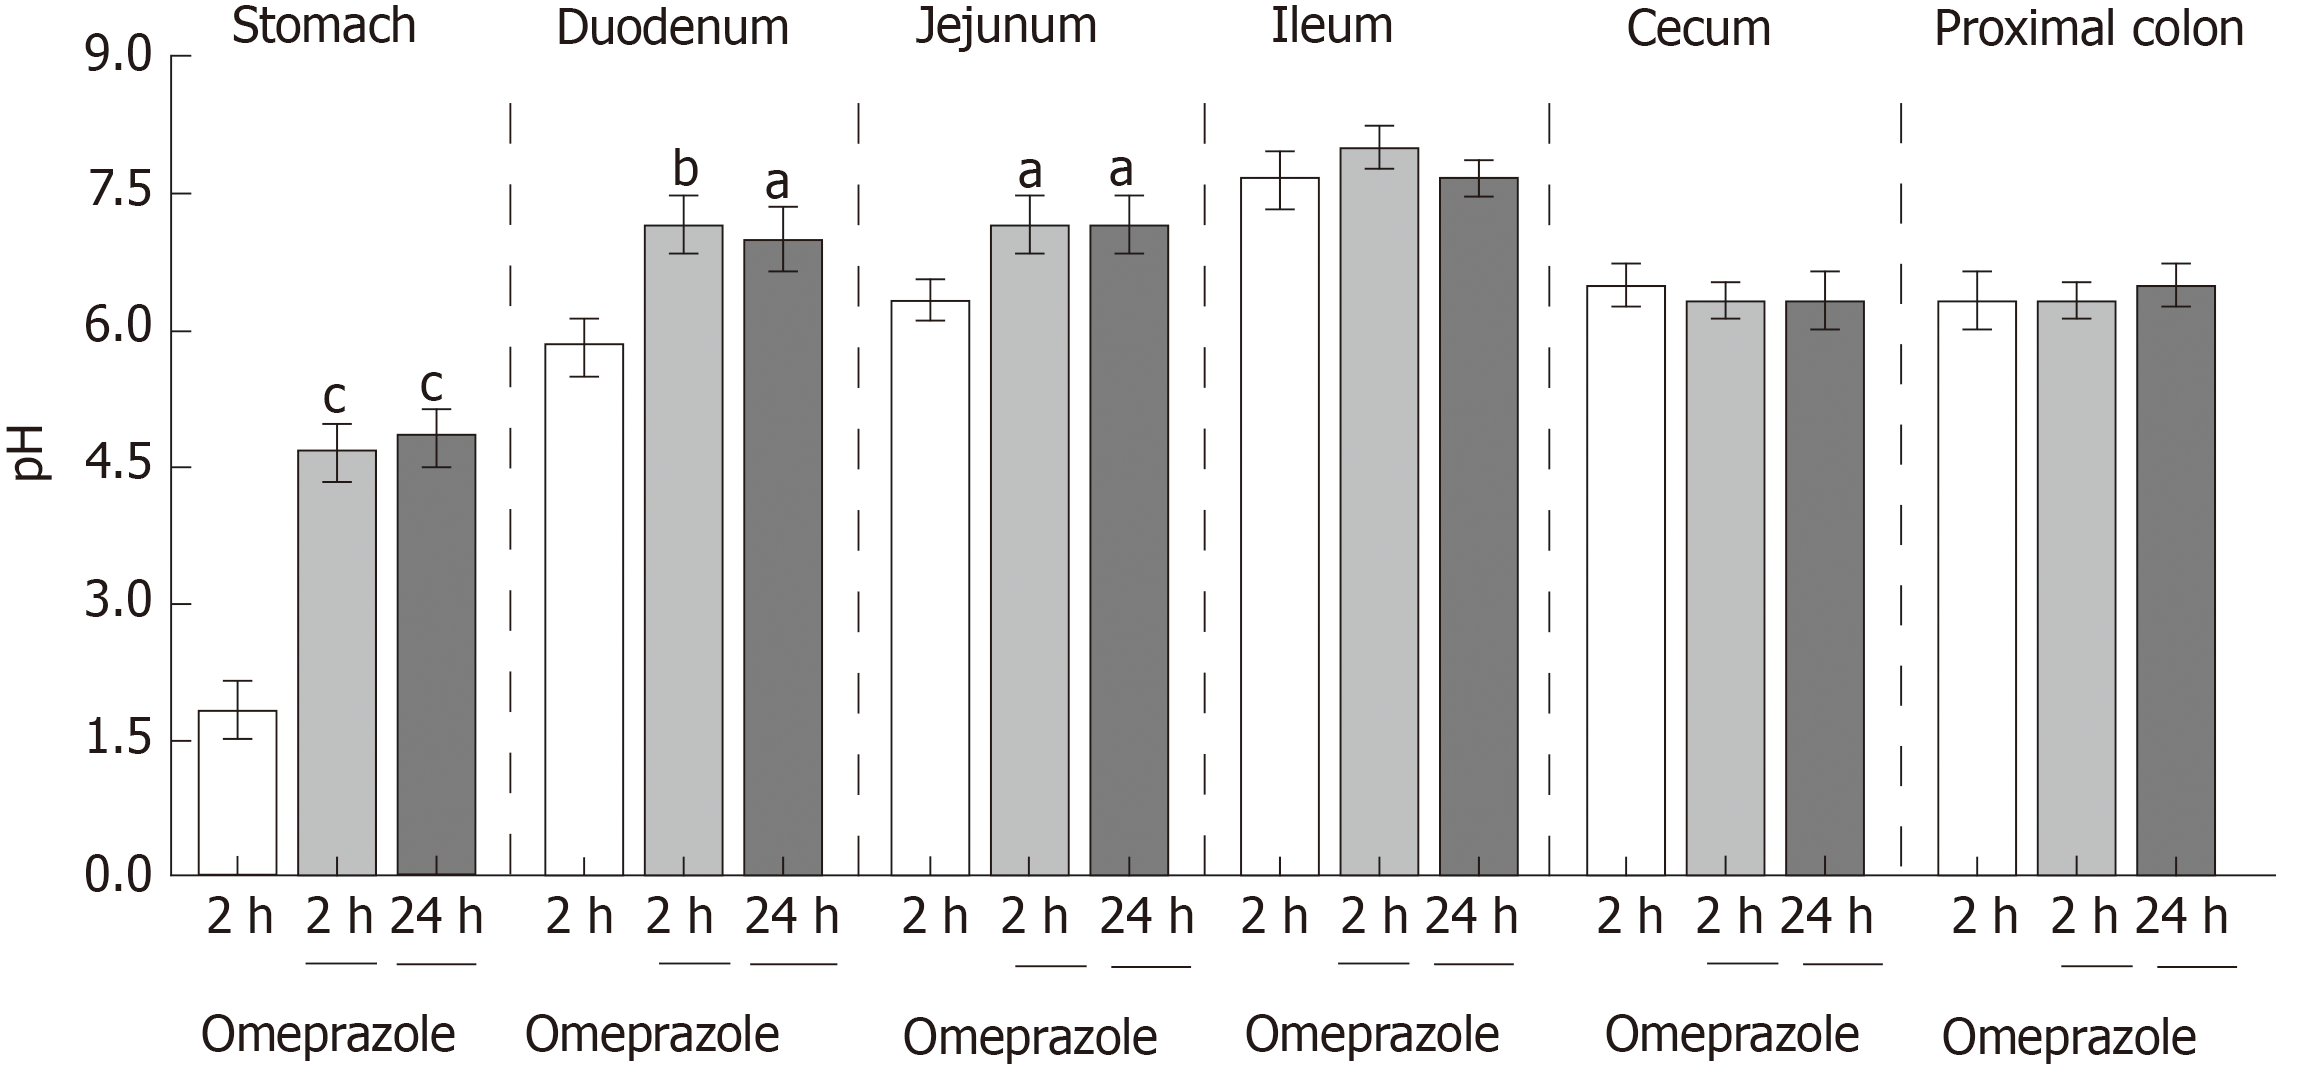
Figure 1 Effect of subcutaneous omeprazole injection on rat gastrointestinal pH.
Intraluminal pH was measured by using test strips after 2 or 24 h after omeprazole administration. aP < 0.05, bP < 0.01, cP < 0.001,vs the control group (n = 6).
Figure 2 Metabolic characteristics.
A: Body weight; B: Food intake; C: Water intake; D: Fecal dry weight; E: Urinary excretion of control, 12 wk-omeprazole-treated, and 24 wk-omeprazole-treated groups. aP < 0.05, bP < 0.01, vs the control group (n = 6).
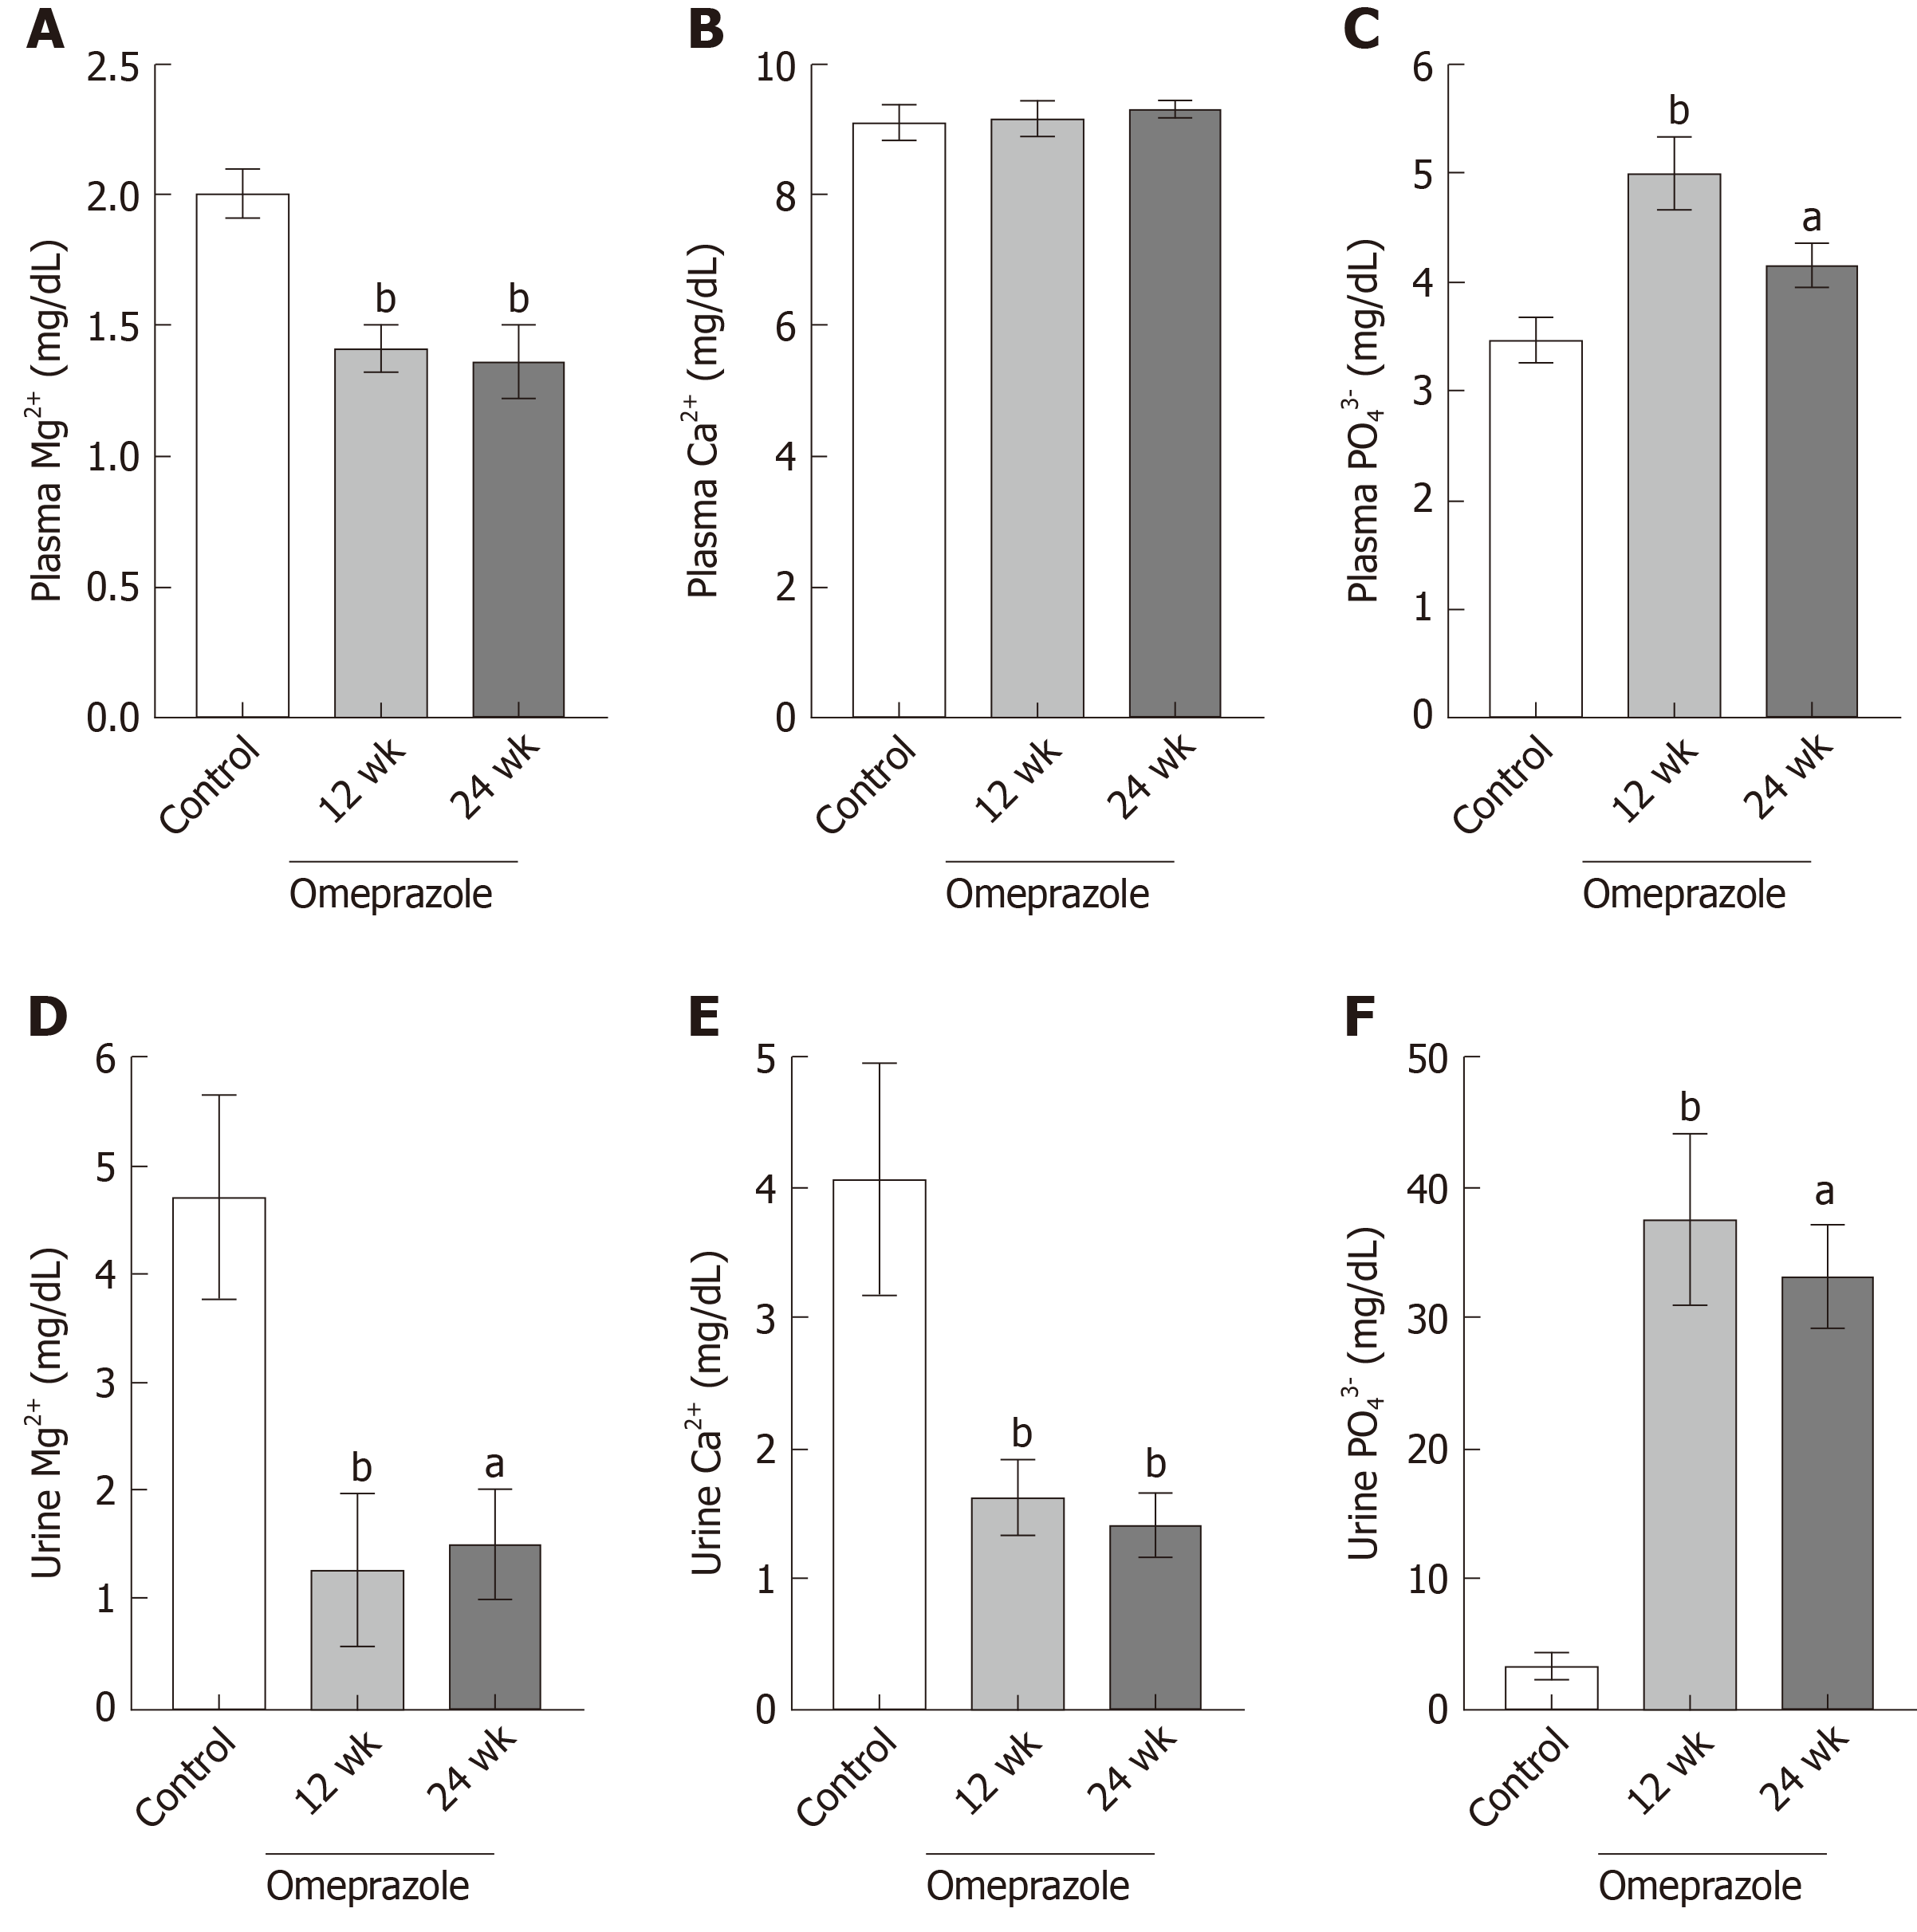
Figure 3 Effect of omeprazole on plasma and urinary Mg2+, Ca2+, and PO43− levels.
A: Plasma Mg2+; B: Plasma Ca2+; C: Plasma PO43−; D: Urinary Mg2+; E: Urinary Ca2+; F: Urinary PO43− levels of control, 12 wk-omeprazole-treated, and 24 wk-omeprazole-treated groups. aP < 0.05, bP < 0.01, vs the control group (n = 6).
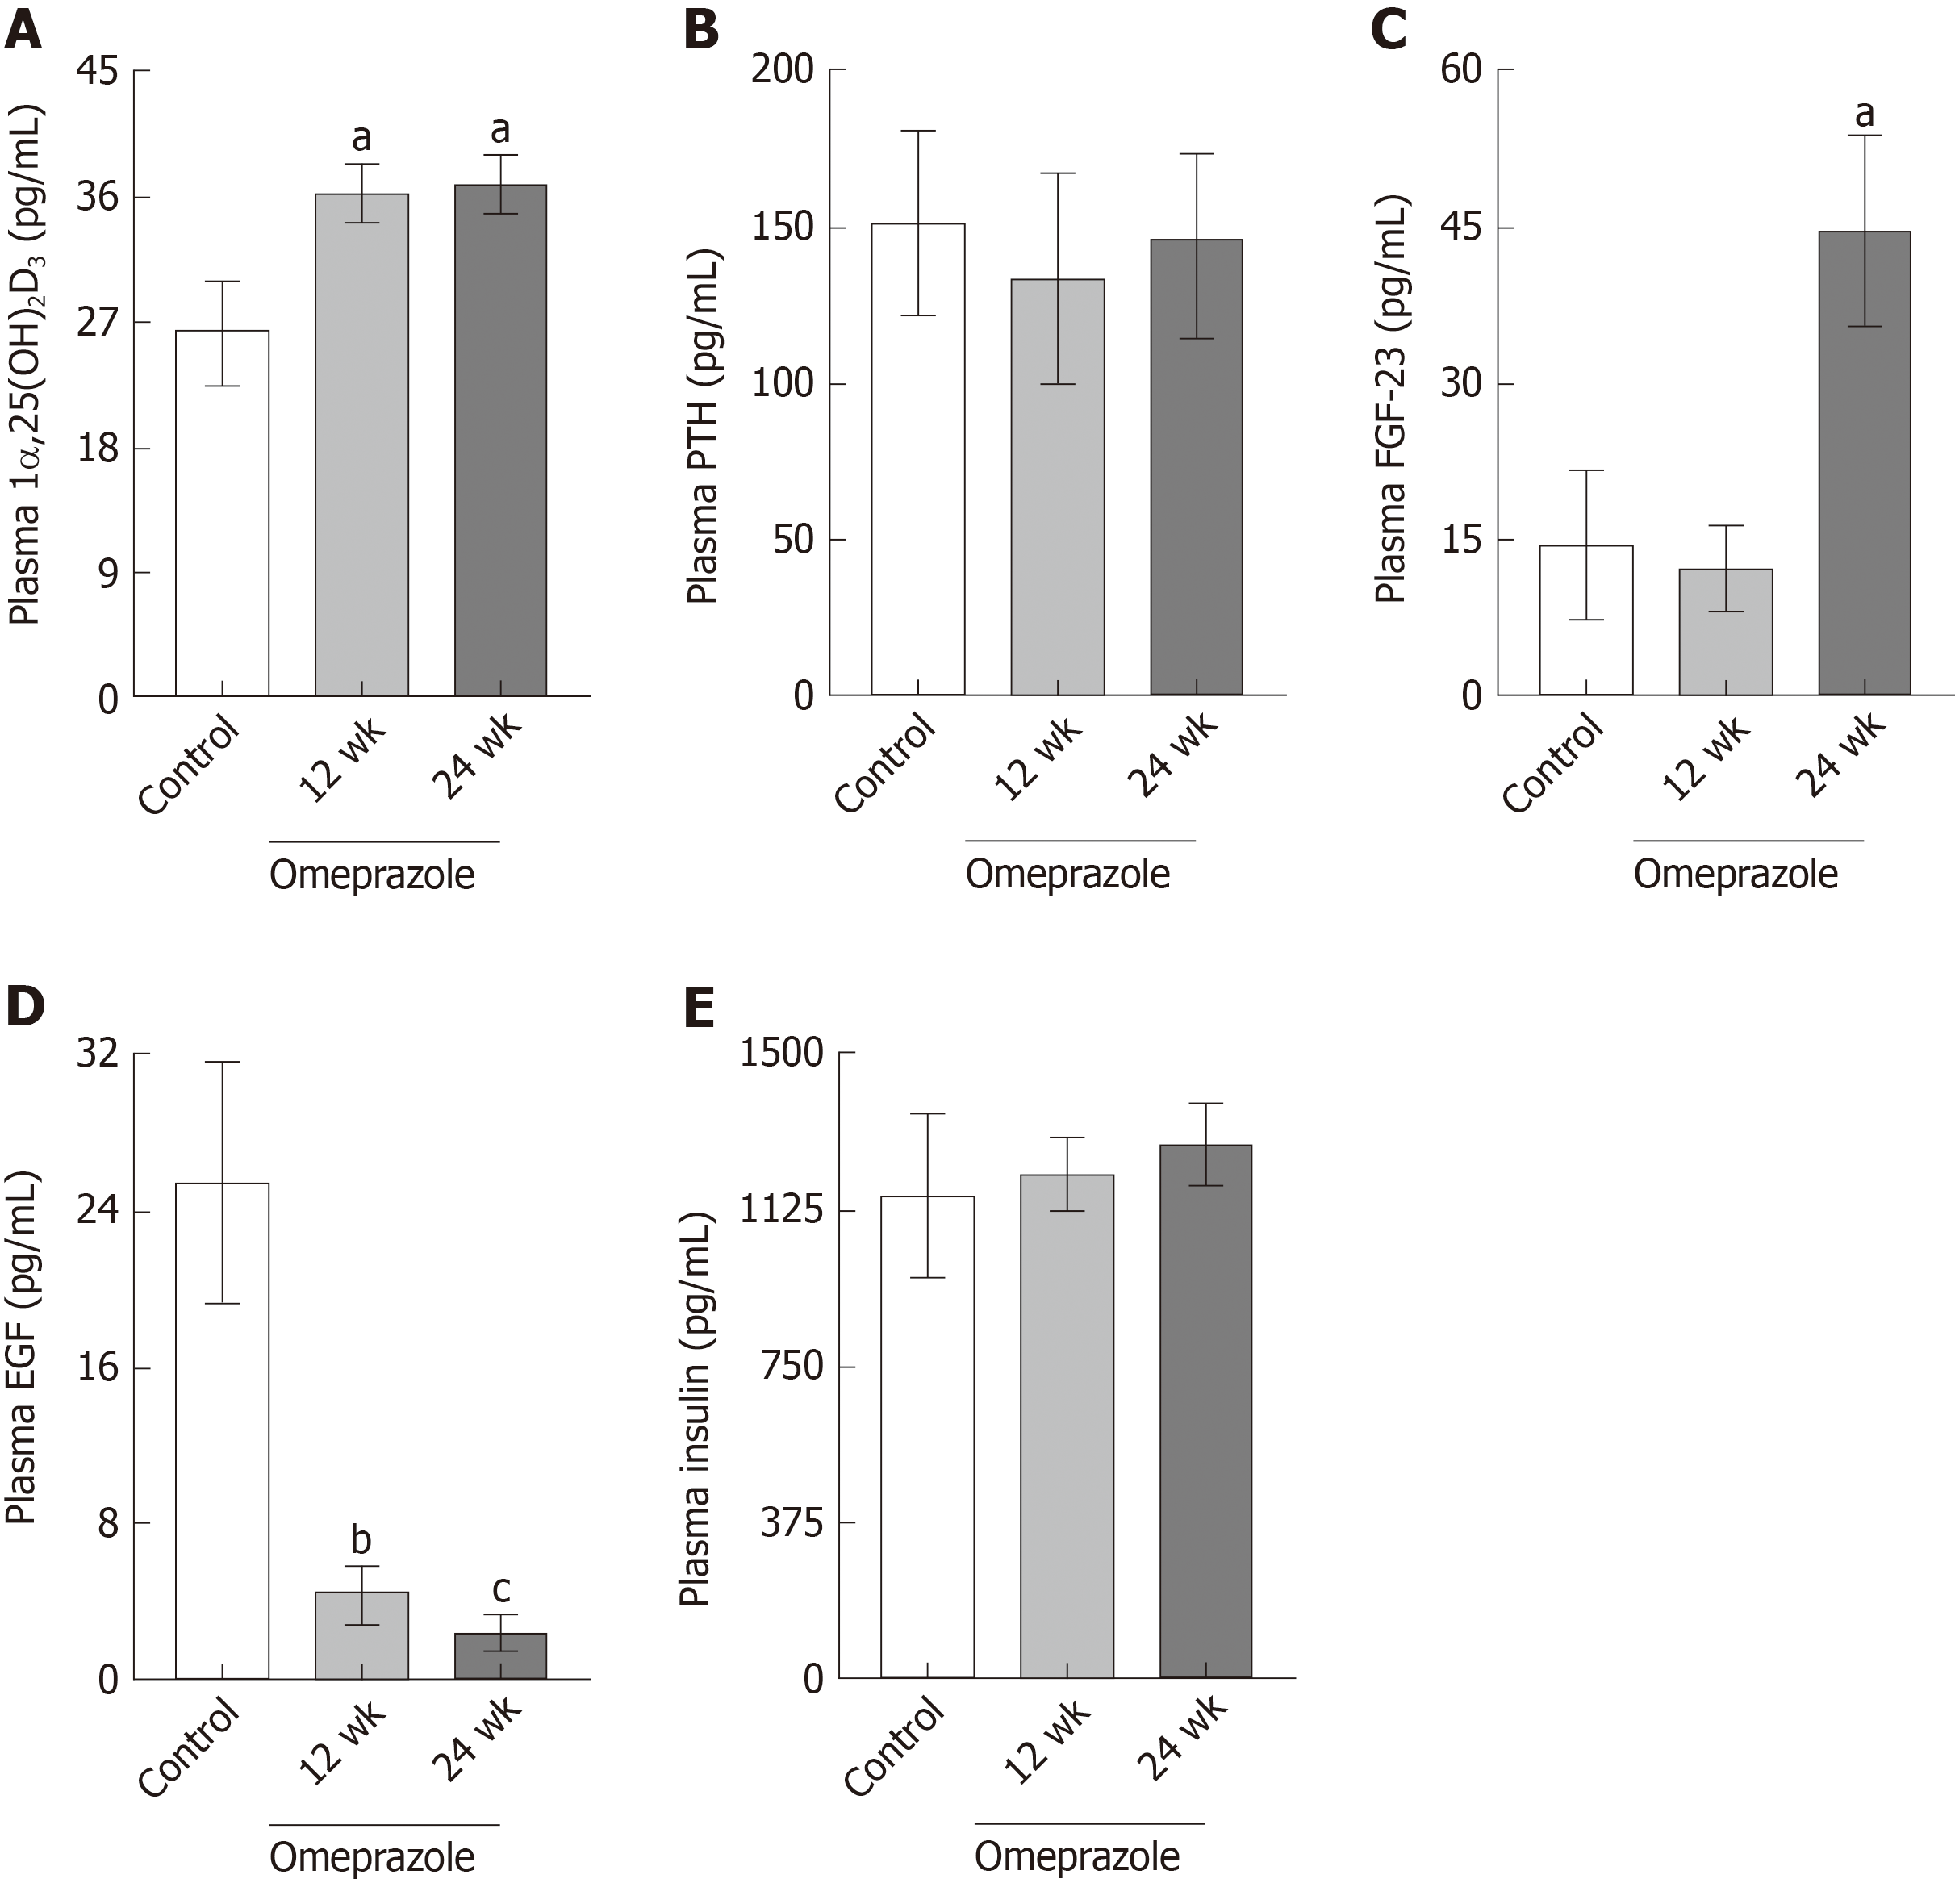
Figure 4 Effect of omeprazole on plasma 1α,25-dihydroxyvitamin D3, parathyroid hormone, fibroblast growth factor 23, epidermal growth factor, and insulin concentrations.
A: Plasma 1α,25-dihydroxyvitamin D3; B: Plasma parathyroid hormone; C: Plasma fibroblast growth factor 23; D: Plasma epidermal growth factor; E: Plasma insulin of control, 12 wk-omeprazole-treated, and 24 wk-omeprazole-treated groups. aP < 0.05, bP < 0.01, cP < 0.001, vs the control group (n = 6). 1α,25(OH)2D3: 1α,25-dihydroxyvitamin D3; PTH: Parathyroid hormone; FGF-23: Fibroblast growth factor 23; EGF: Epidermal growth factor.
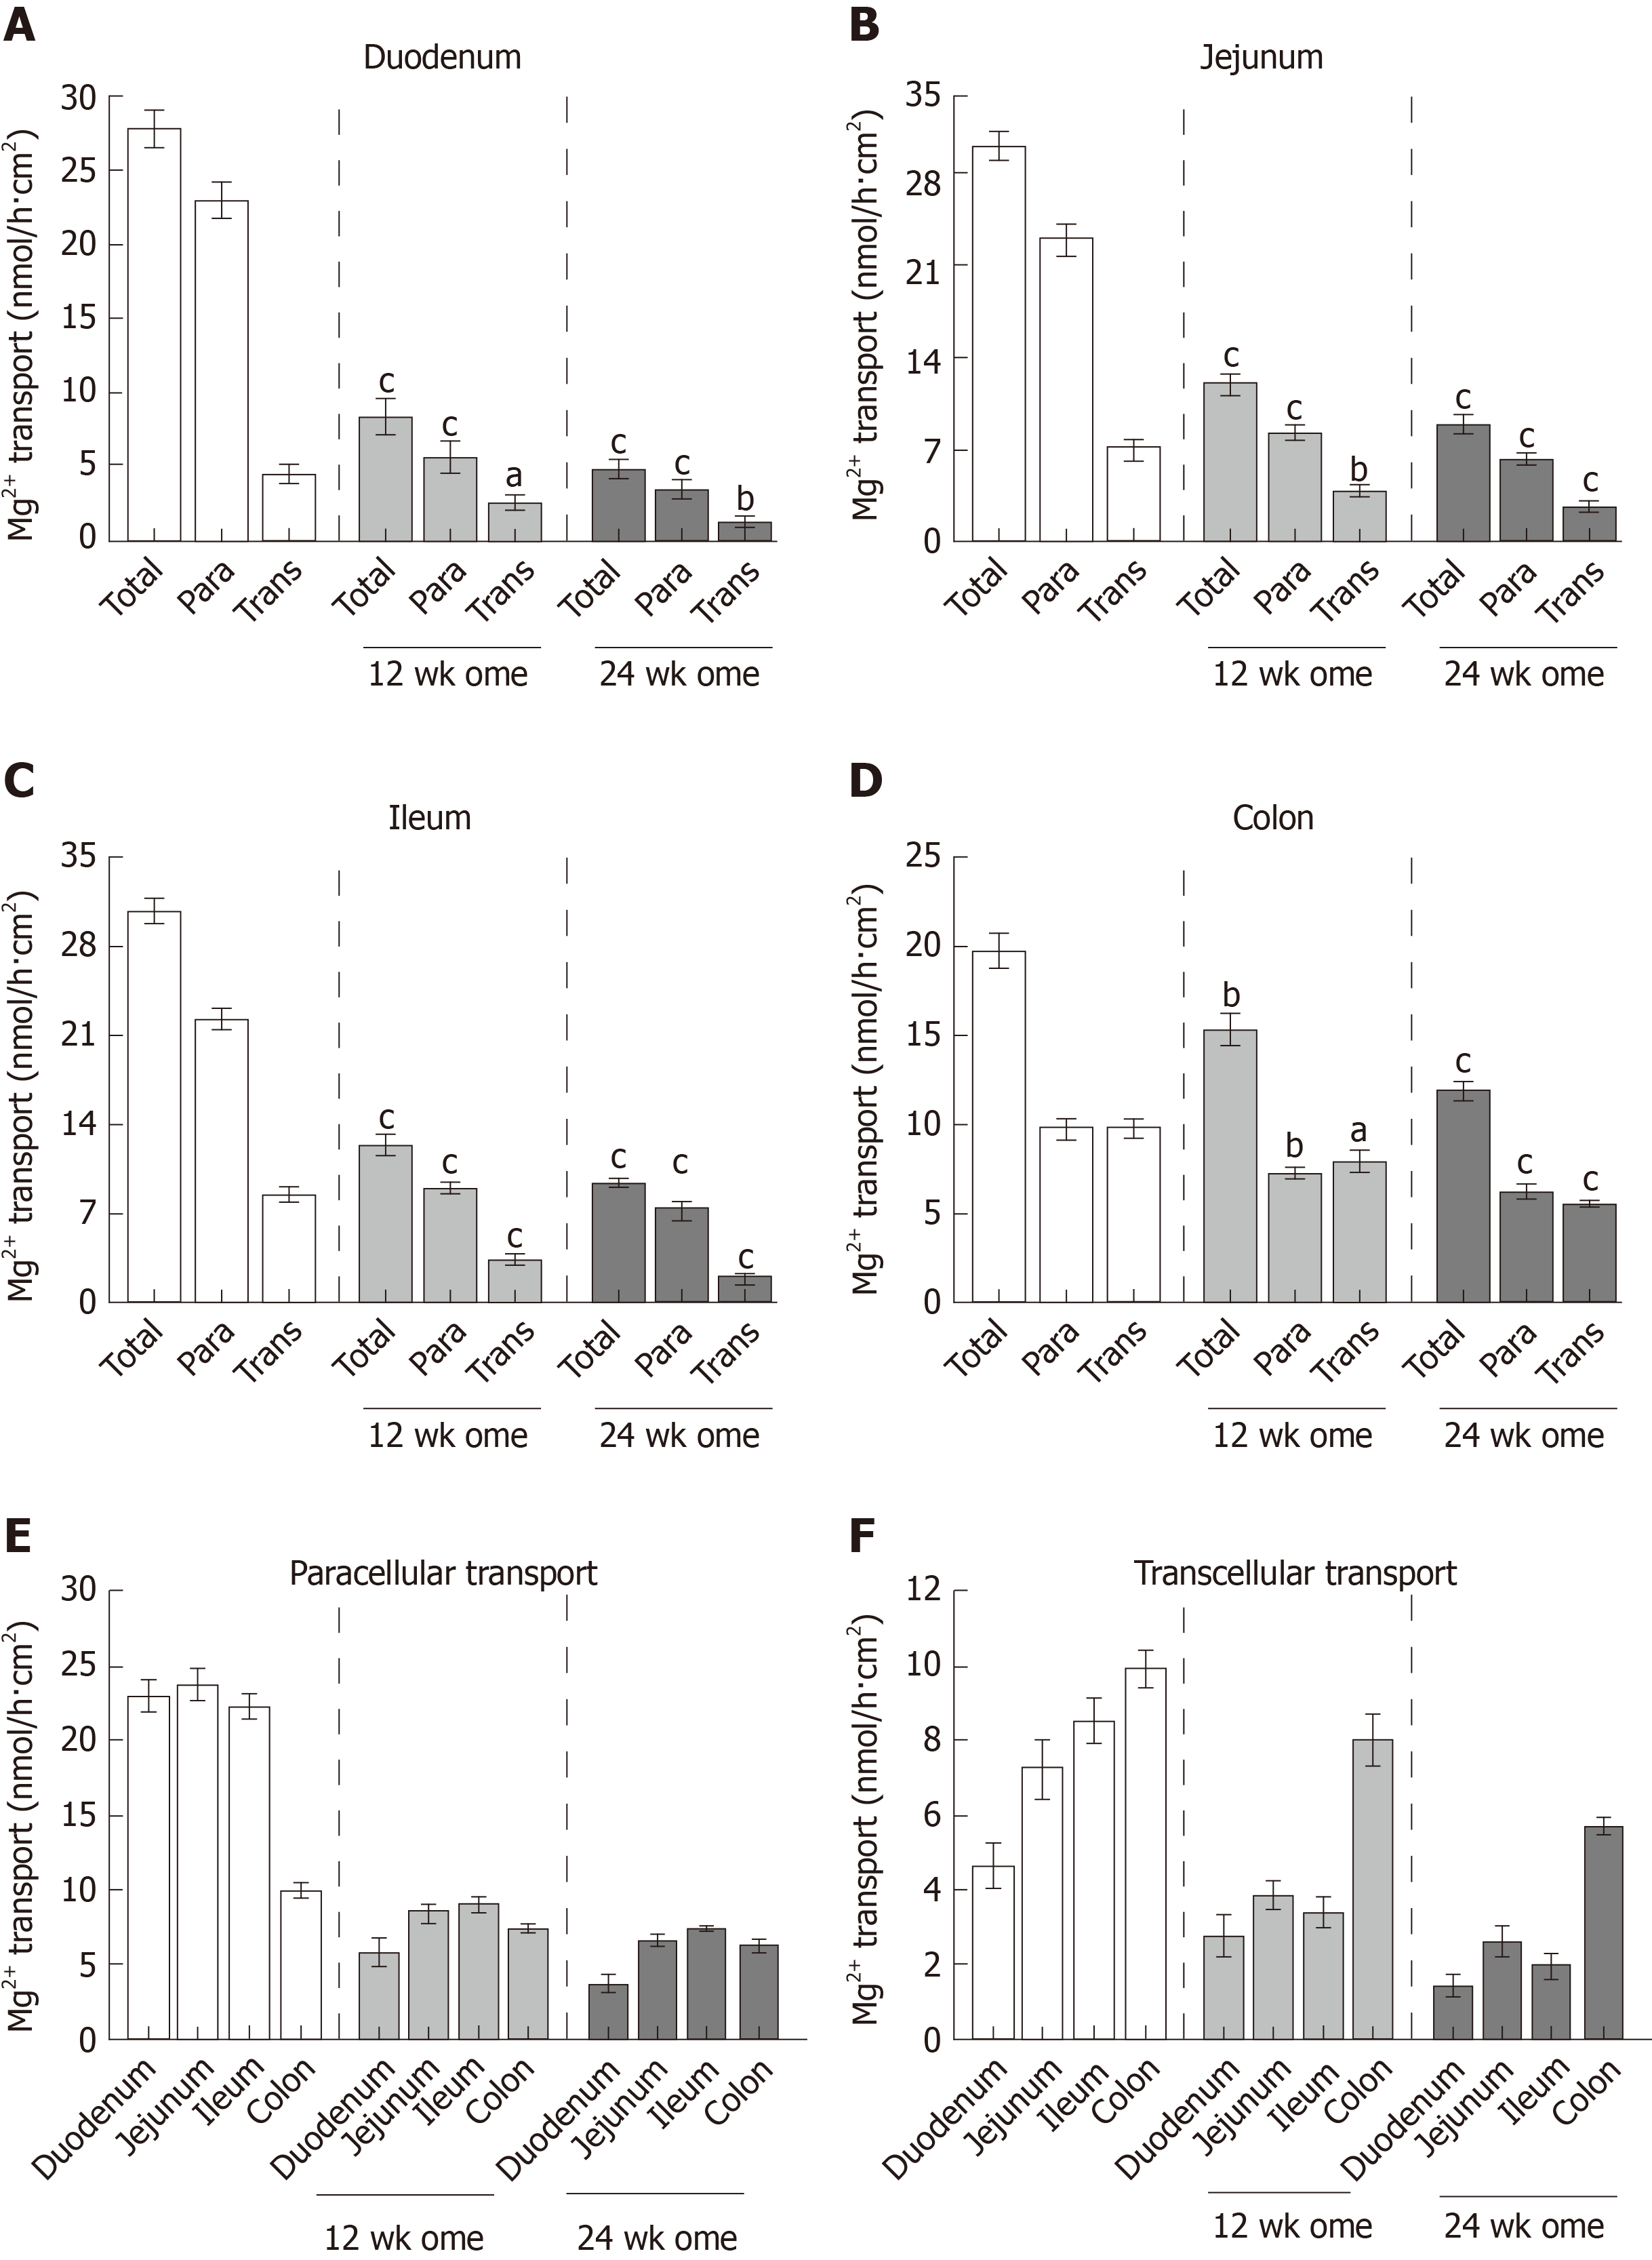
Figure 5 Effect of omeprazole on segmental intestinal Mg2+ absorption.
A-D: Rate of total, paracellular, and transcellular Mg2+ transport of control, 12 wk-omeprazole-treated, and 24 wk-omeprazole-treated groups (A: Duodenum; B: Jejunum; C: Ileum; D: Colon); E: the rate paracellular; F: transcellular Mg2+ transport of control, 12 wk-omeprazole-treated, and 24 wk-omeprazole-treated groups. aP < 0.05, bP < 0.01, cP < 0.001, vs the corresponding control group (n = 6). Para: Paracellular; Trans: transcellular.
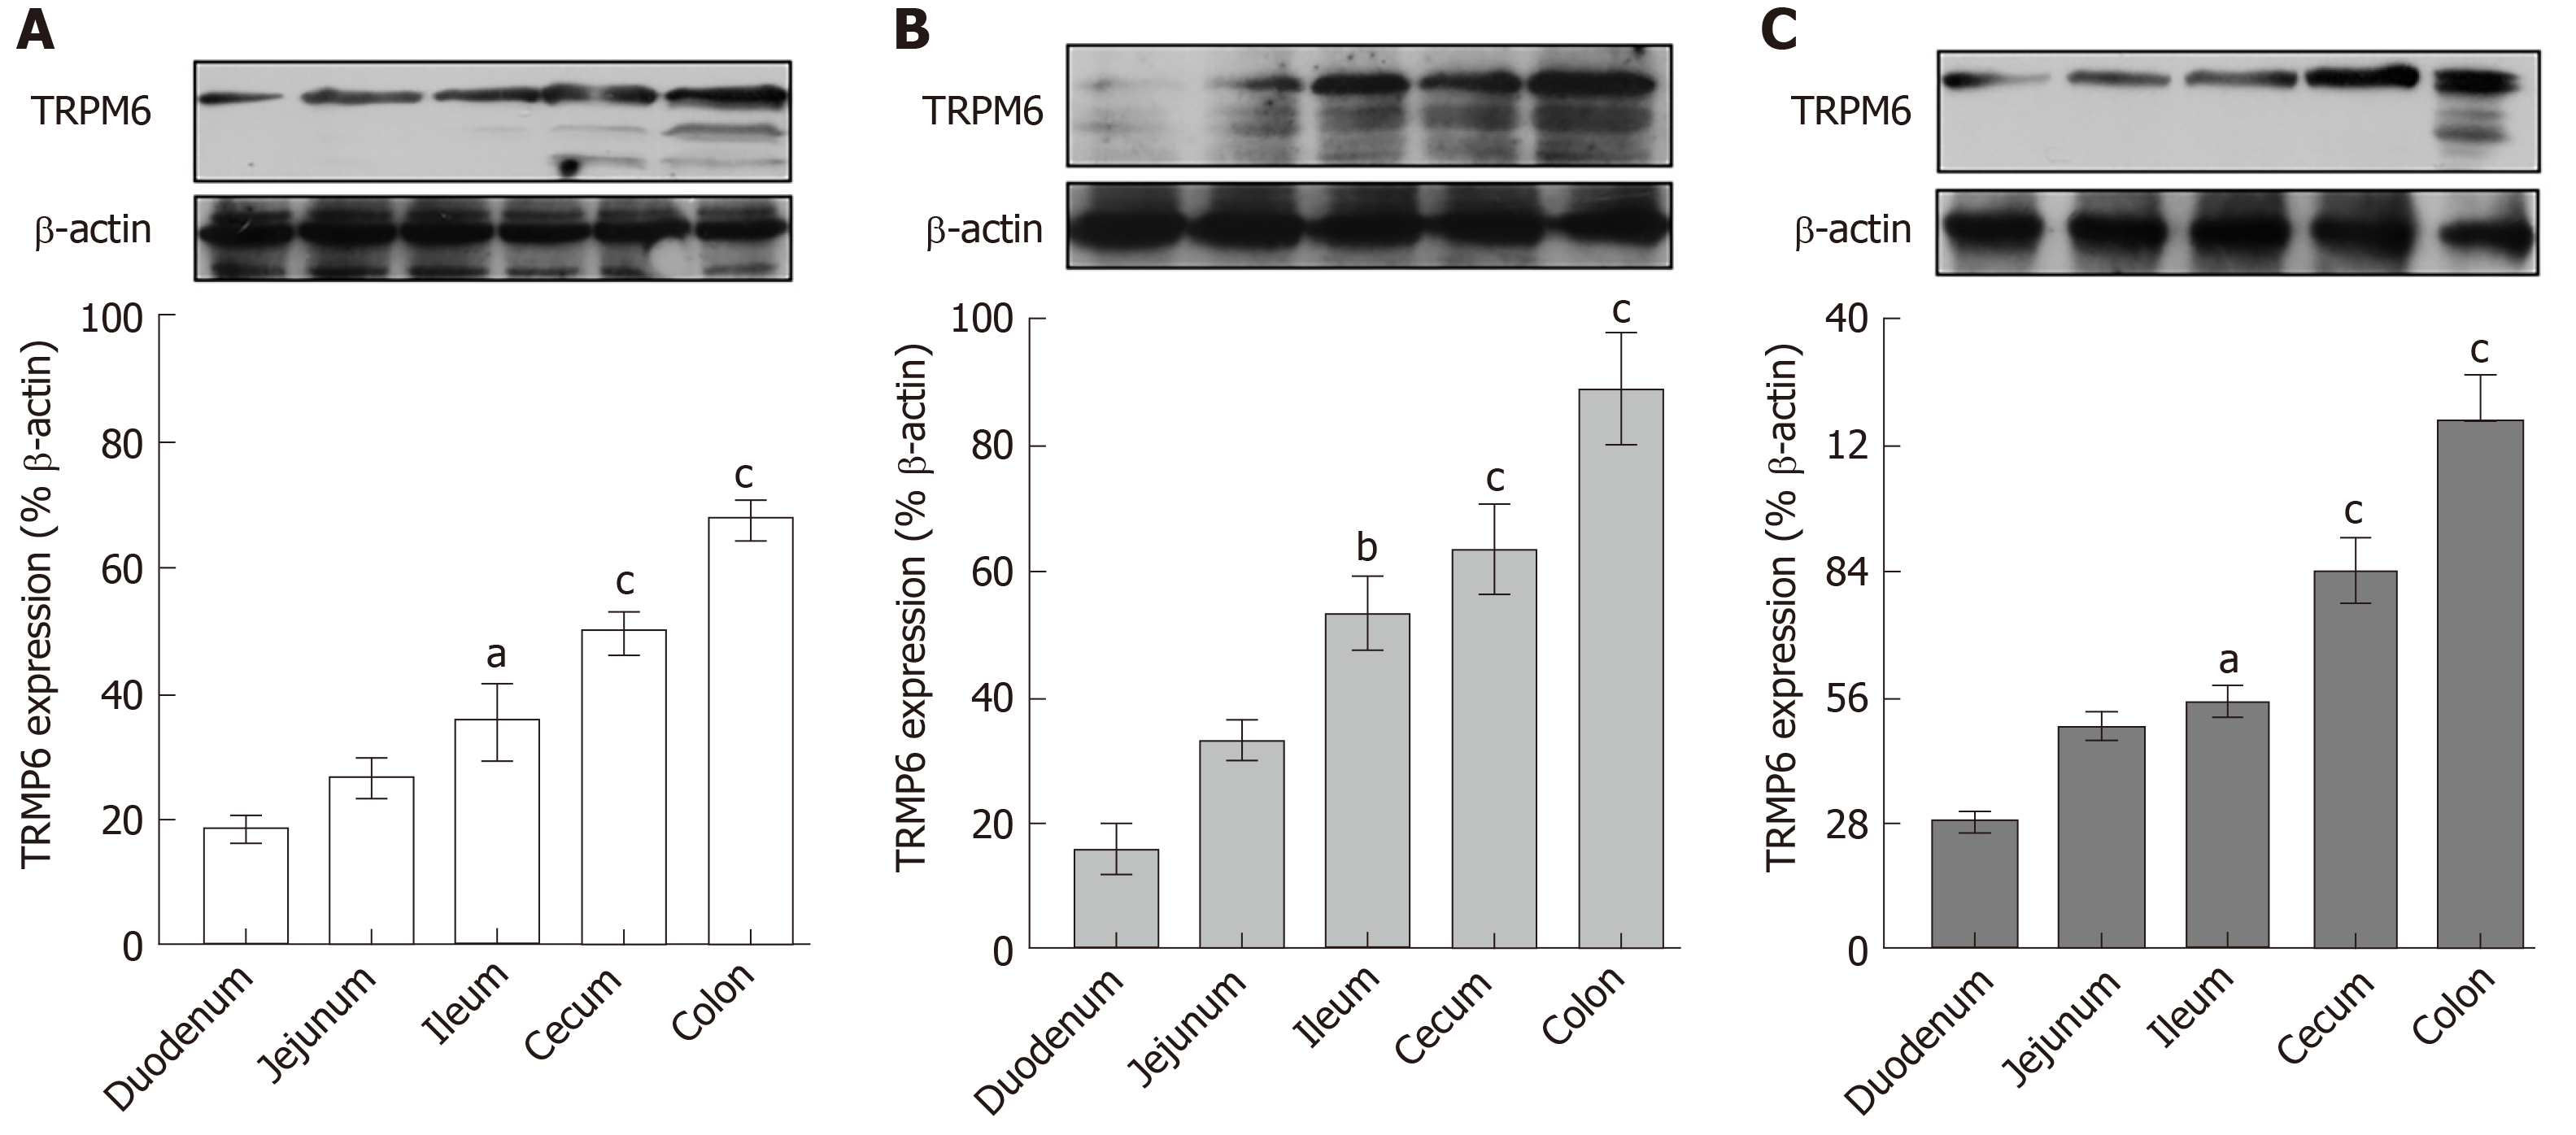
Figure 6 Transient receptor potential melastatin 6 expression in entire intestinal tract.
A: Control; B: 12 wk-omeprazole-treated; C: 24 wk-omeprazole-treated groups. The quantitative immunobloting analysis and representative densitometric analysis of transient receptor potential melastatin 6 expression in duodenum, jejunum, ileum, and colon. aP < 0.05, bP < 0.01, cP < 0.001, vs the corresponding duodenal segment (n = 6). TRPM6: Transient receptor potential melastatin 6.
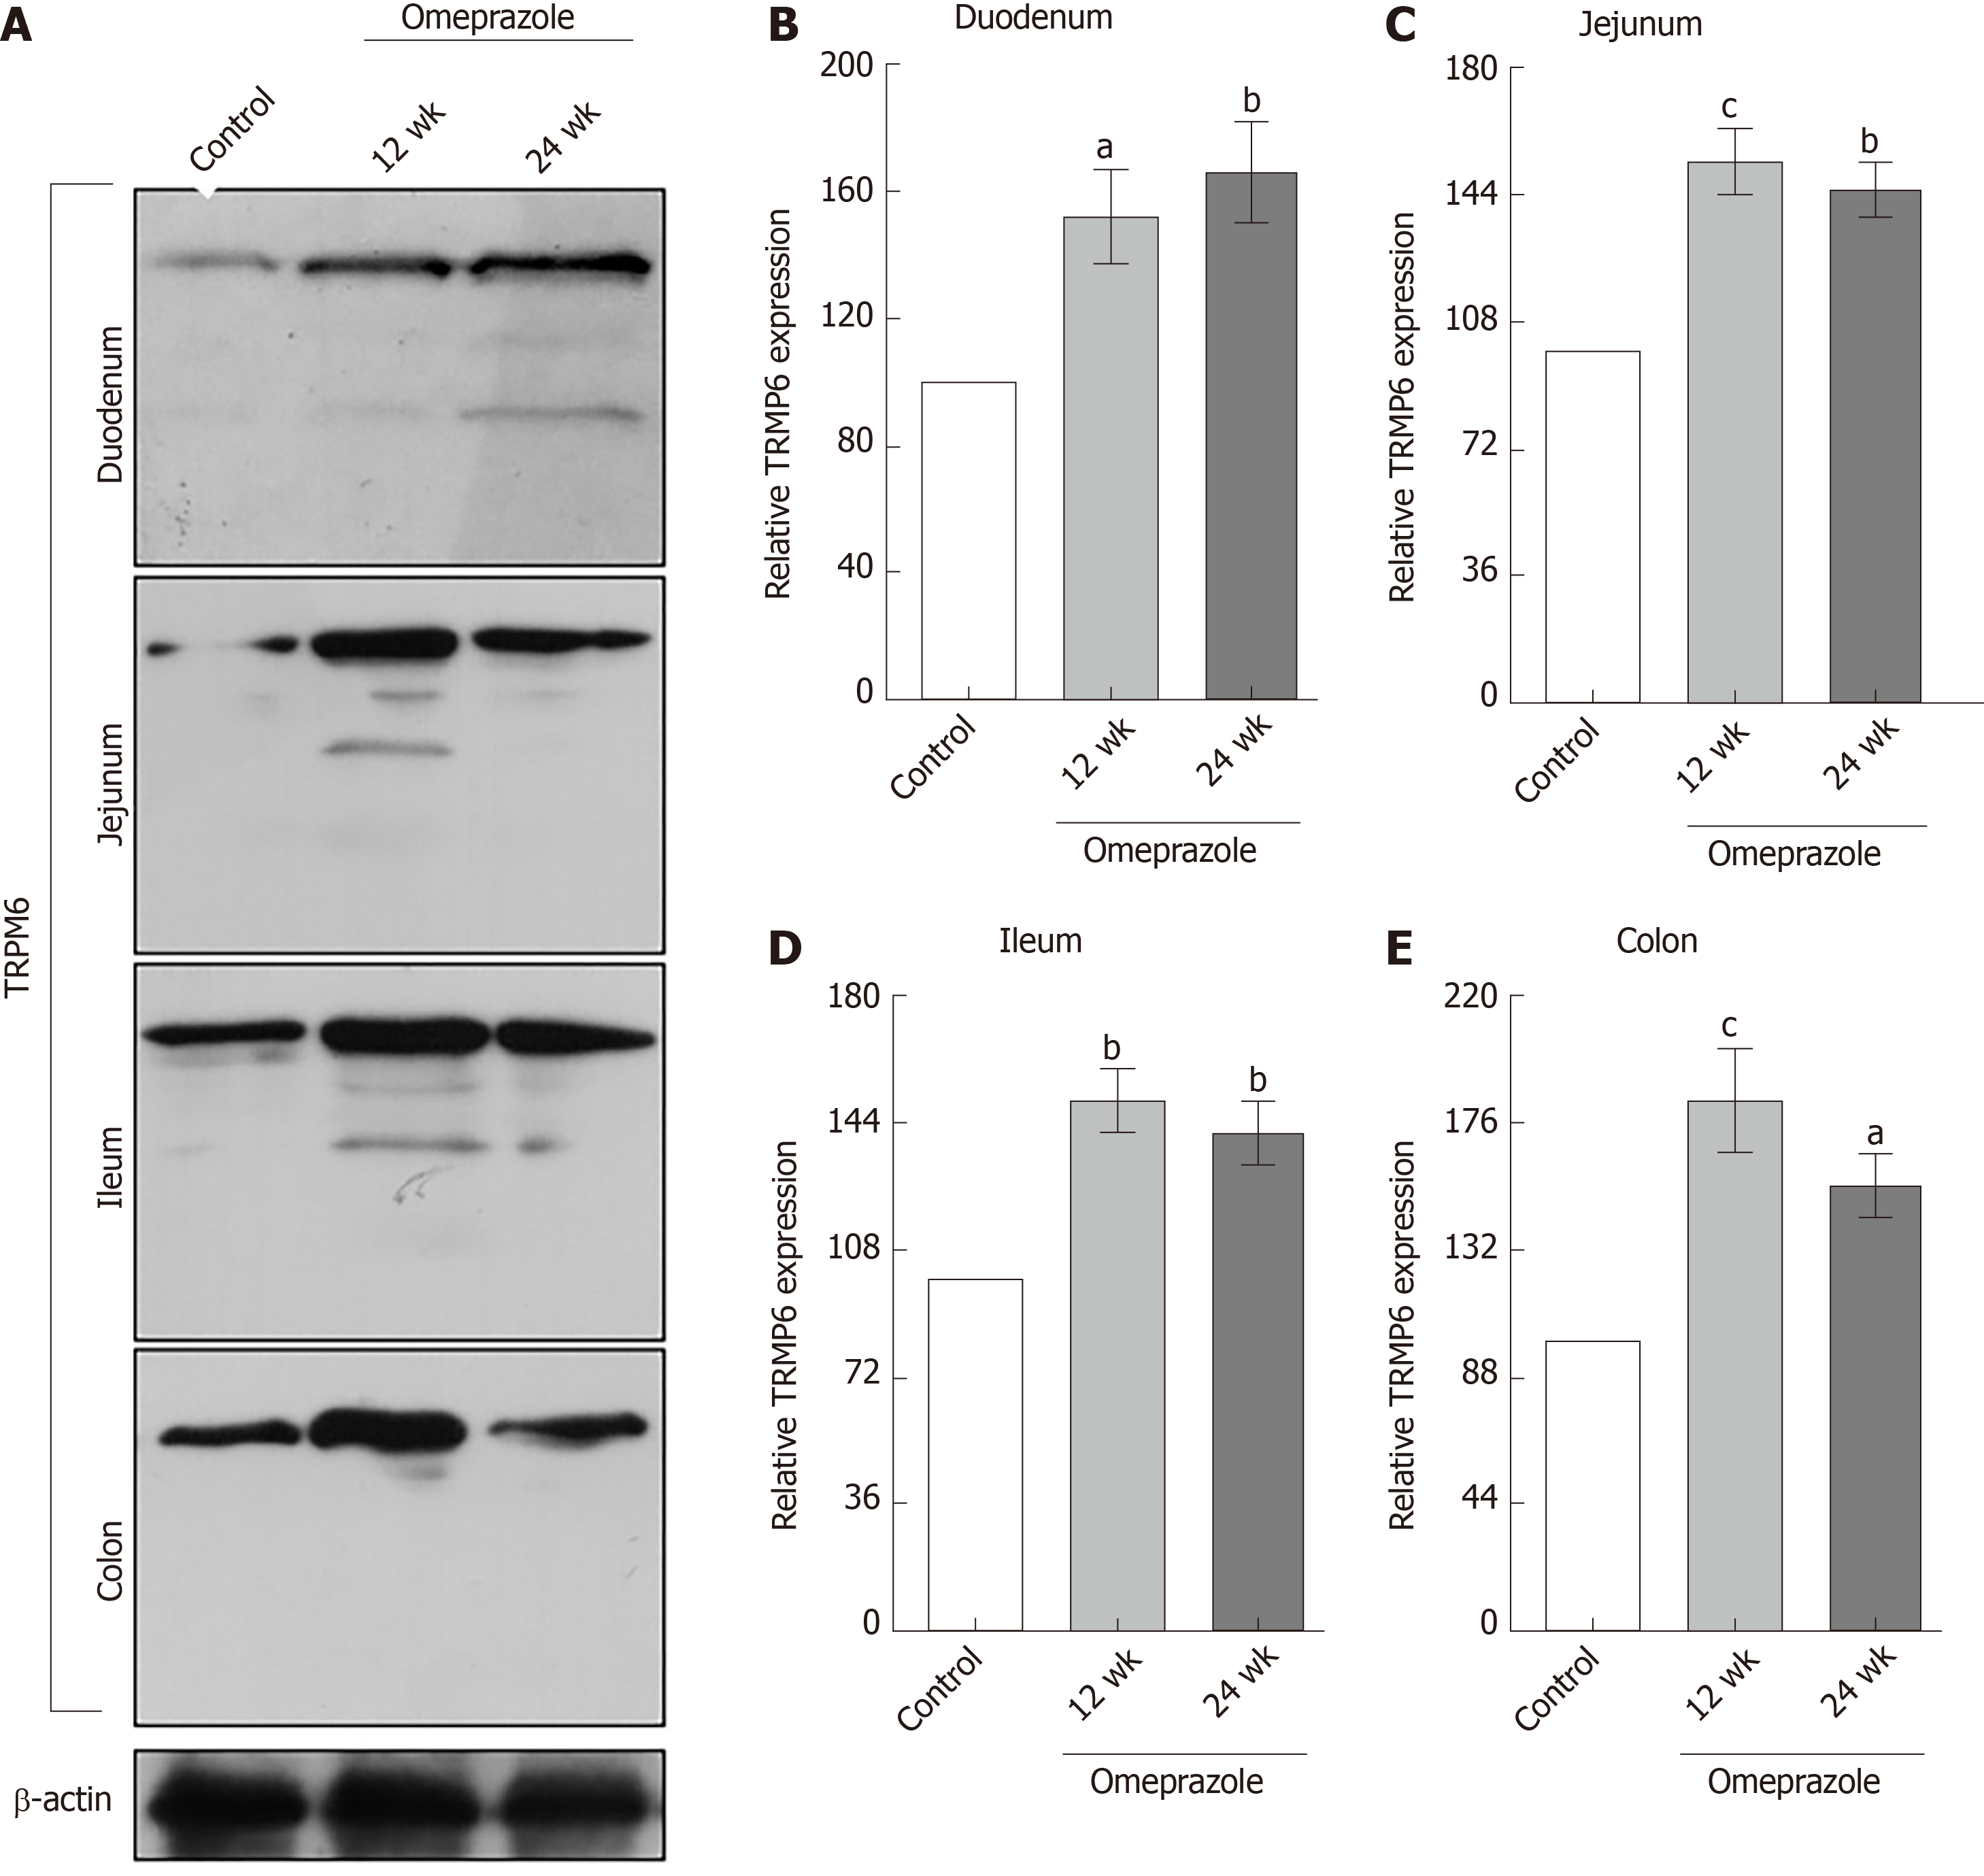
Figure 7 The effect of omeprazole on transient receptor potential melastatin 6 expression in entire intestinal tract.
A: Quantitative immunobloting analysis of transient receptor potential melastatin 6 expression in duodenum, jejunum, ileum, and colon. B: Duodenum; C: Jejunum; D: Ileum; E: Colon. Representative densitometric analysis of transient receptor potential melastatin 6 expression in duodenum, jejunum, ileum, and colon of control, 12 wk-omeprazole-treated, and 24 wk-omeprazole-treated groups. aP < 0.05, bP < 0.01, cP < 0.001, vs its corresponding vehicle-treated group (n = 5). TRPM6: Transient receptor potential melastatin 6.
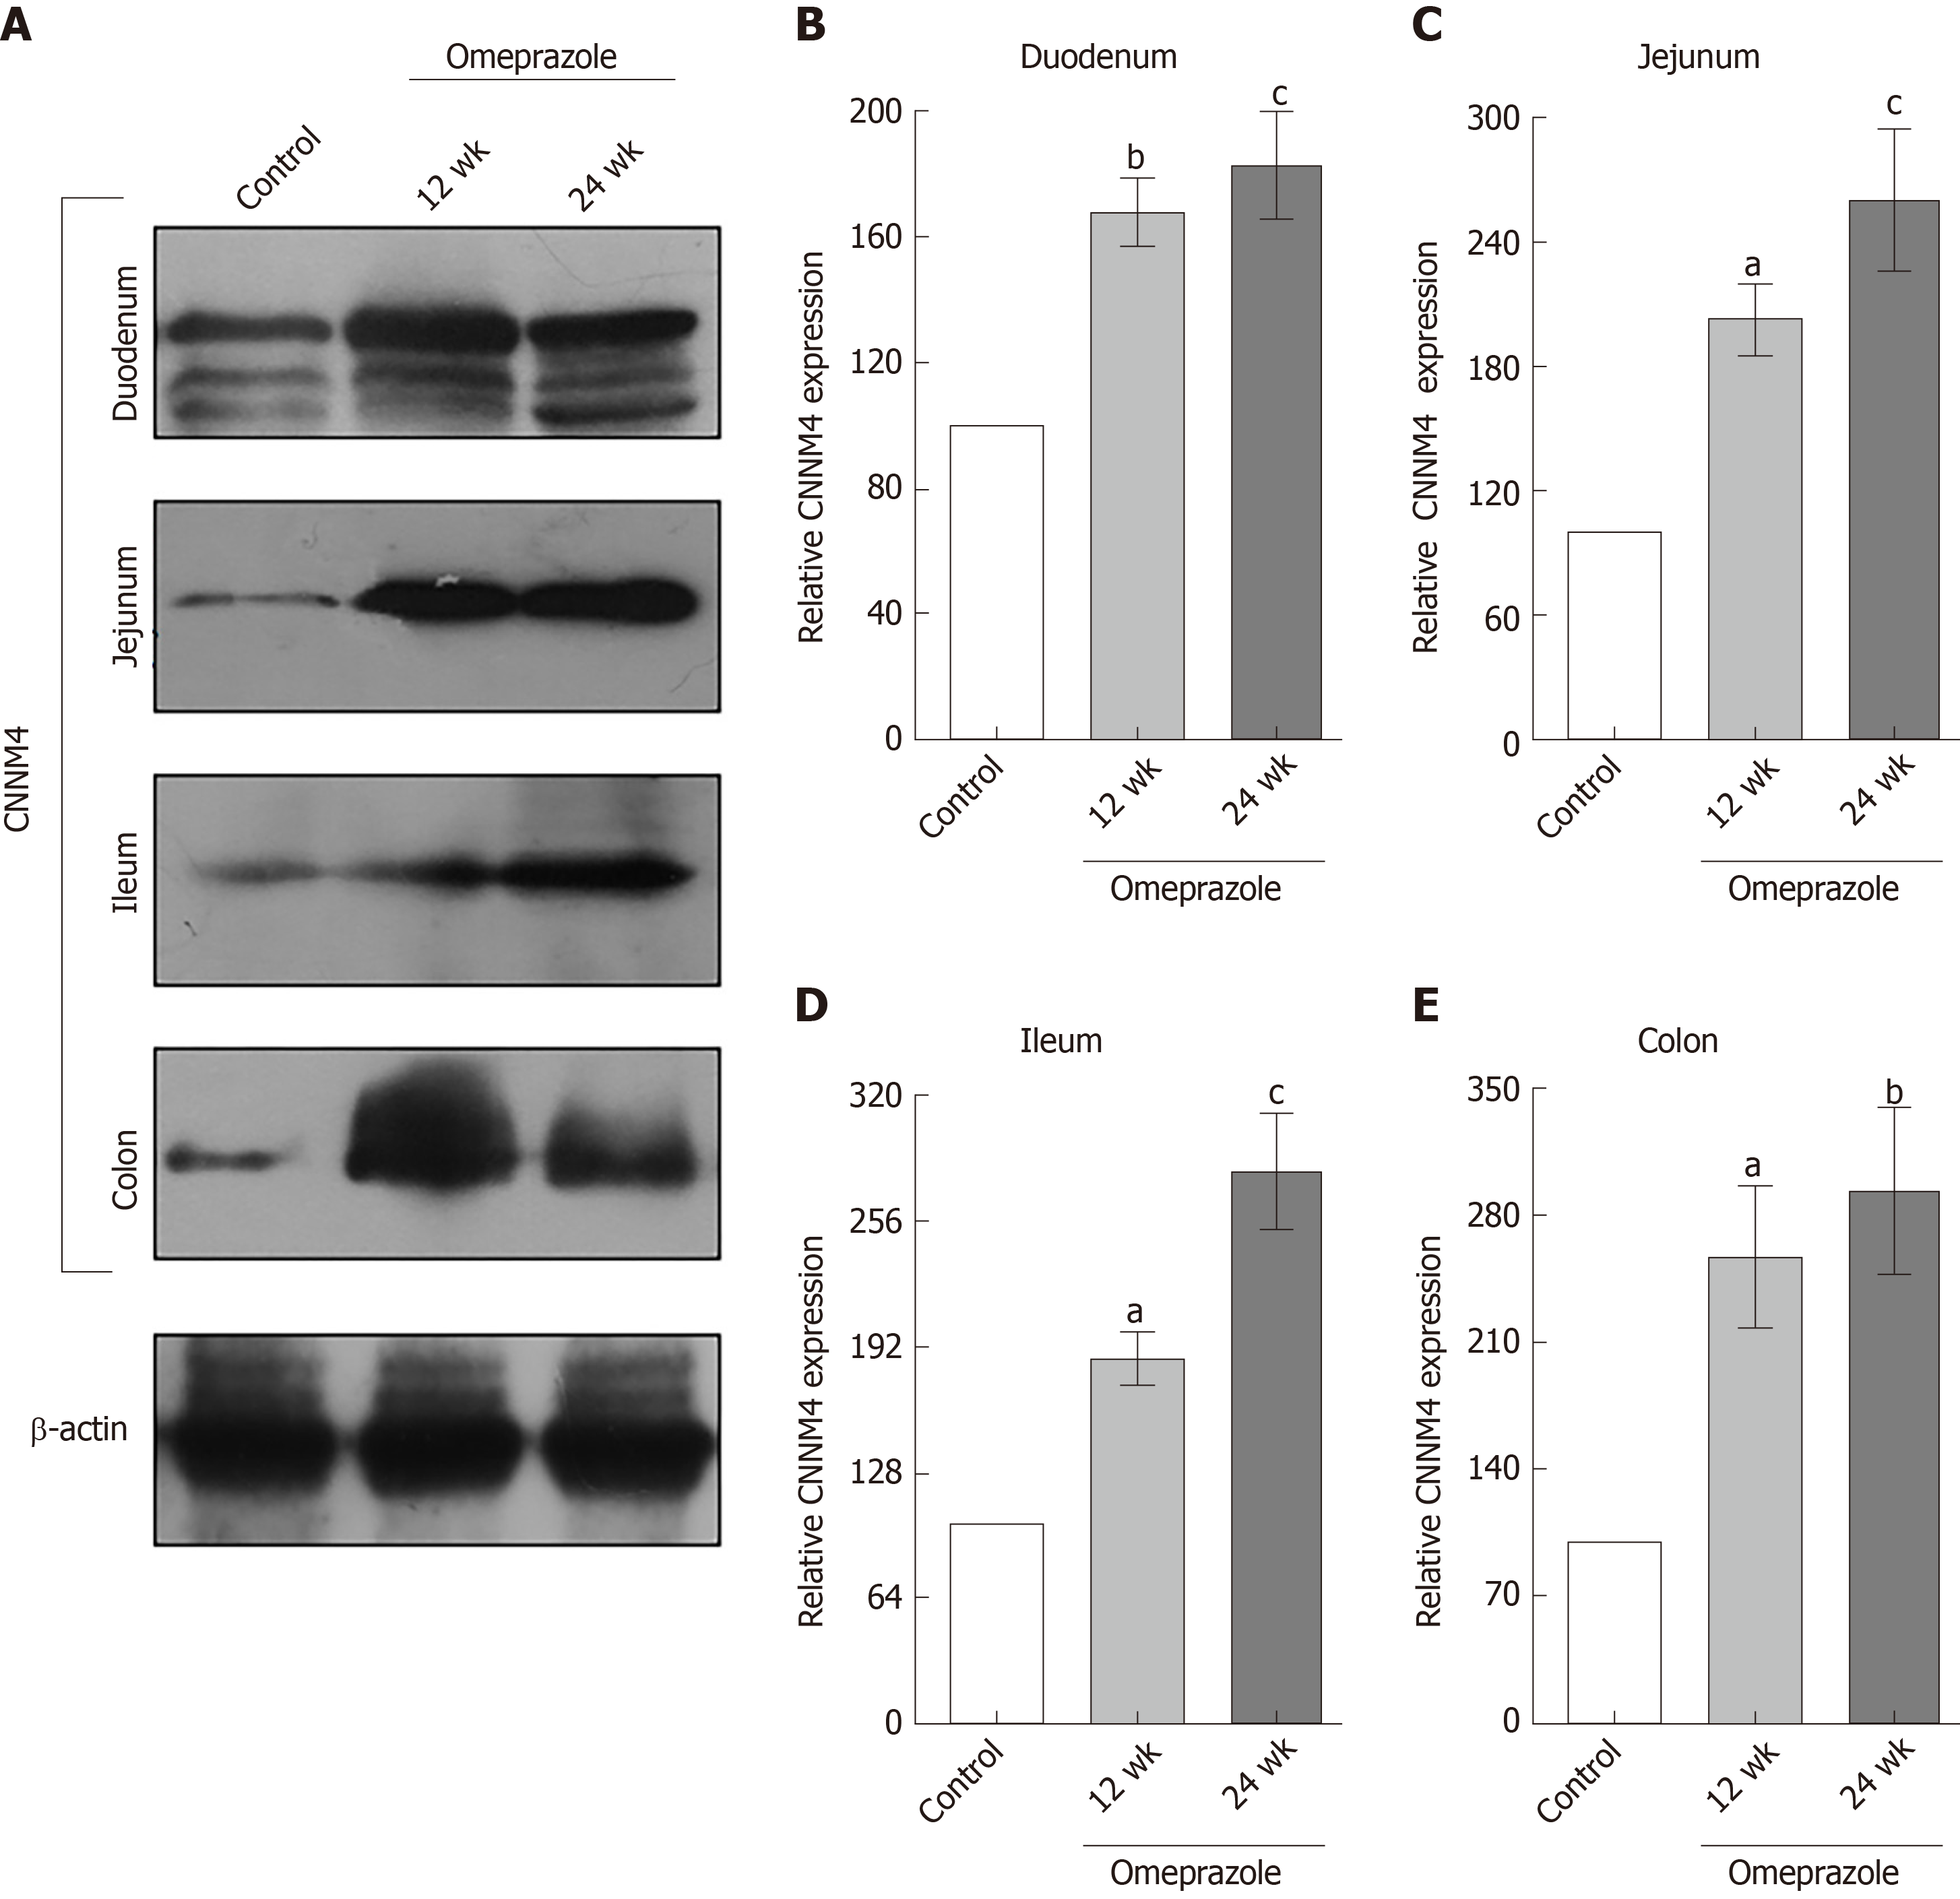
Figure 8 The effect of omeprazole on cyclin M4 expression in entire intestinal tract.
A: Quantitative immunobloting analysis of cyclin M4 expression in duodenum, jejunum, ileum, and colon; B: Duodenum; C: Jejunum; D: Ileum; E: Colon. Representative densitometric analysis of cyclin M4 expression in duodenum, jejunum, ileum, and colon of control, 12 wk-omeprazole-treated, and 24 wk-omeprazole-treated groups. aP < 0.05, bP < 0.01, cP < 0.001, vs its corresponding vehicle-treated group (n = 5). CNNM4: Cyclin M4.
- Citation: Suksridechacin N, Kulwong P, Chamniansawat S, Thongon N. Effect of prolonged omeprazole administration on segmental intestinal Mg2+ absorption in male Sprague-Dawley rats. World J Gastroenterol 2020; 26(11): 1142-1155
- URL: https://www.wjgnet.com/1007-9327/full/v26/i11/1142.htm
- DOI: https://dx.doi.org/10.3748/wjg.v26.i11.1142


