Copyright
©The Author(s) 2020.
World J Gastroenterol. Mar 14, 2020; 26(10): 1042-1055
Published online Mar 14, 2020. doi: 10.3748/wjg.v26.i10.1042
Published online Mar 14, 2020. doi: 10.3748/wjg.v26.i10.1042
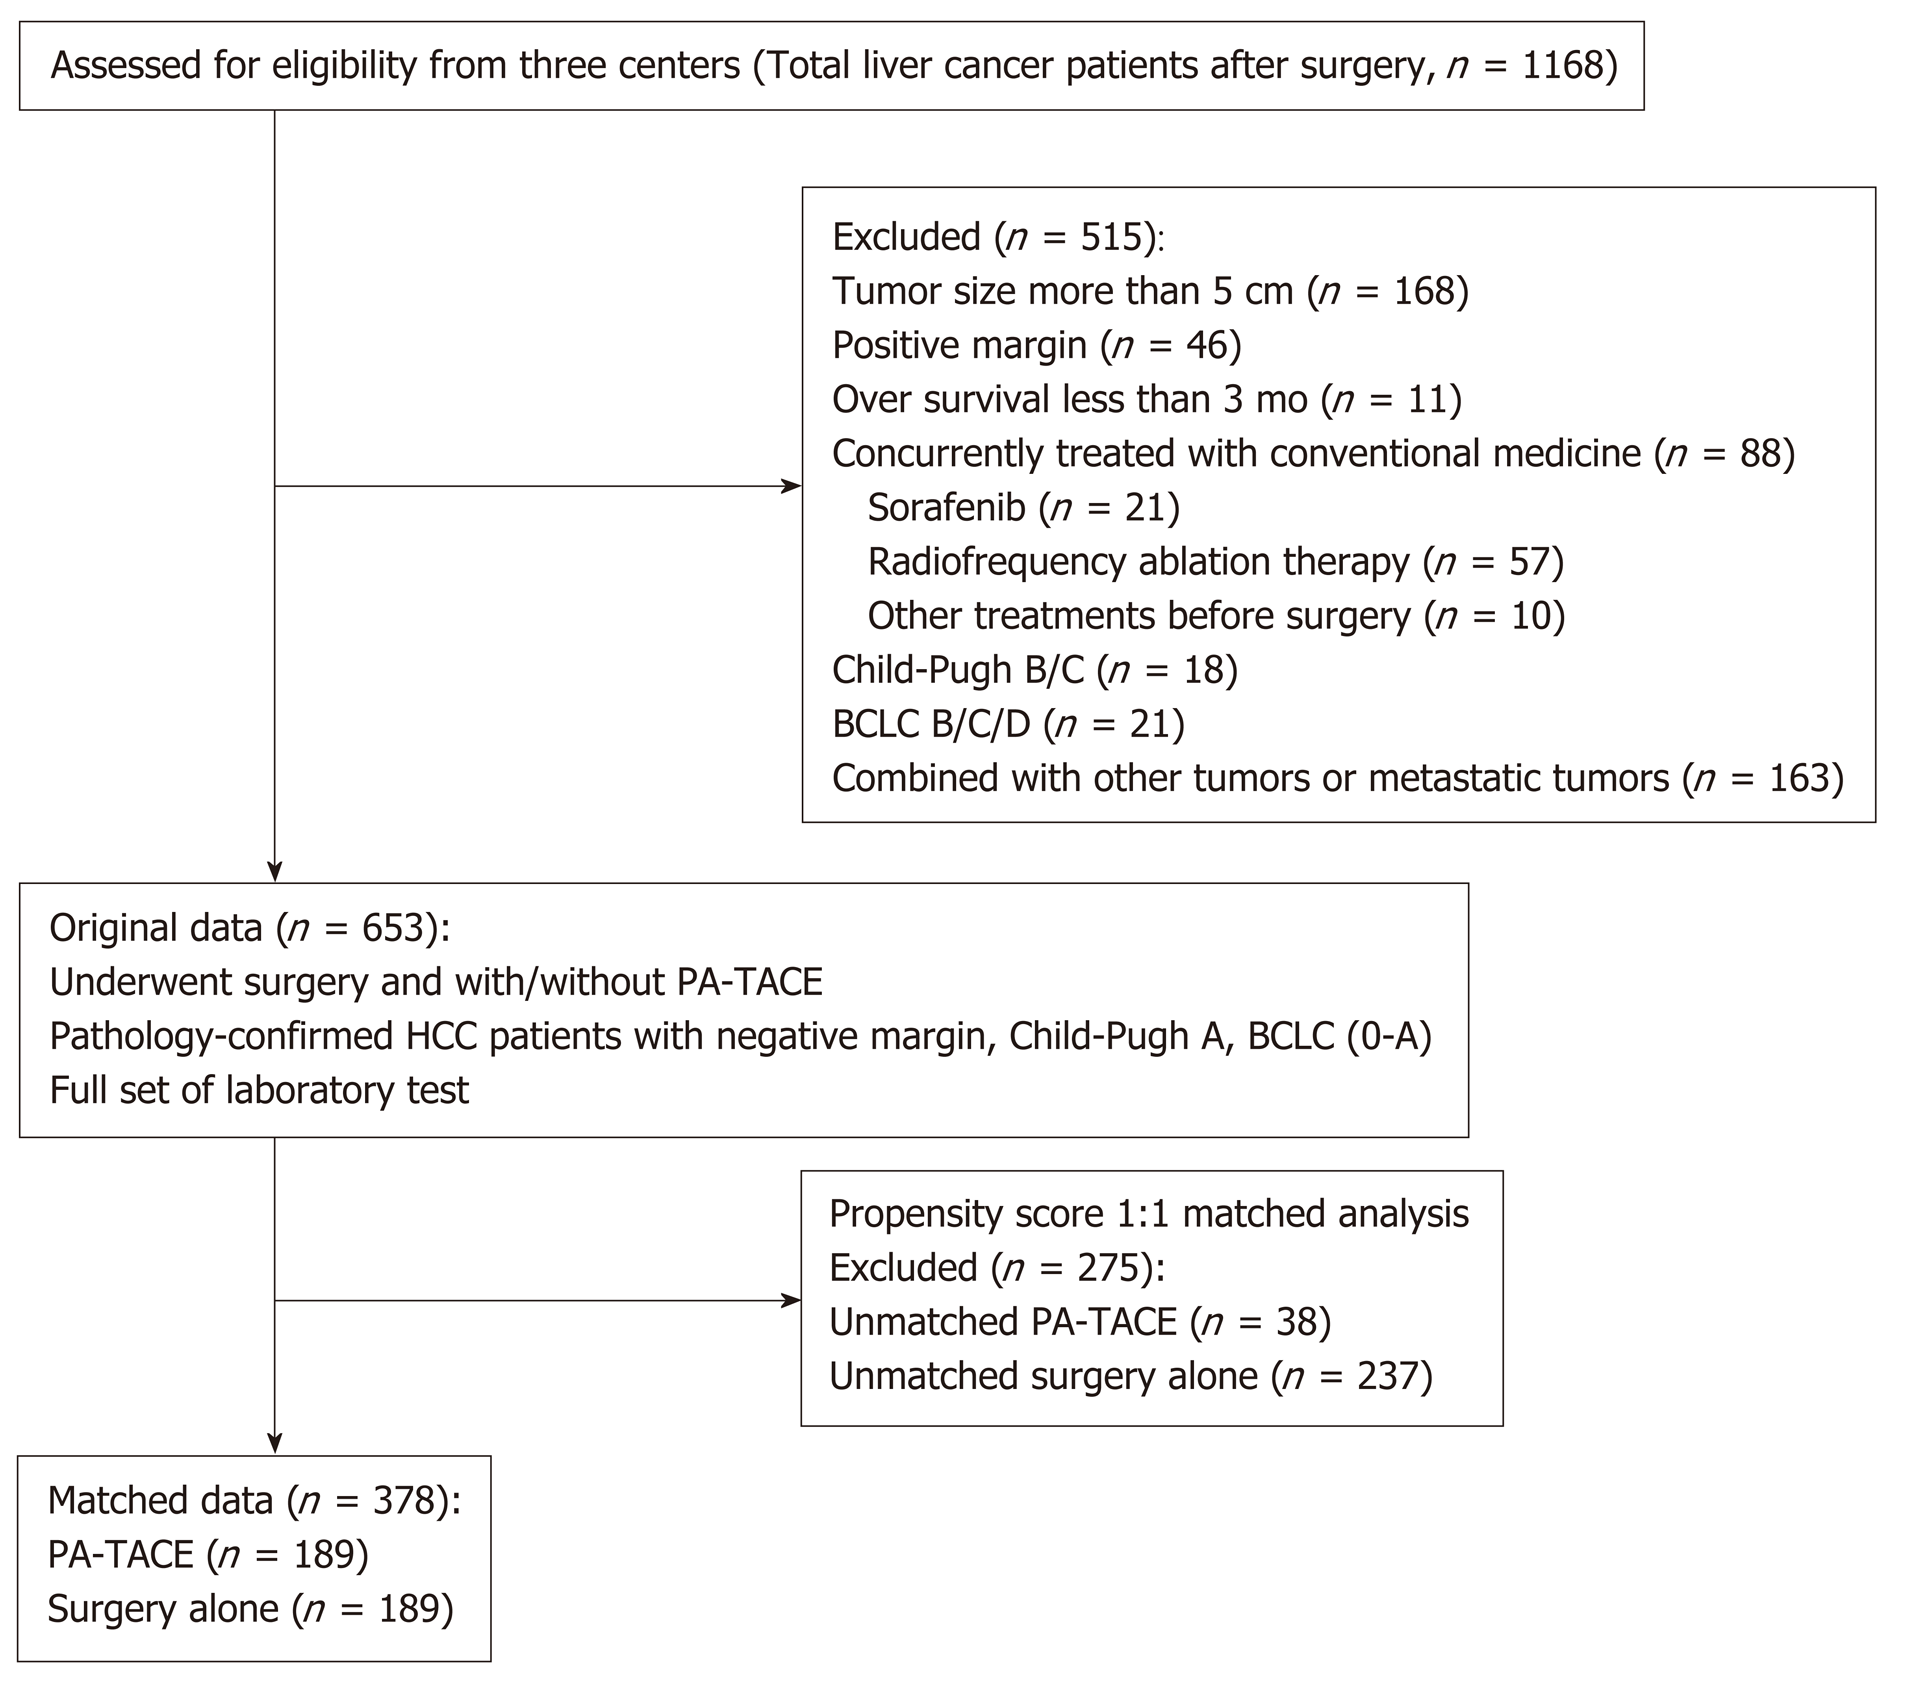
Figure 1 Flow diagram of the enrolled patients.
BCLC: Barcelona Clinic Liver Cancer; HCC: Hepatocellular carcinoma; PA-TACE: Postoperative adjuvant transcatheter arterial chemoembolization.
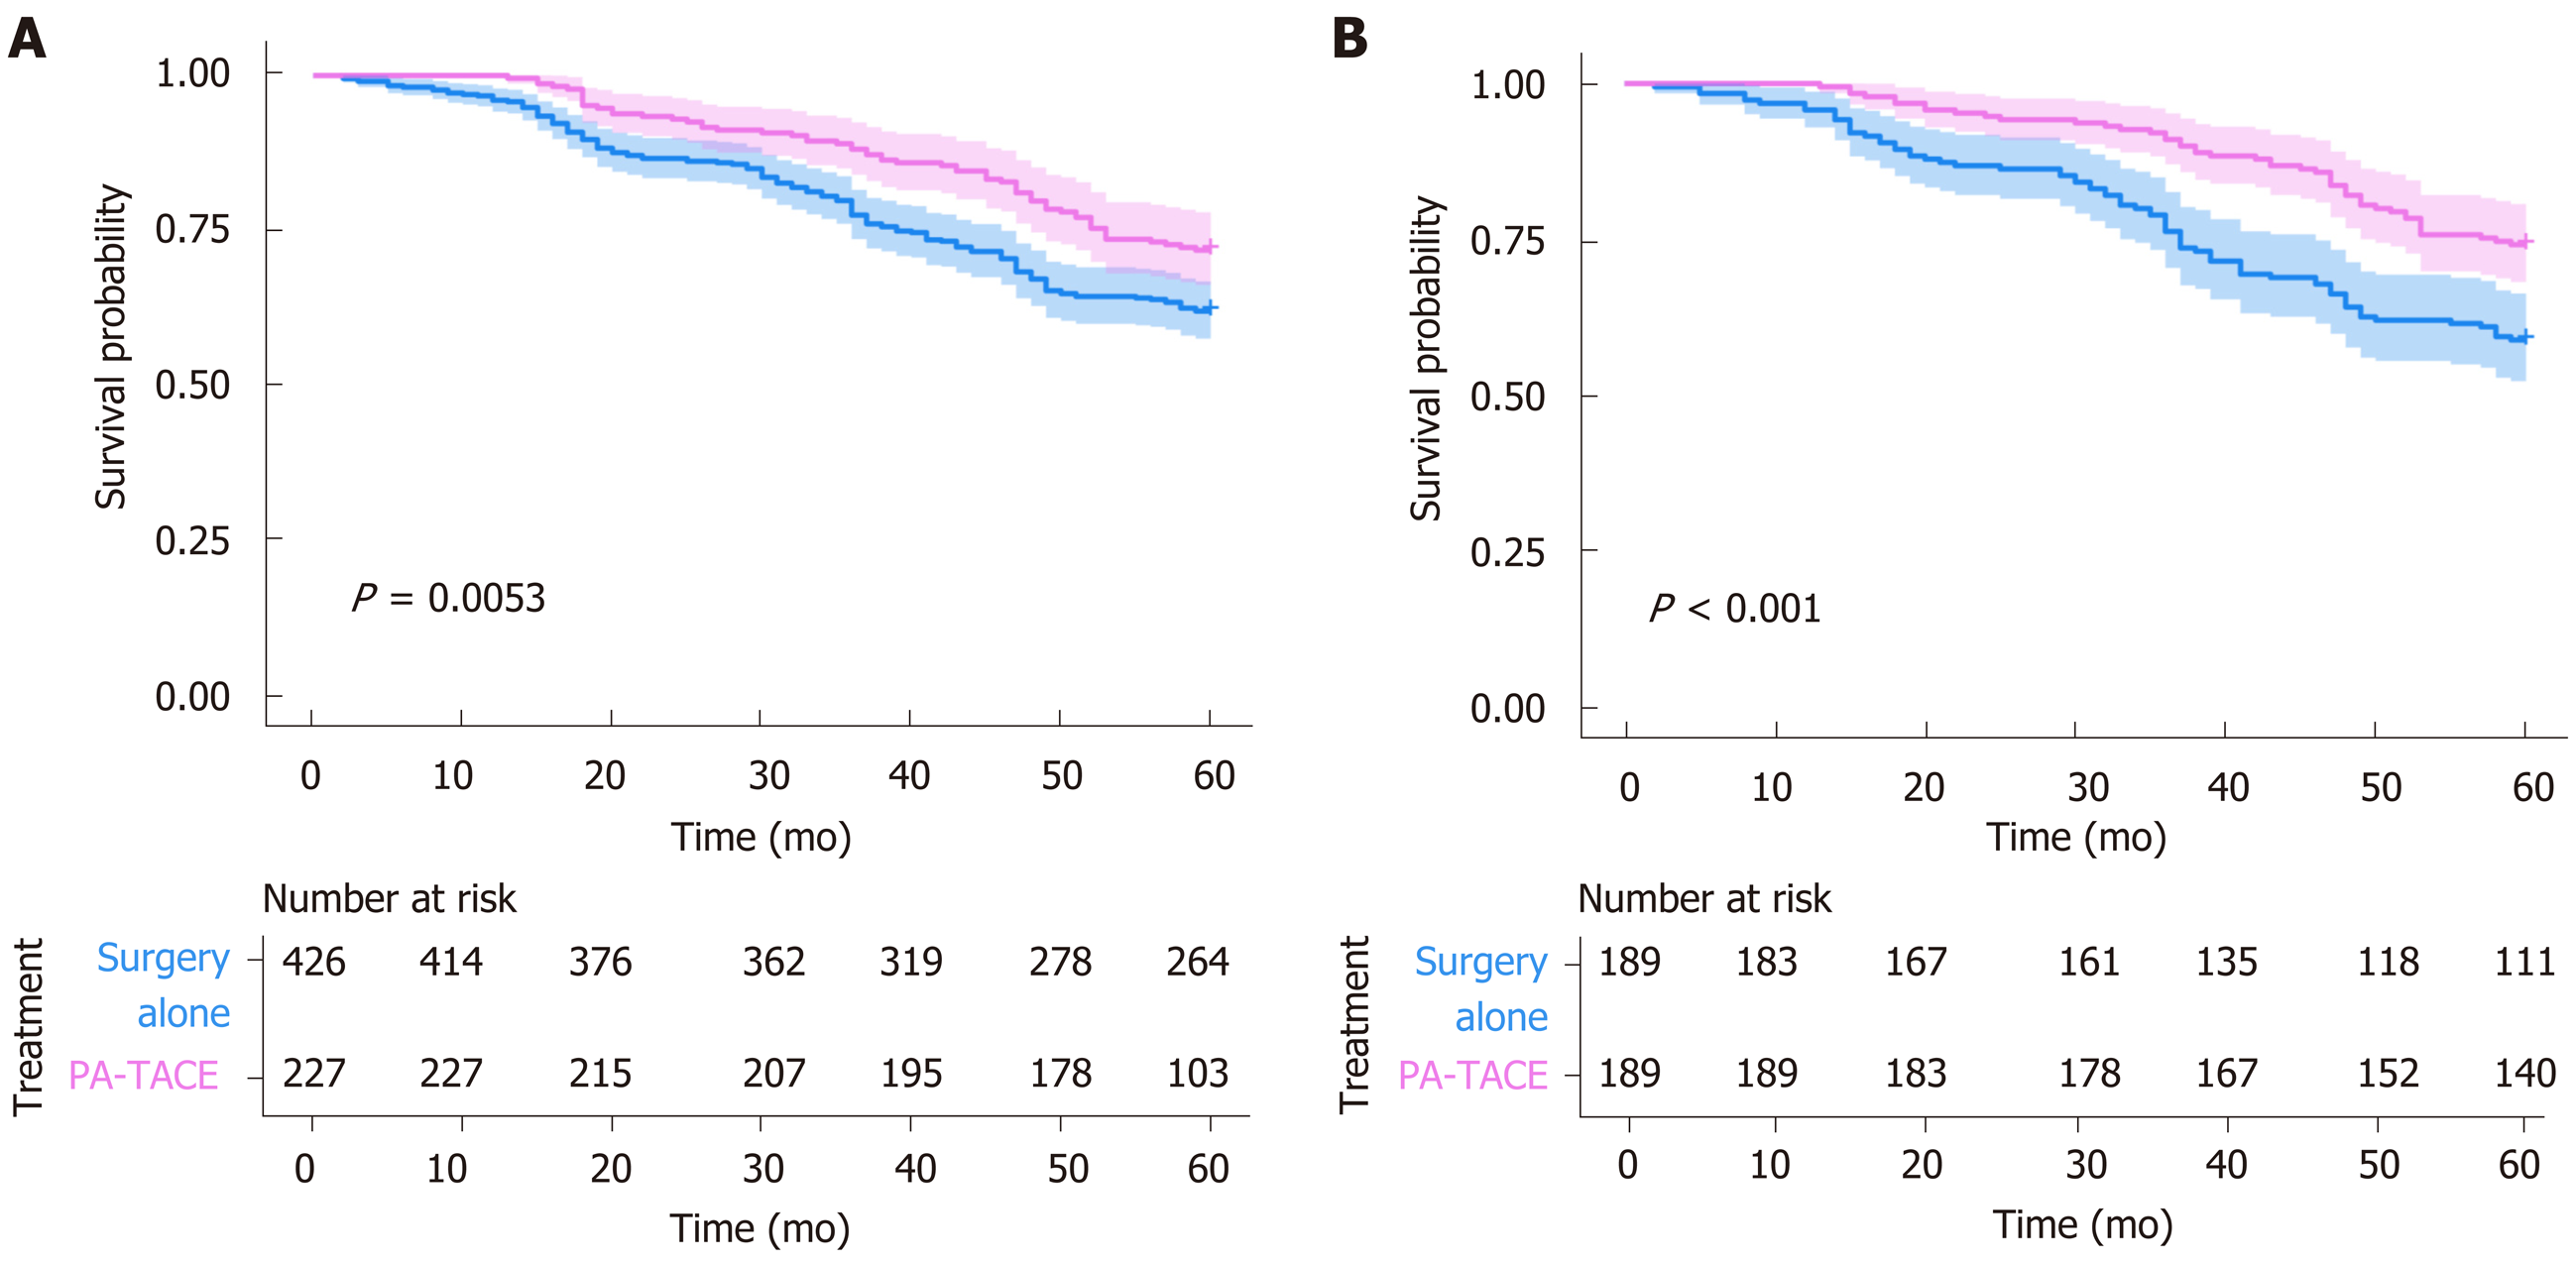
Figure 2 Kaplan-Meier curve for liver cancer survival.
A: Original data; B: Matched data. PA-TACE: Postoperative adjuvant transcatheter arterial chemoembolization.
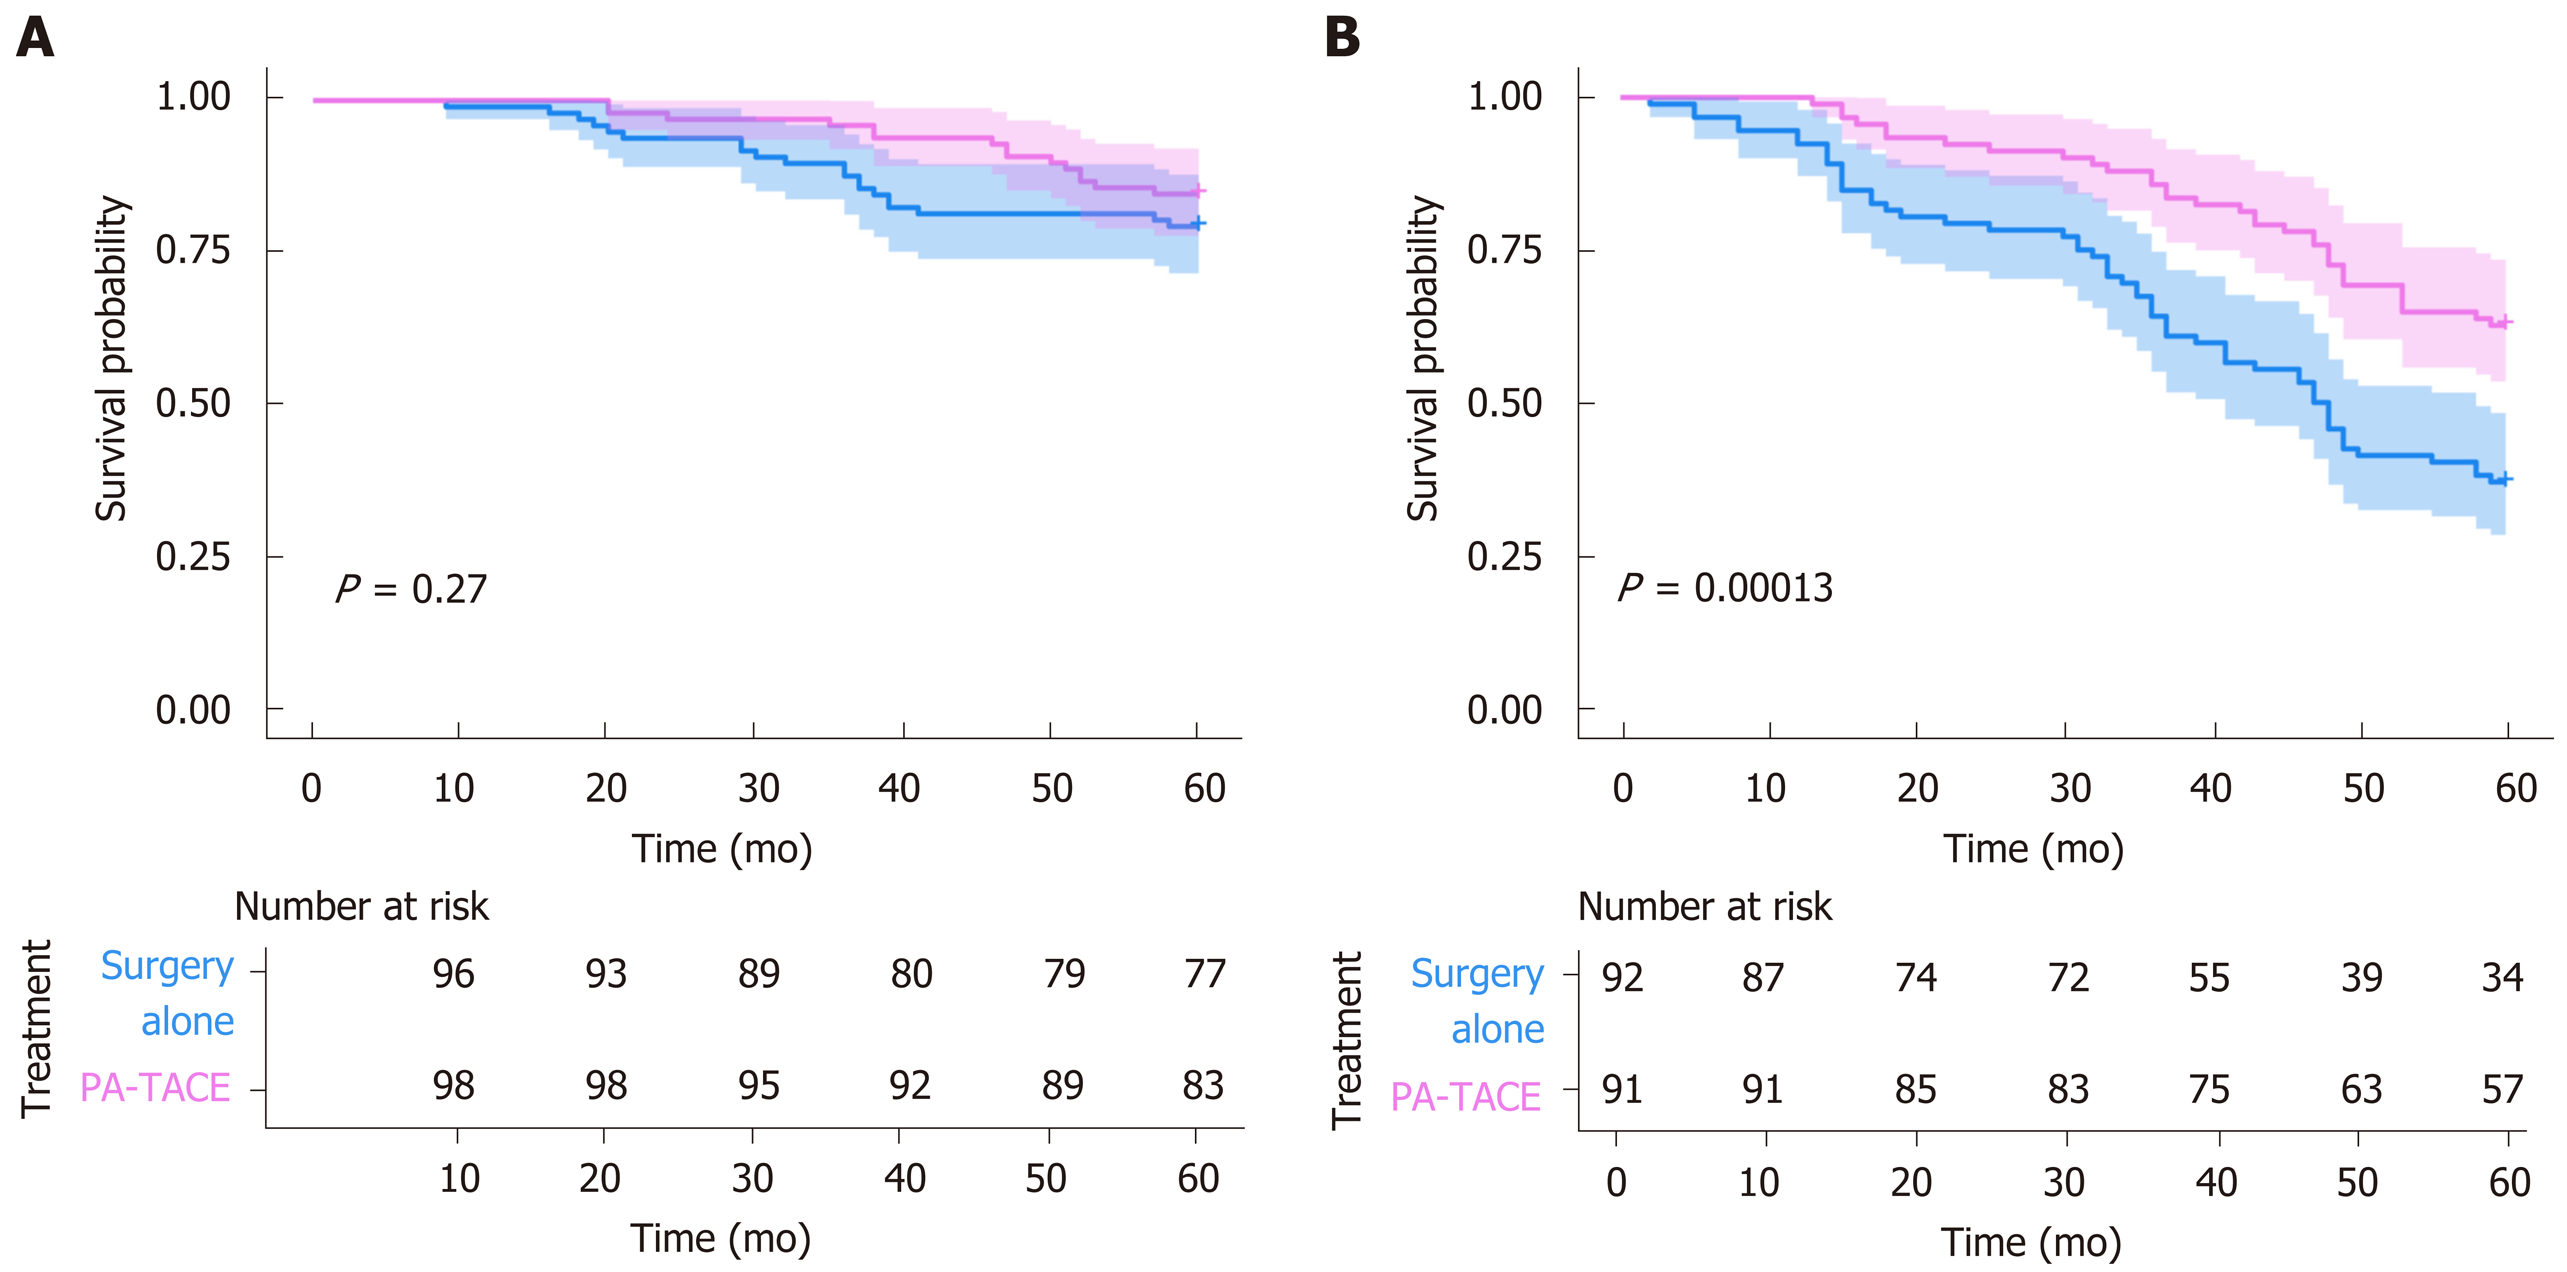
Figure 3 Kaplan-Meier curve for liver cancer survival in the low and high ferritin-to-hemoglobin ratio group.
A: Low ferritin-to-hemoglobin ratio; B: High ferritin-to-hemoglobin ratio. PA-TACE: Postoperative adjuvant transcatheter arterial chemoembolization.
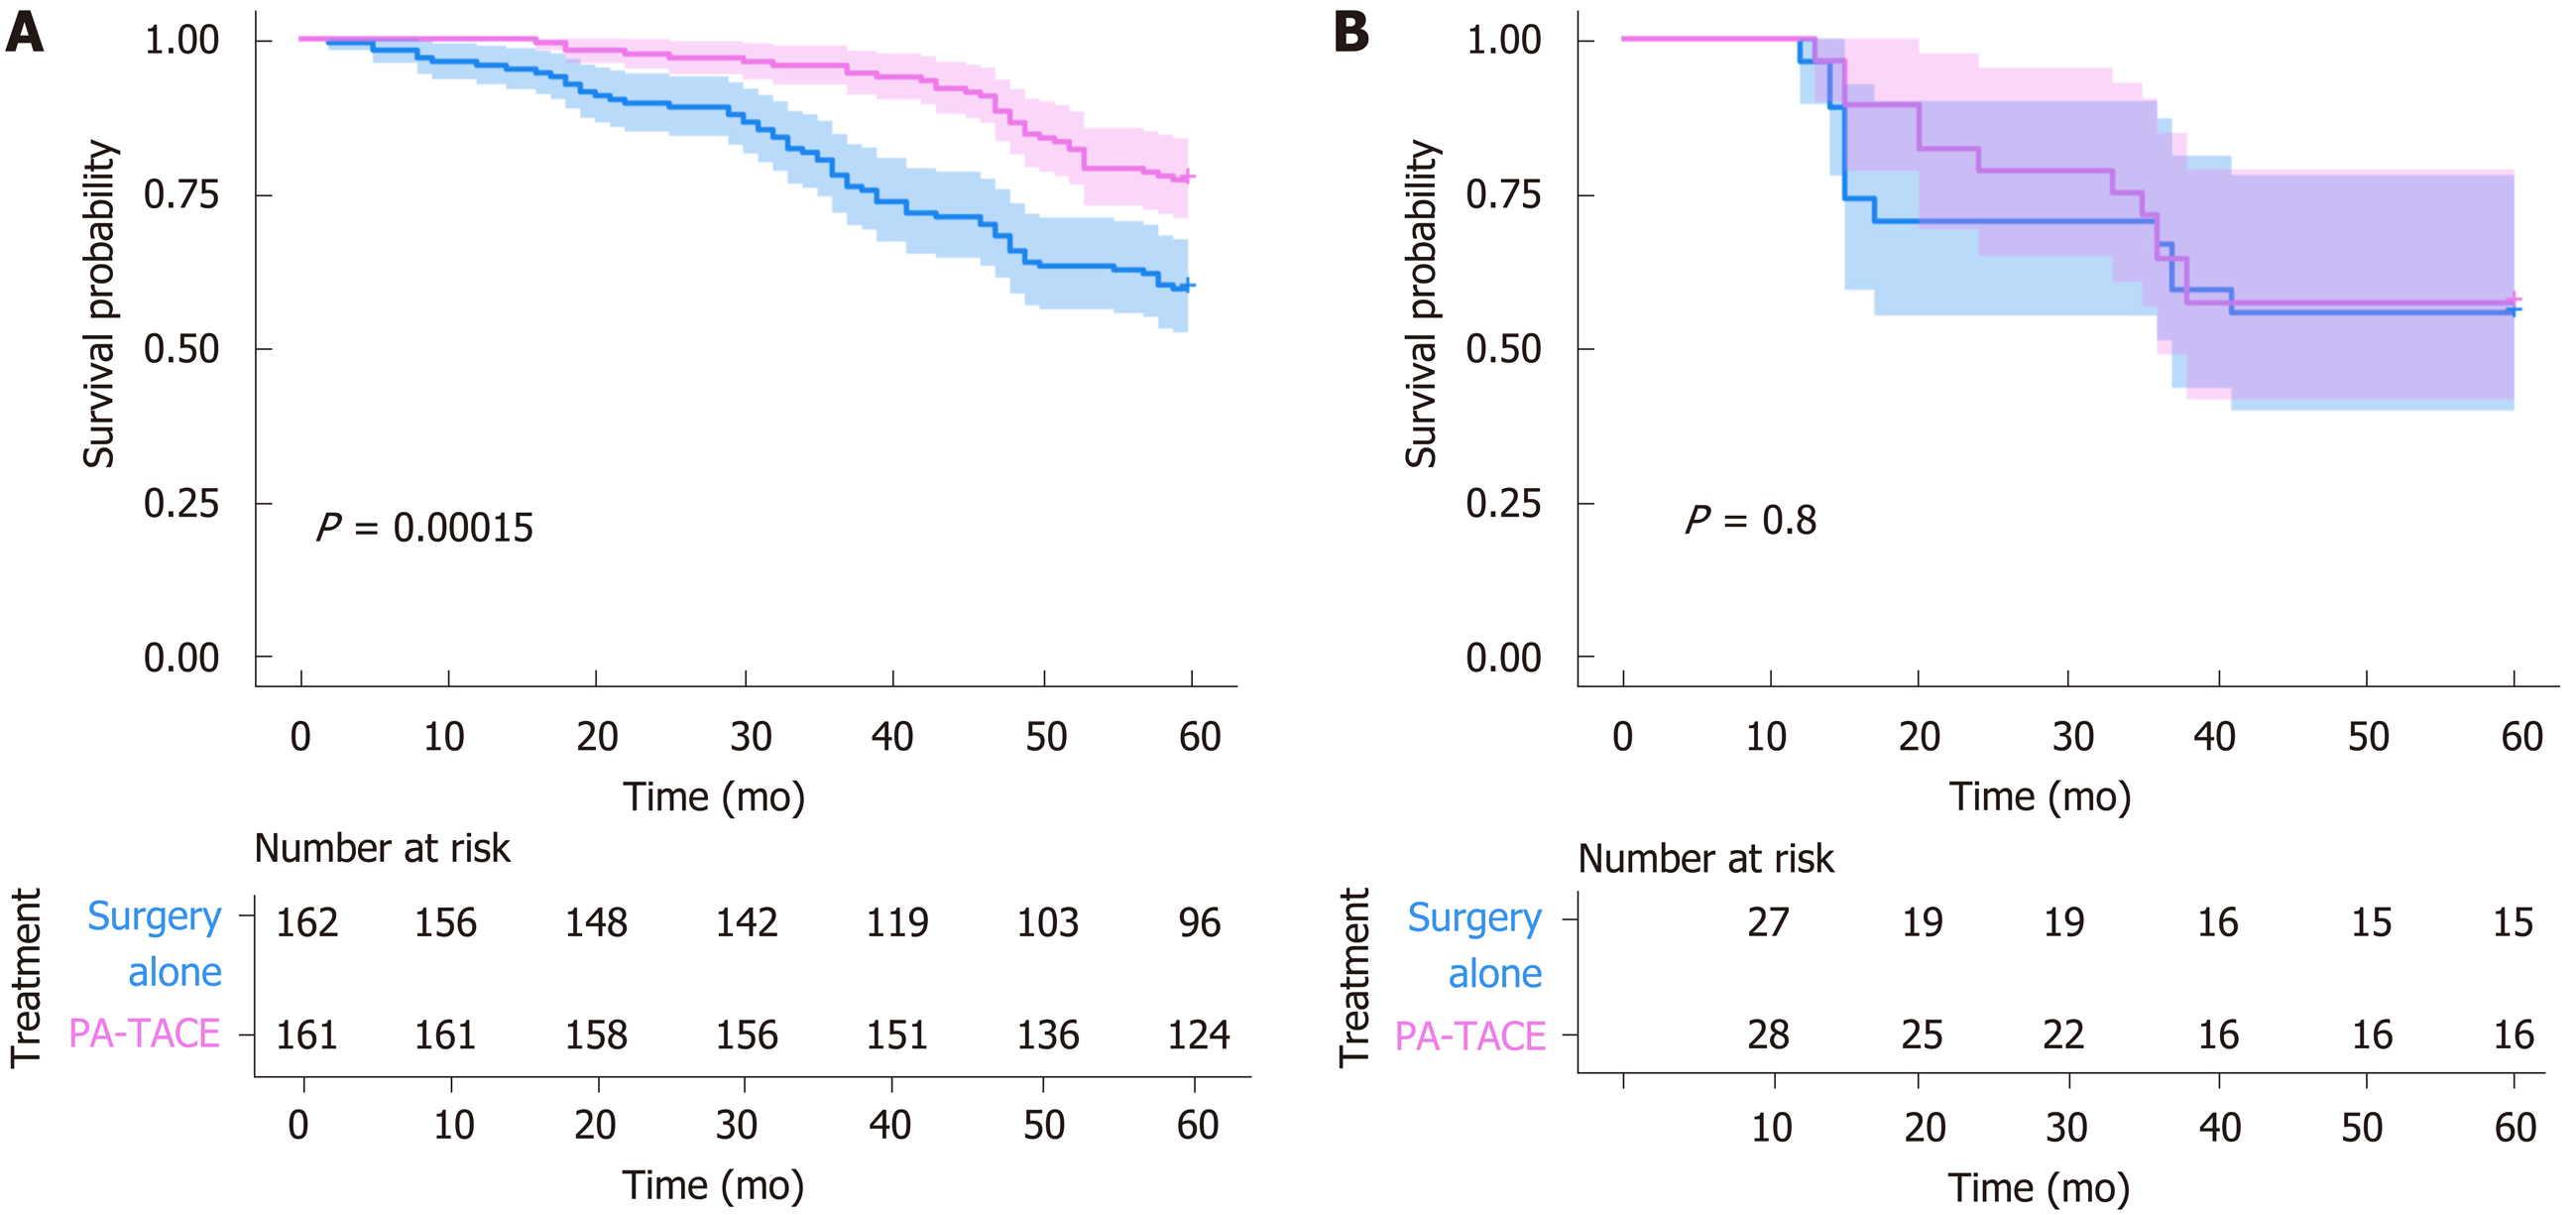
Figure 4 Kaplan-Meier curve for liver cancer survival in patients with and without microscopic vascular invasion.
A: Absence of microscopic vascular invasion; B: Presence of microscopic vascular invasion. PA-TACE: Postoperative adjuvant transcatheter arterial chemoembolization.
- Citation: Chen MY, Juengpanich S, Hu JH, Topatana W, Cao JS, Tong CH, Lin J, Cai XJ. Prognostic factors and predictors of postoperative adjuvant transcatheter arterial chemoembolization benefit in patients with resected hepatocellular carcinoma. World J Gastroenterol 2020; 26(10): 1042-1055
- URL: https://www.wjgnet.com/1007-9327/full/v26/i10/1042.htm
- DOI: https://dx.doi.org/10.3748/wjg.v26.i10.1042


