Copyright
©The Author(s) 2020.
World J Gastroenterol. Mar 14, 2020; 26(10): 1029-1041
Published online Mar 14, 2020. doi: 10.3748/wjg.v26.i10.1029
Published online Mar 14, 2020. doi: 10.3748/wjg.v26.i10.1029
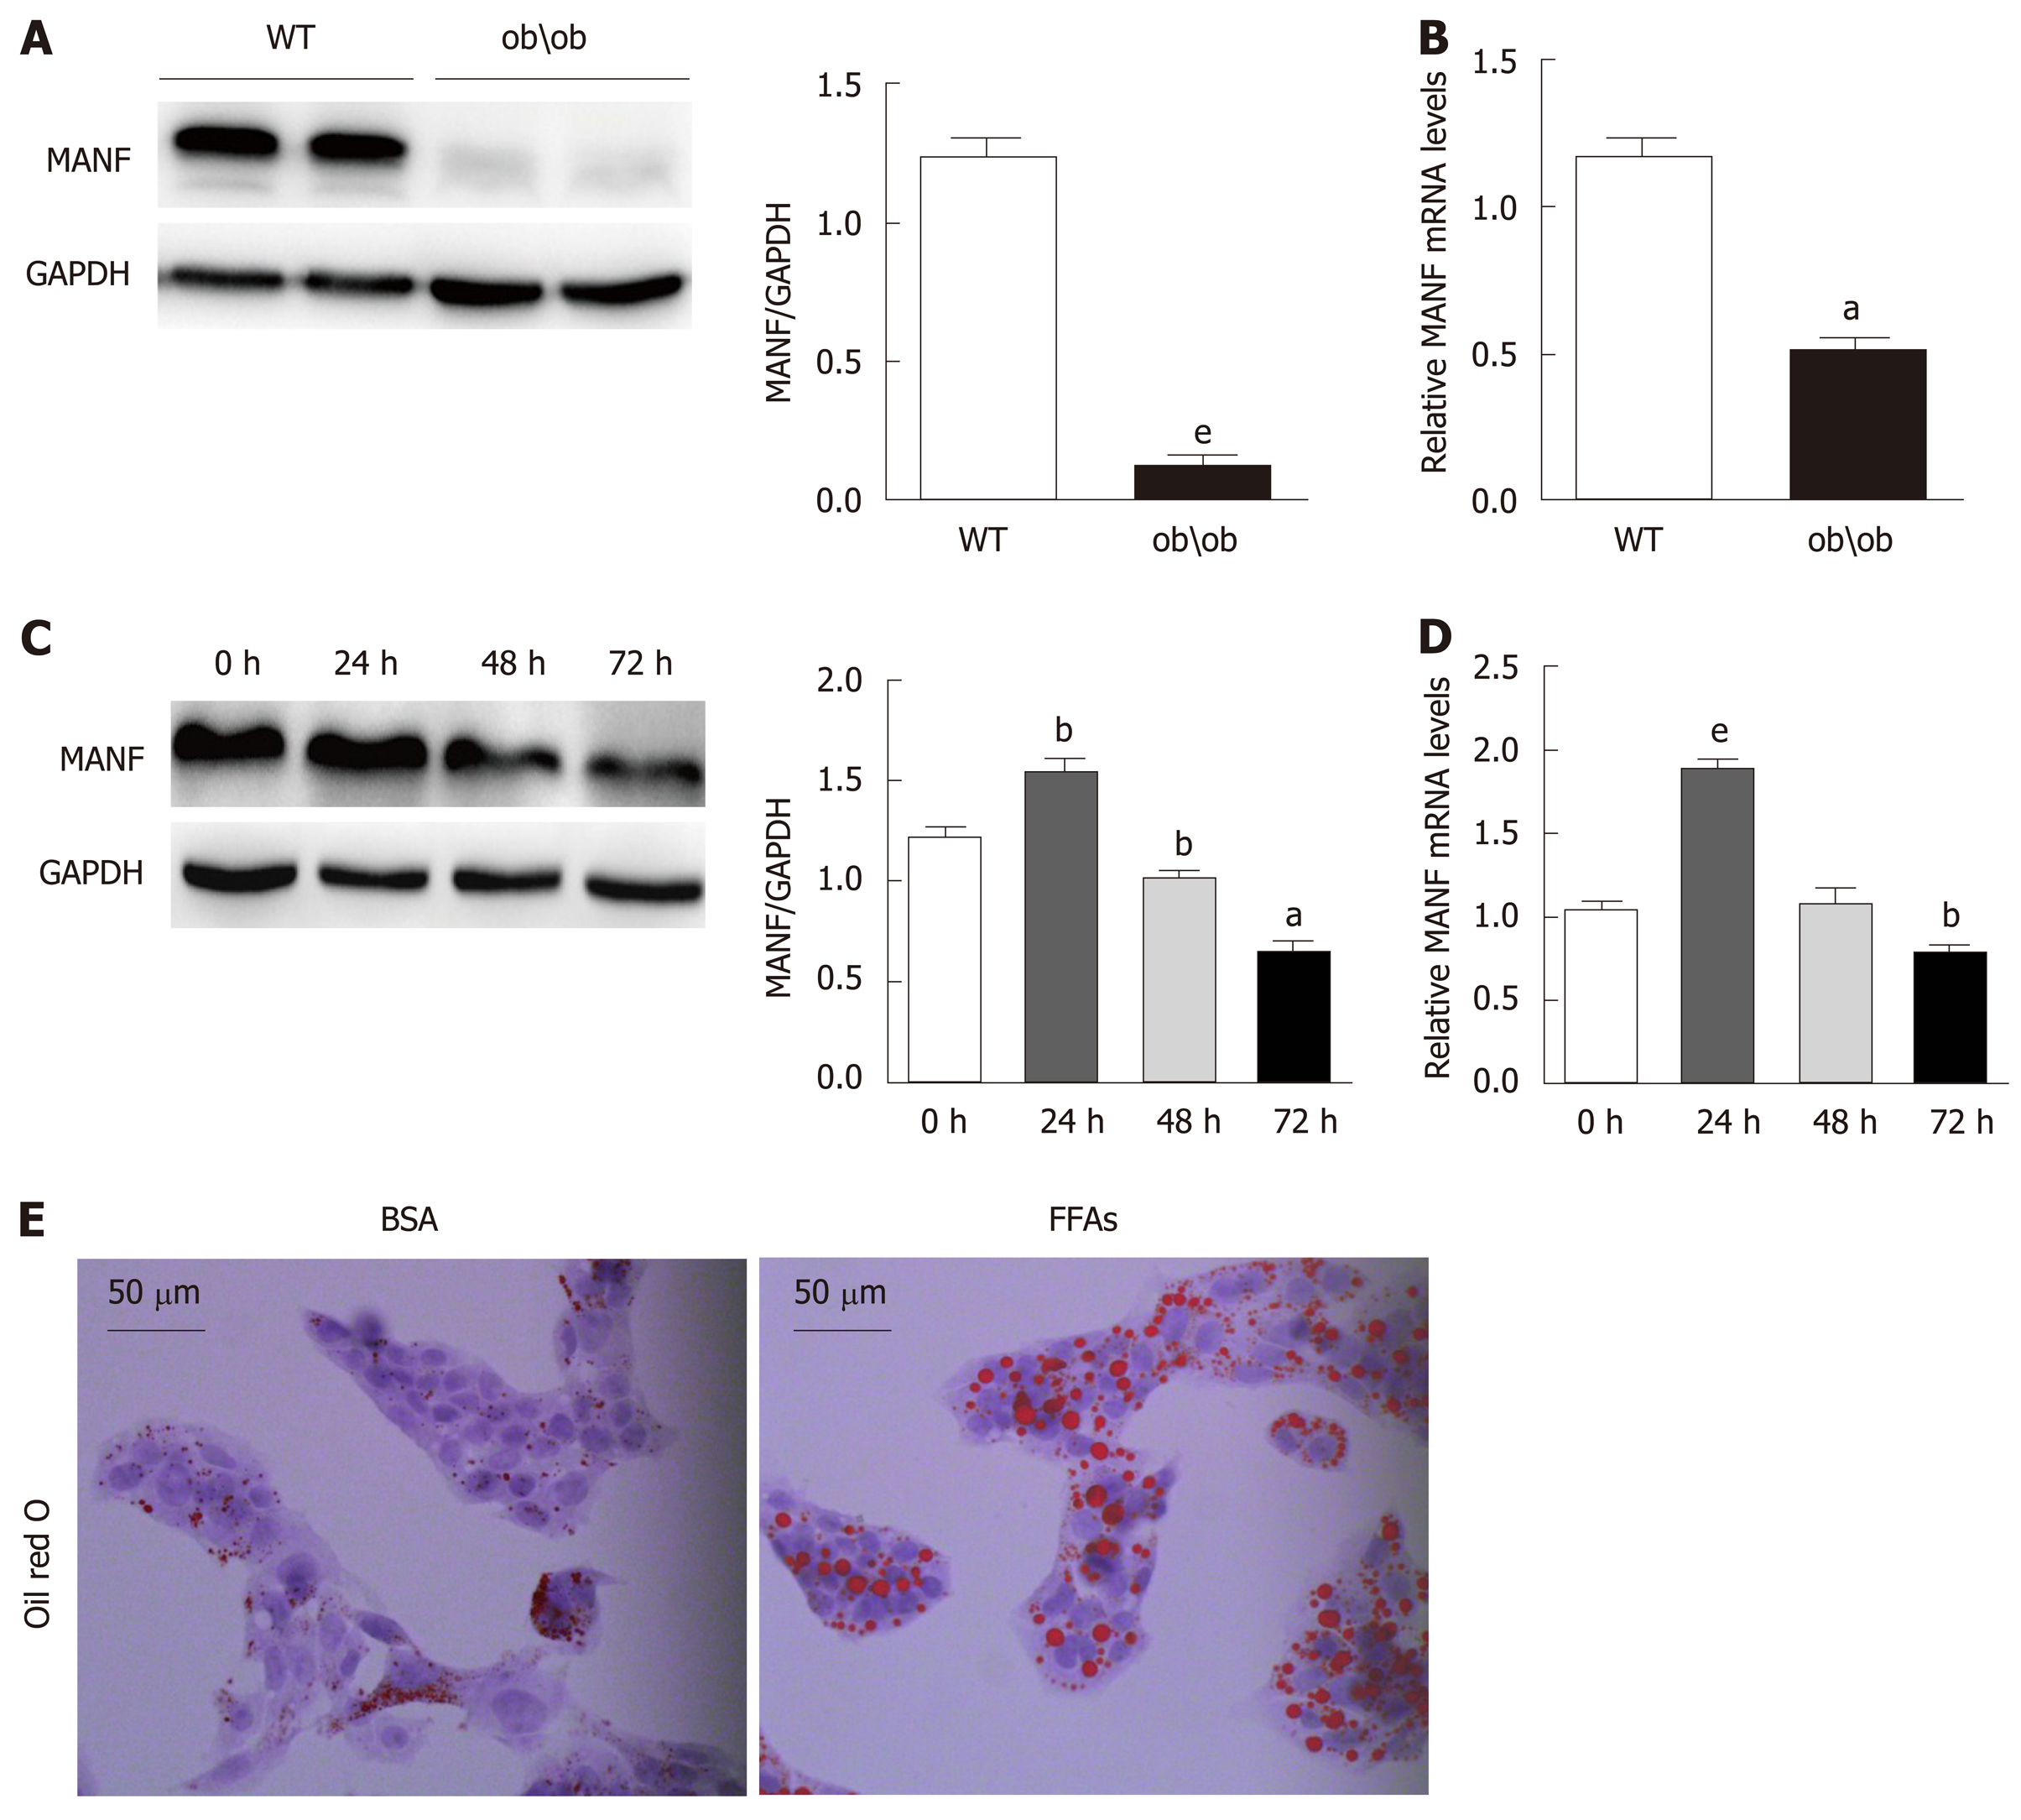
Figure 1 Mesencephalic astrocyte-derived neurotrophic factor expression is downregulated in both in vitro and in vivo nonalcoholic fatty liver disease models.
A: Mesencephalic astrocyte-derived neurotrophic factor (MANF) protein expression in the liver of ob/ob mice and WT mice (n = 4), eP < 0.001 vs WT; B: MANF mRNA expression in the liver of ob/ob mice and WT mice (n = 3), aP < 0.05 vs WT; C and D: MANF protein (C) and mRNA (D) expression in HepG2 cells after treatment with bovine serum albumin or 0.5 mM free fatty acids at different time points, aP < 0.05, bP < 0.01, eP < 0.001 vs 0 h; E: Representative oil red O staining of HepG2 cells (Scale bar = 50 μm). Data are presented as the mean ± SE. All cell experiments were repeated three times. MANF: Mesencephalic astrocyte-derived neurotrophic factor; GAPDH: Glyceraldehyde 3-phosphate dehydrogenase; BSA: Bovine serum albumin; FFAs: Free fatty acids; WT: Wild type.
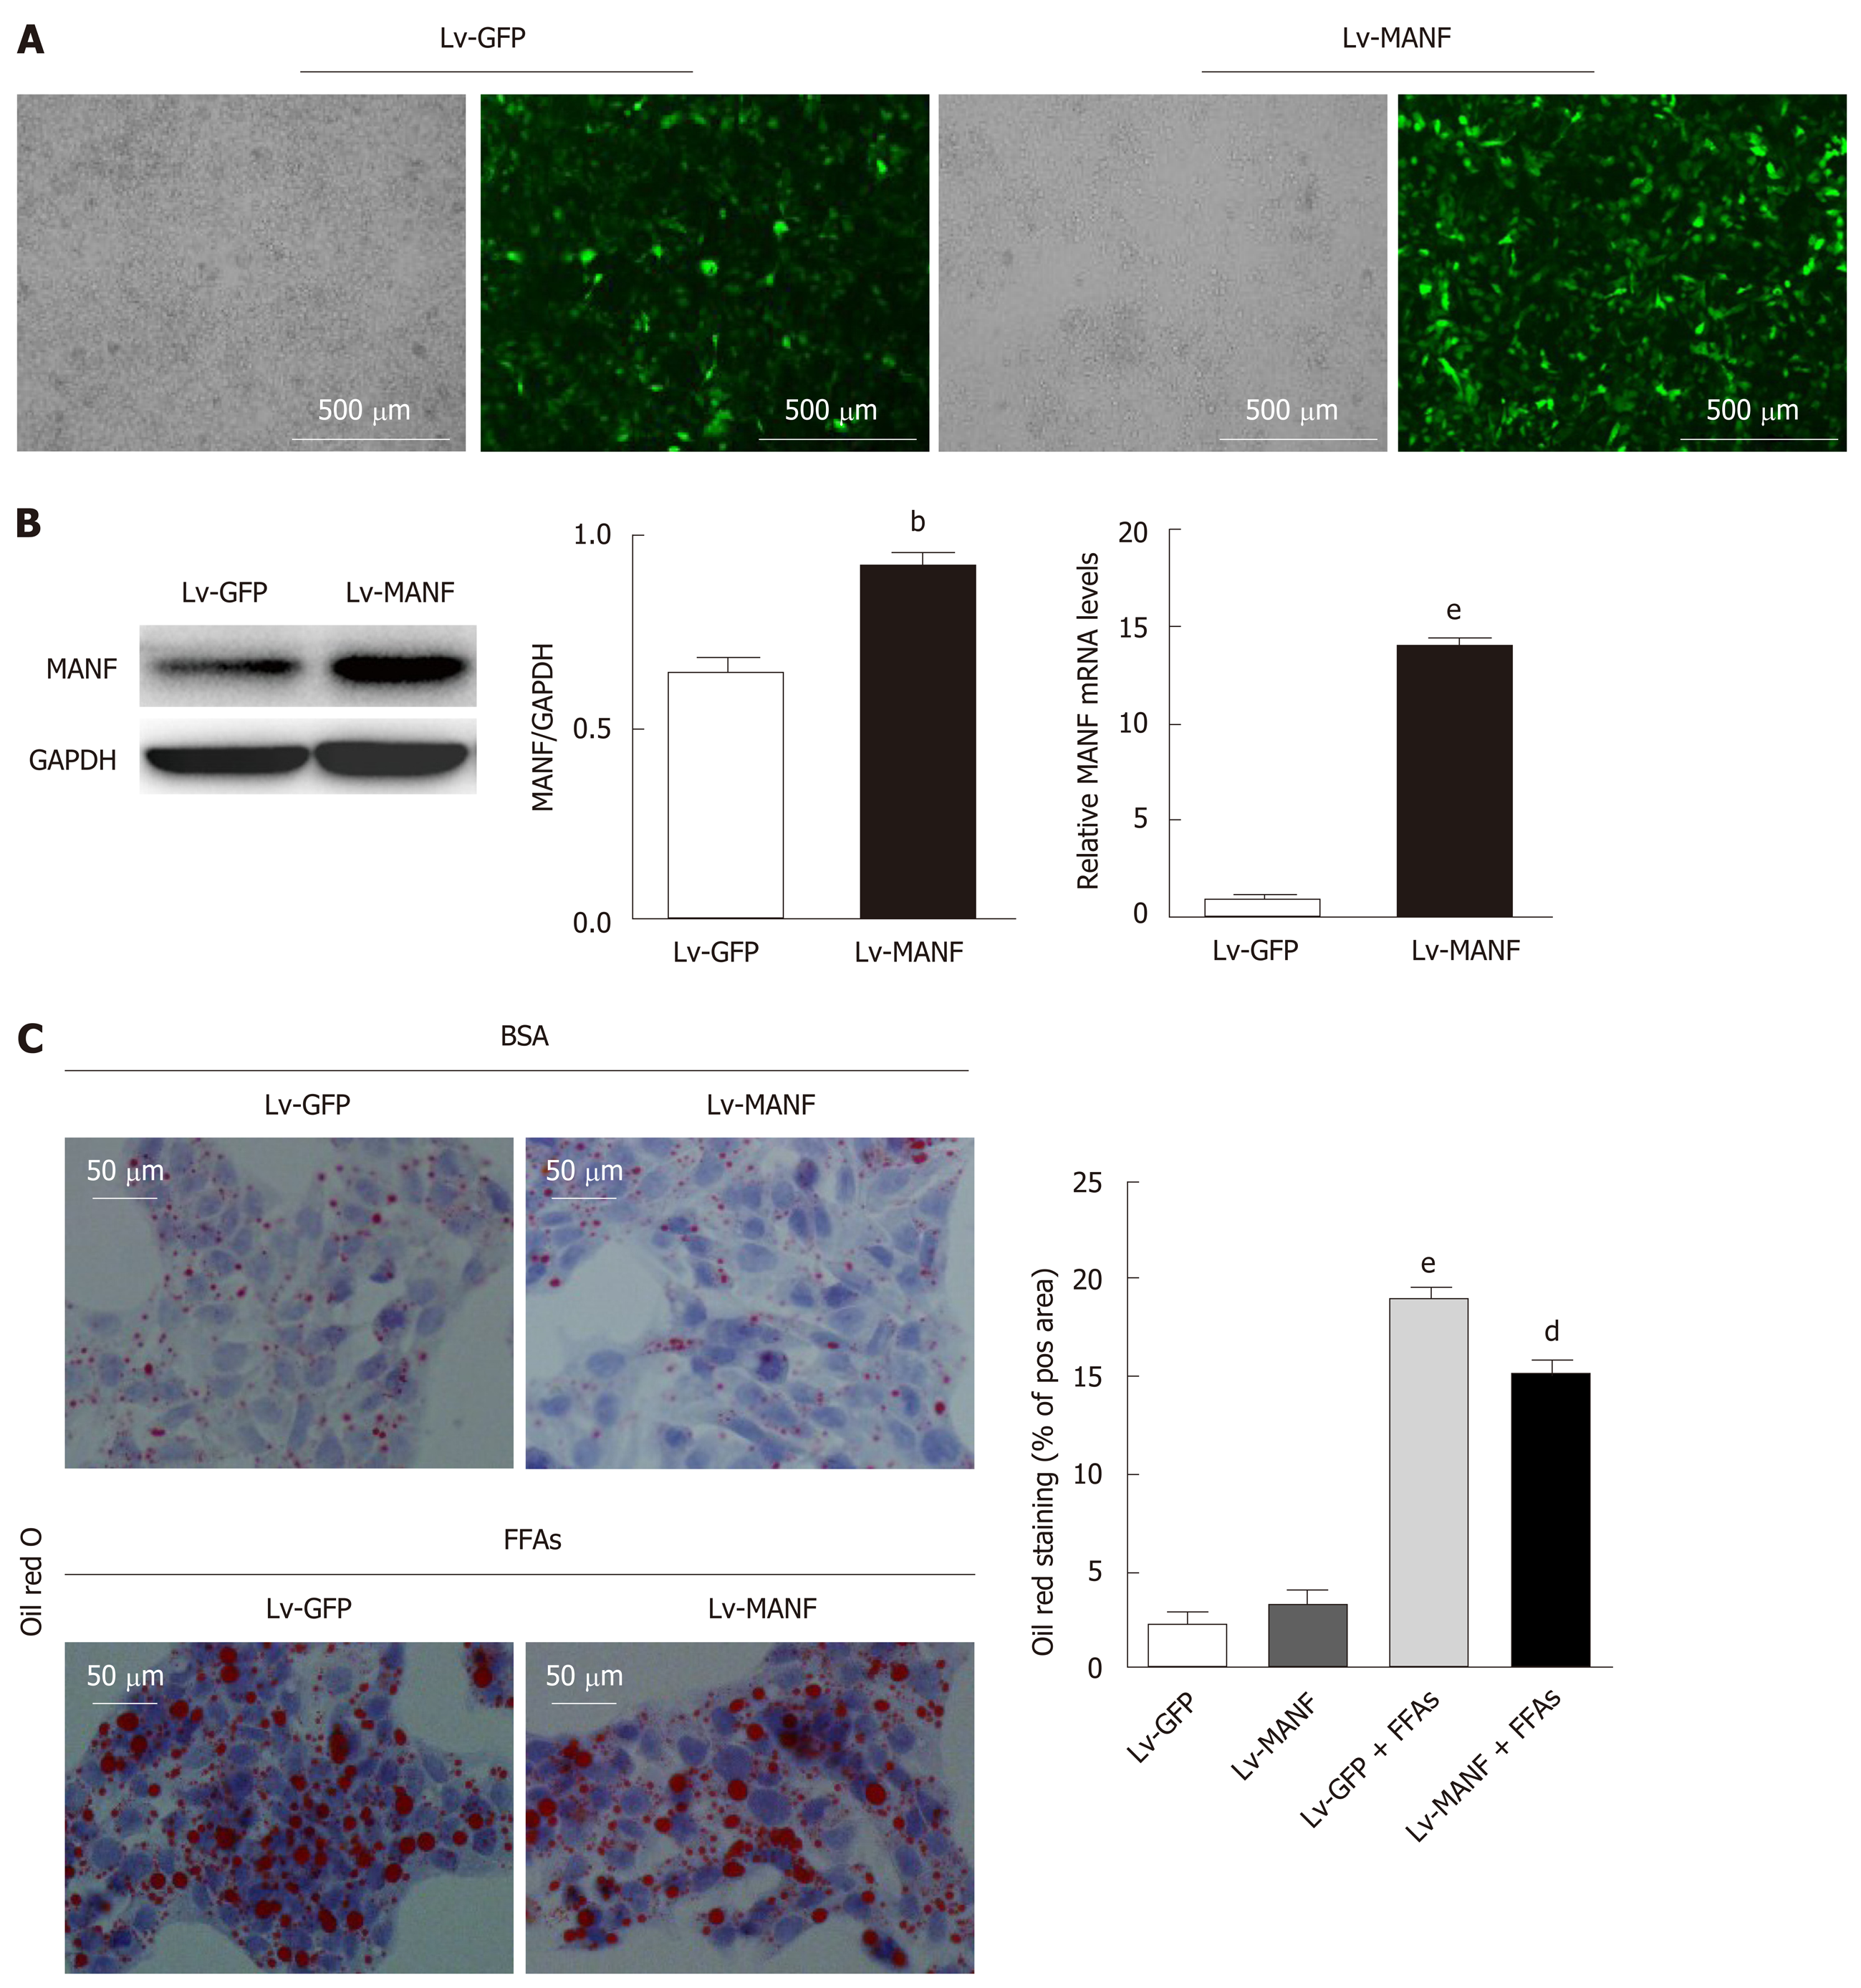
Figure 2 Mesencephalic astrocyte-derived neurotrophic factor overexpression decreases the content of lipid droplets in HepG2 cells.
A: Schematic representation of lentivirus (Lv) transfection in HepG2 cells for identification of efficiency (Scale bar = 500 μm); B: Efficiency of lentivirus transfection detected by Western blot and quantitative real-time PCR. bP < 0.01, eP < 0.001 vs Lv-GFP; C: Representative oil red O staining of HepG2 cells, which were treated with bovine serum albumin or 0.5 mM free fatty acids for 72 h, and the positively stained area was quantified (Scale bar = 50 μm). Data are shown as the mean ± SE. All experiments were repeated three times. eP < 0.001 vs Lv-GFP; dP < 0.01 vs Lv-GFP + FFAs. MANF: Mesencephalic astrocyte-derived neurotrophic factor; GAPDH: Glyceraldehyde 3-phosphate dehydrogenase; Lv: Lentivirus; BSA: Bovine serum albumin; FFAs: Free fatty acids.
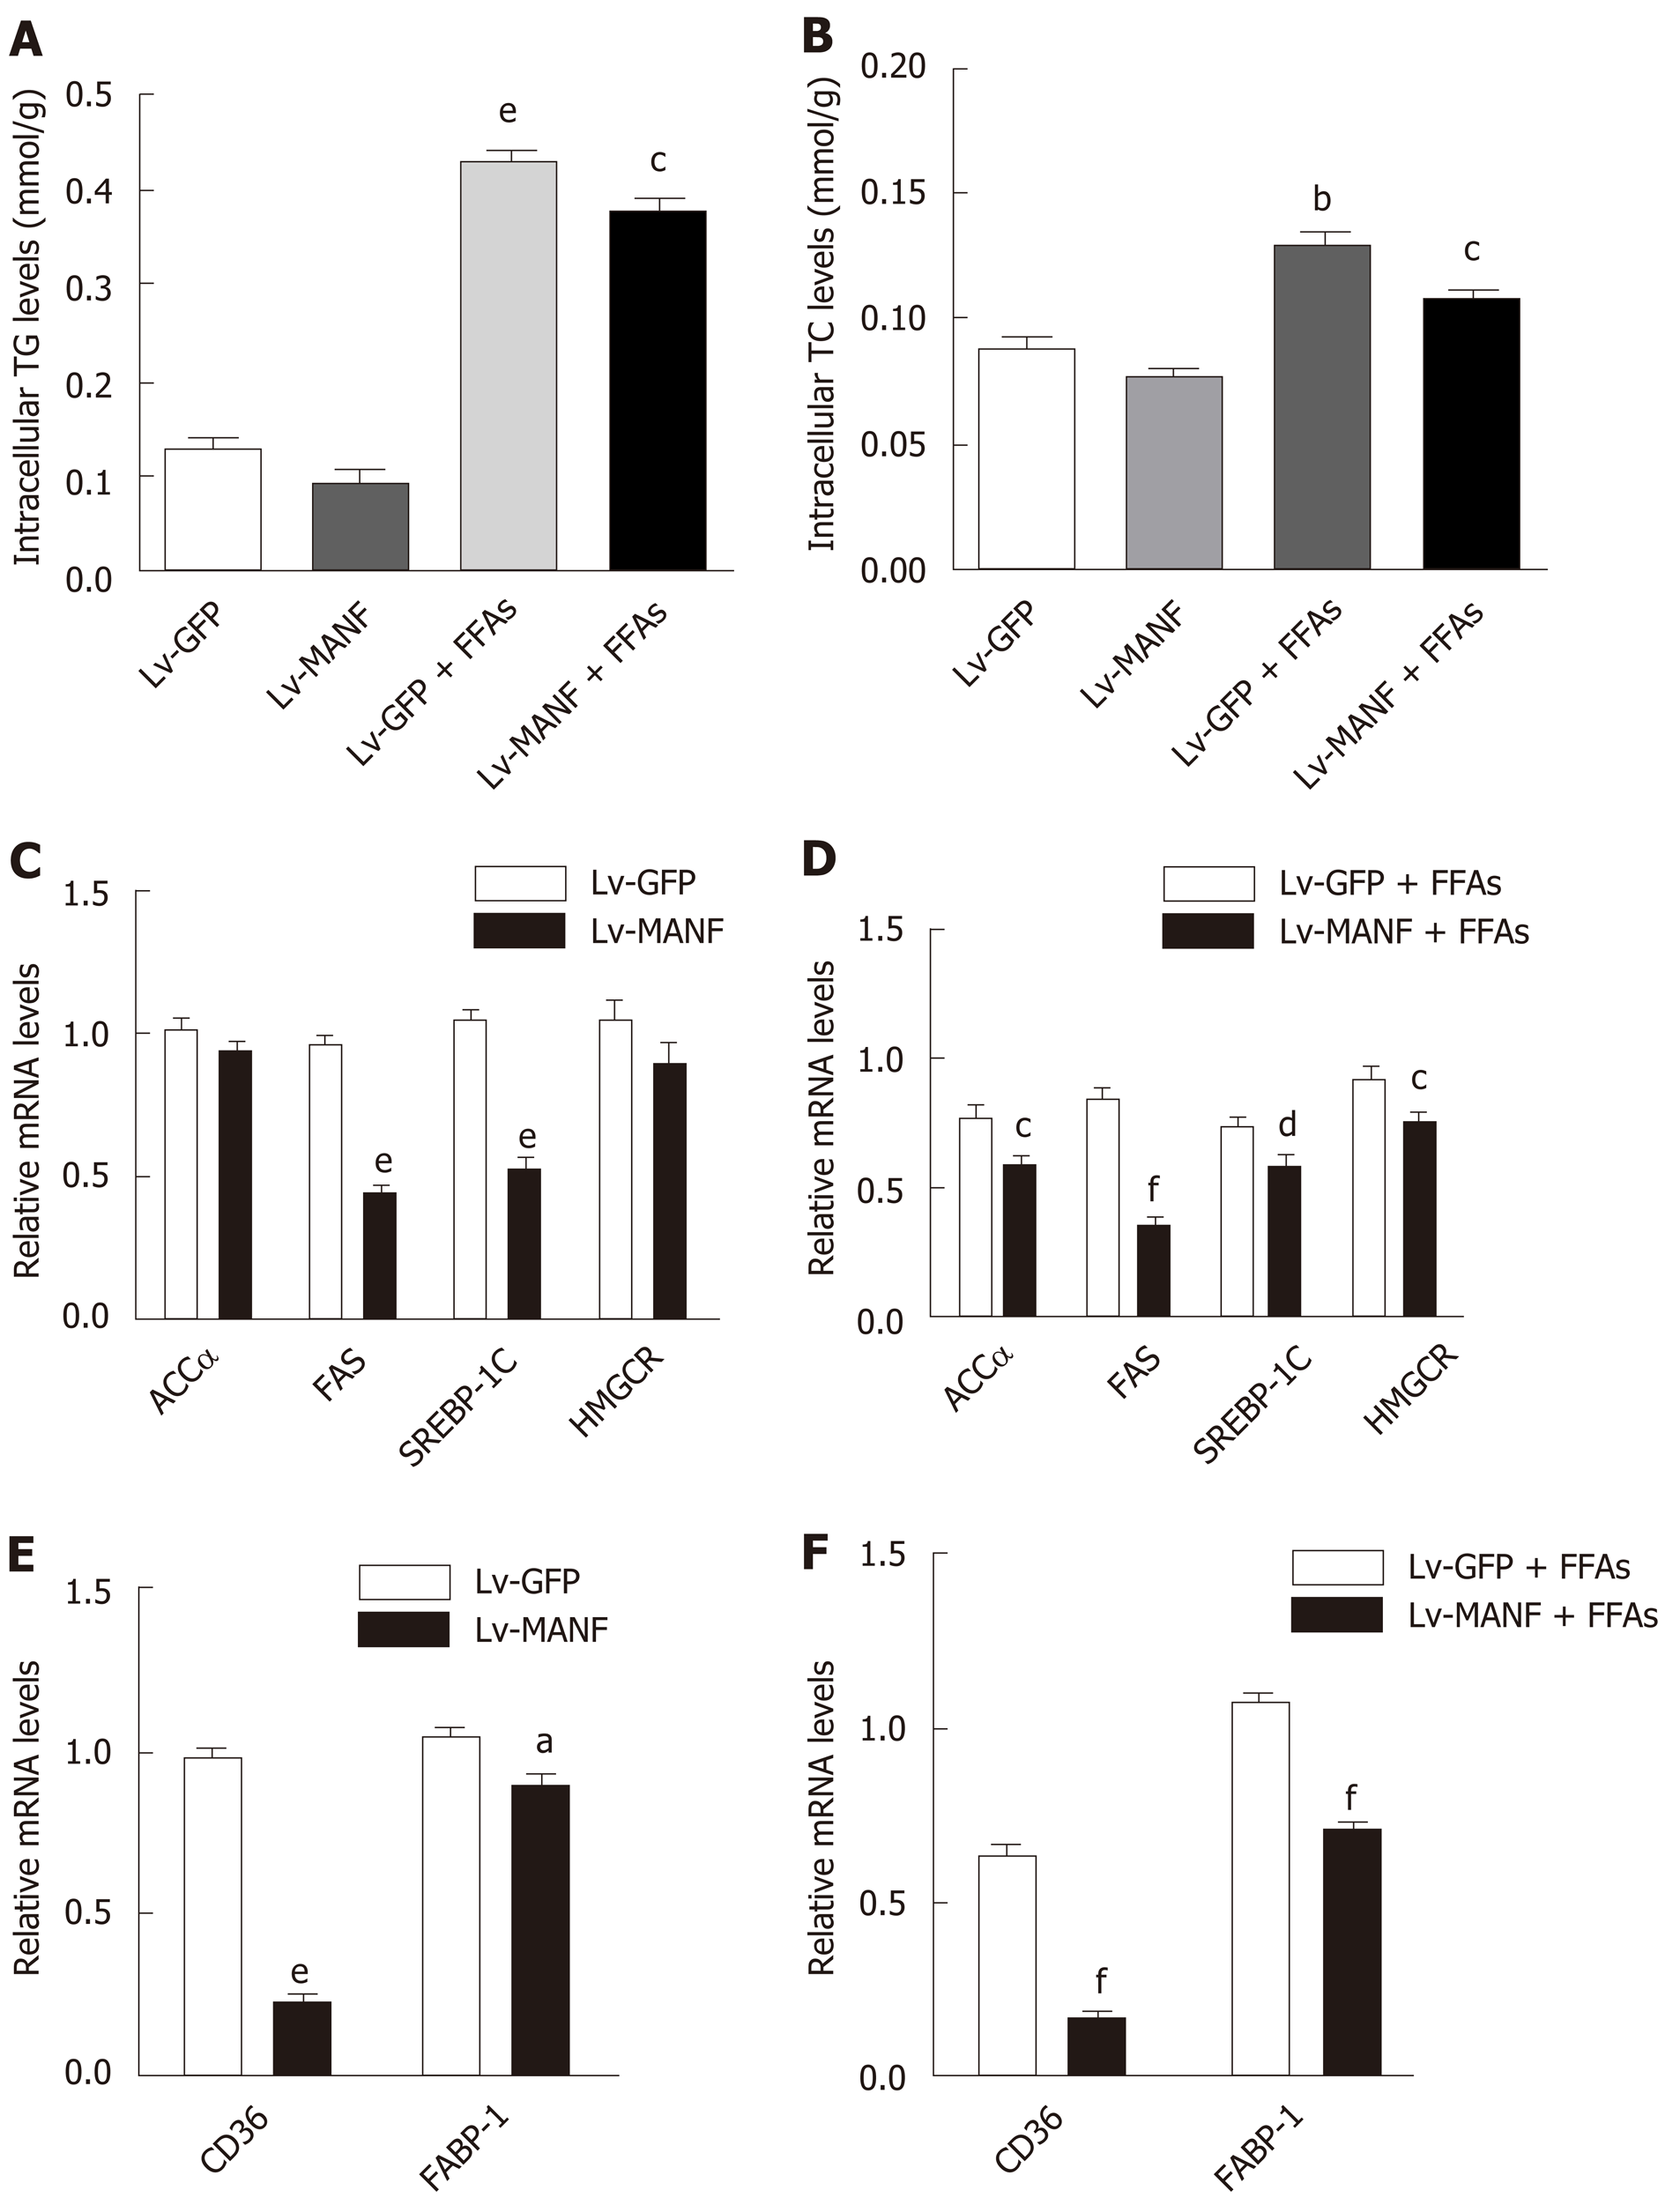
Figure 3 Mesencephalic astrocyte-derived neurotrophic factor overexpression suppresses lipogenesis.
A and B: The intracellular levels of TG (A) and TC (B) in HepG2 cells treated with bovine serum albumin or free fatty acids (FFAs) for 72 h, bP<0.01, eP < 0.001 vs Lv-GFP; cP < 0.05 vs Lv-GFP + FFAs; C and D: The mRNA levels of genes involved in fatty acid synthesis (ACCα, FAS, SREBP-1C, and HMGCR) without FFAs treatment (C) and upon FFAs treatment (D), eP < 0.001 vs Lv-GFP; cP < 0.05, dP < 0.01, fP < 0.001 vs Lv-GFP + FFAs; E and F: The mRNA levels of genes related to lipid uptake (CD36, FABP-1) without FFAs treatment (E) and upon FFAs treatment (F), aP < 0.05, eP < 0.001 vs Lv-GFP; fP < 0.001 vs Lv-GFP + FFAs. Data represent the mean ± SE, and all experiments were repeated three times. MANF: Mesencephalic astrocyte-derived neurotrophic factor; TG: Triglyceride; TC: Total cholesterol; Lv: Lentivirus; BSA: Bovine serum albumin; FFAs: Free fatty acids; ACCα: Acetyl-CoA carboxylase α; FAS: Fatty acid synthase; SREBP-1C: Sterol regulatory element binding transcription factor 1C; HMGCR: 3-hydroxy3-methylglutaryl coenzyme A reductase; FABP-1: Fatty acid binding protein-1.
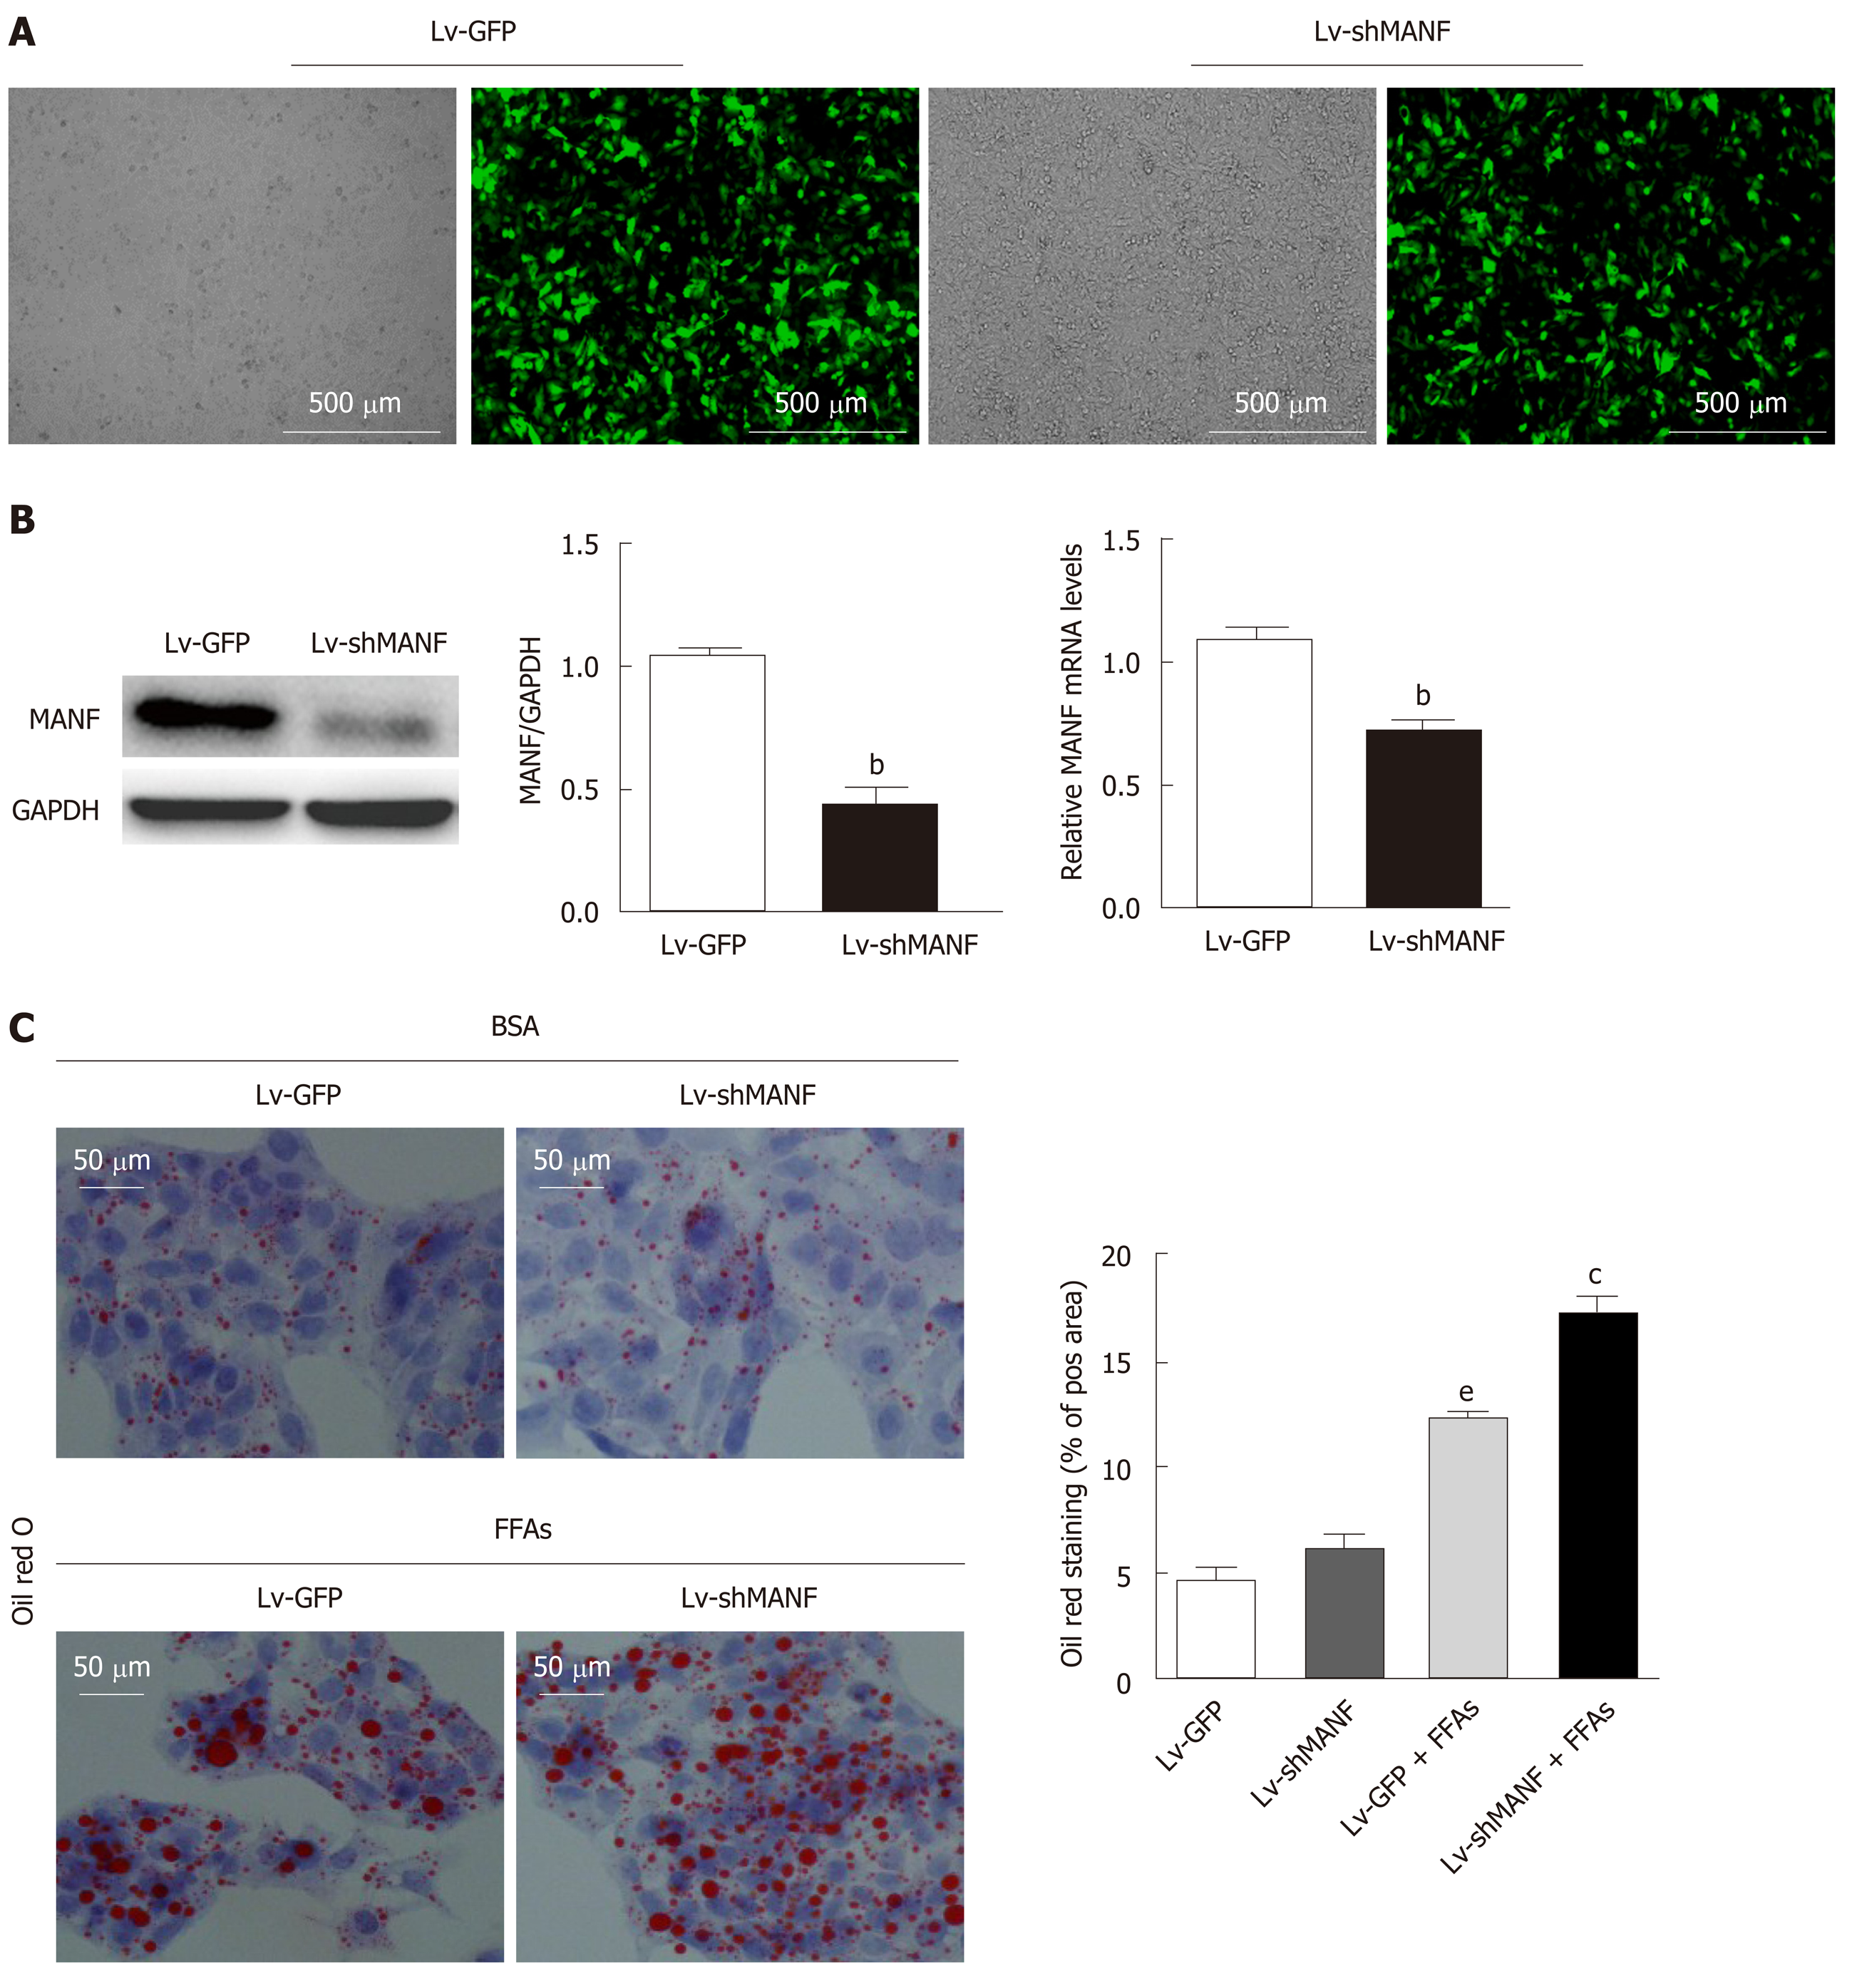
Figure 4 Mesencephalic astrocyte-derived neurotrophic factor knockdown increases the lipid content of HepG2 cells.
A: HepG2 cells were transfected with Lv-GFP or Lv-shMANF, and images were captured using an inverted fluorescence microscope (Scale bar = 500 μm); B: MANF RNAi efficiency was determined by Western blot and quantitative real-time PCR; C: Representative oil red O staining of HepG2 cells with bovine serum albumin or 0.5 mM free fatty acids for 72 h, and the positively stained area was quantified (Scale bar = 50 μm). Data are shown as the mean ± SE, and all experiments were repeated three times. bP < 0.01, eP < 0.001 vs Lv-GFP; cP < 0.05 vs Lv-GFP + FFAs. MANF: Mesencephalic astrocyte-derived neurotrophic factor; GAPDH: Glyceraldehyde 3-phosphate dehydrogenase; Lv: Lentivirus; Lv-shMANF: Lentivirus expressing short hairpin RNA-targeted MANF; BSA: Bovine serum albumin; FFAs: Free fatty acids.
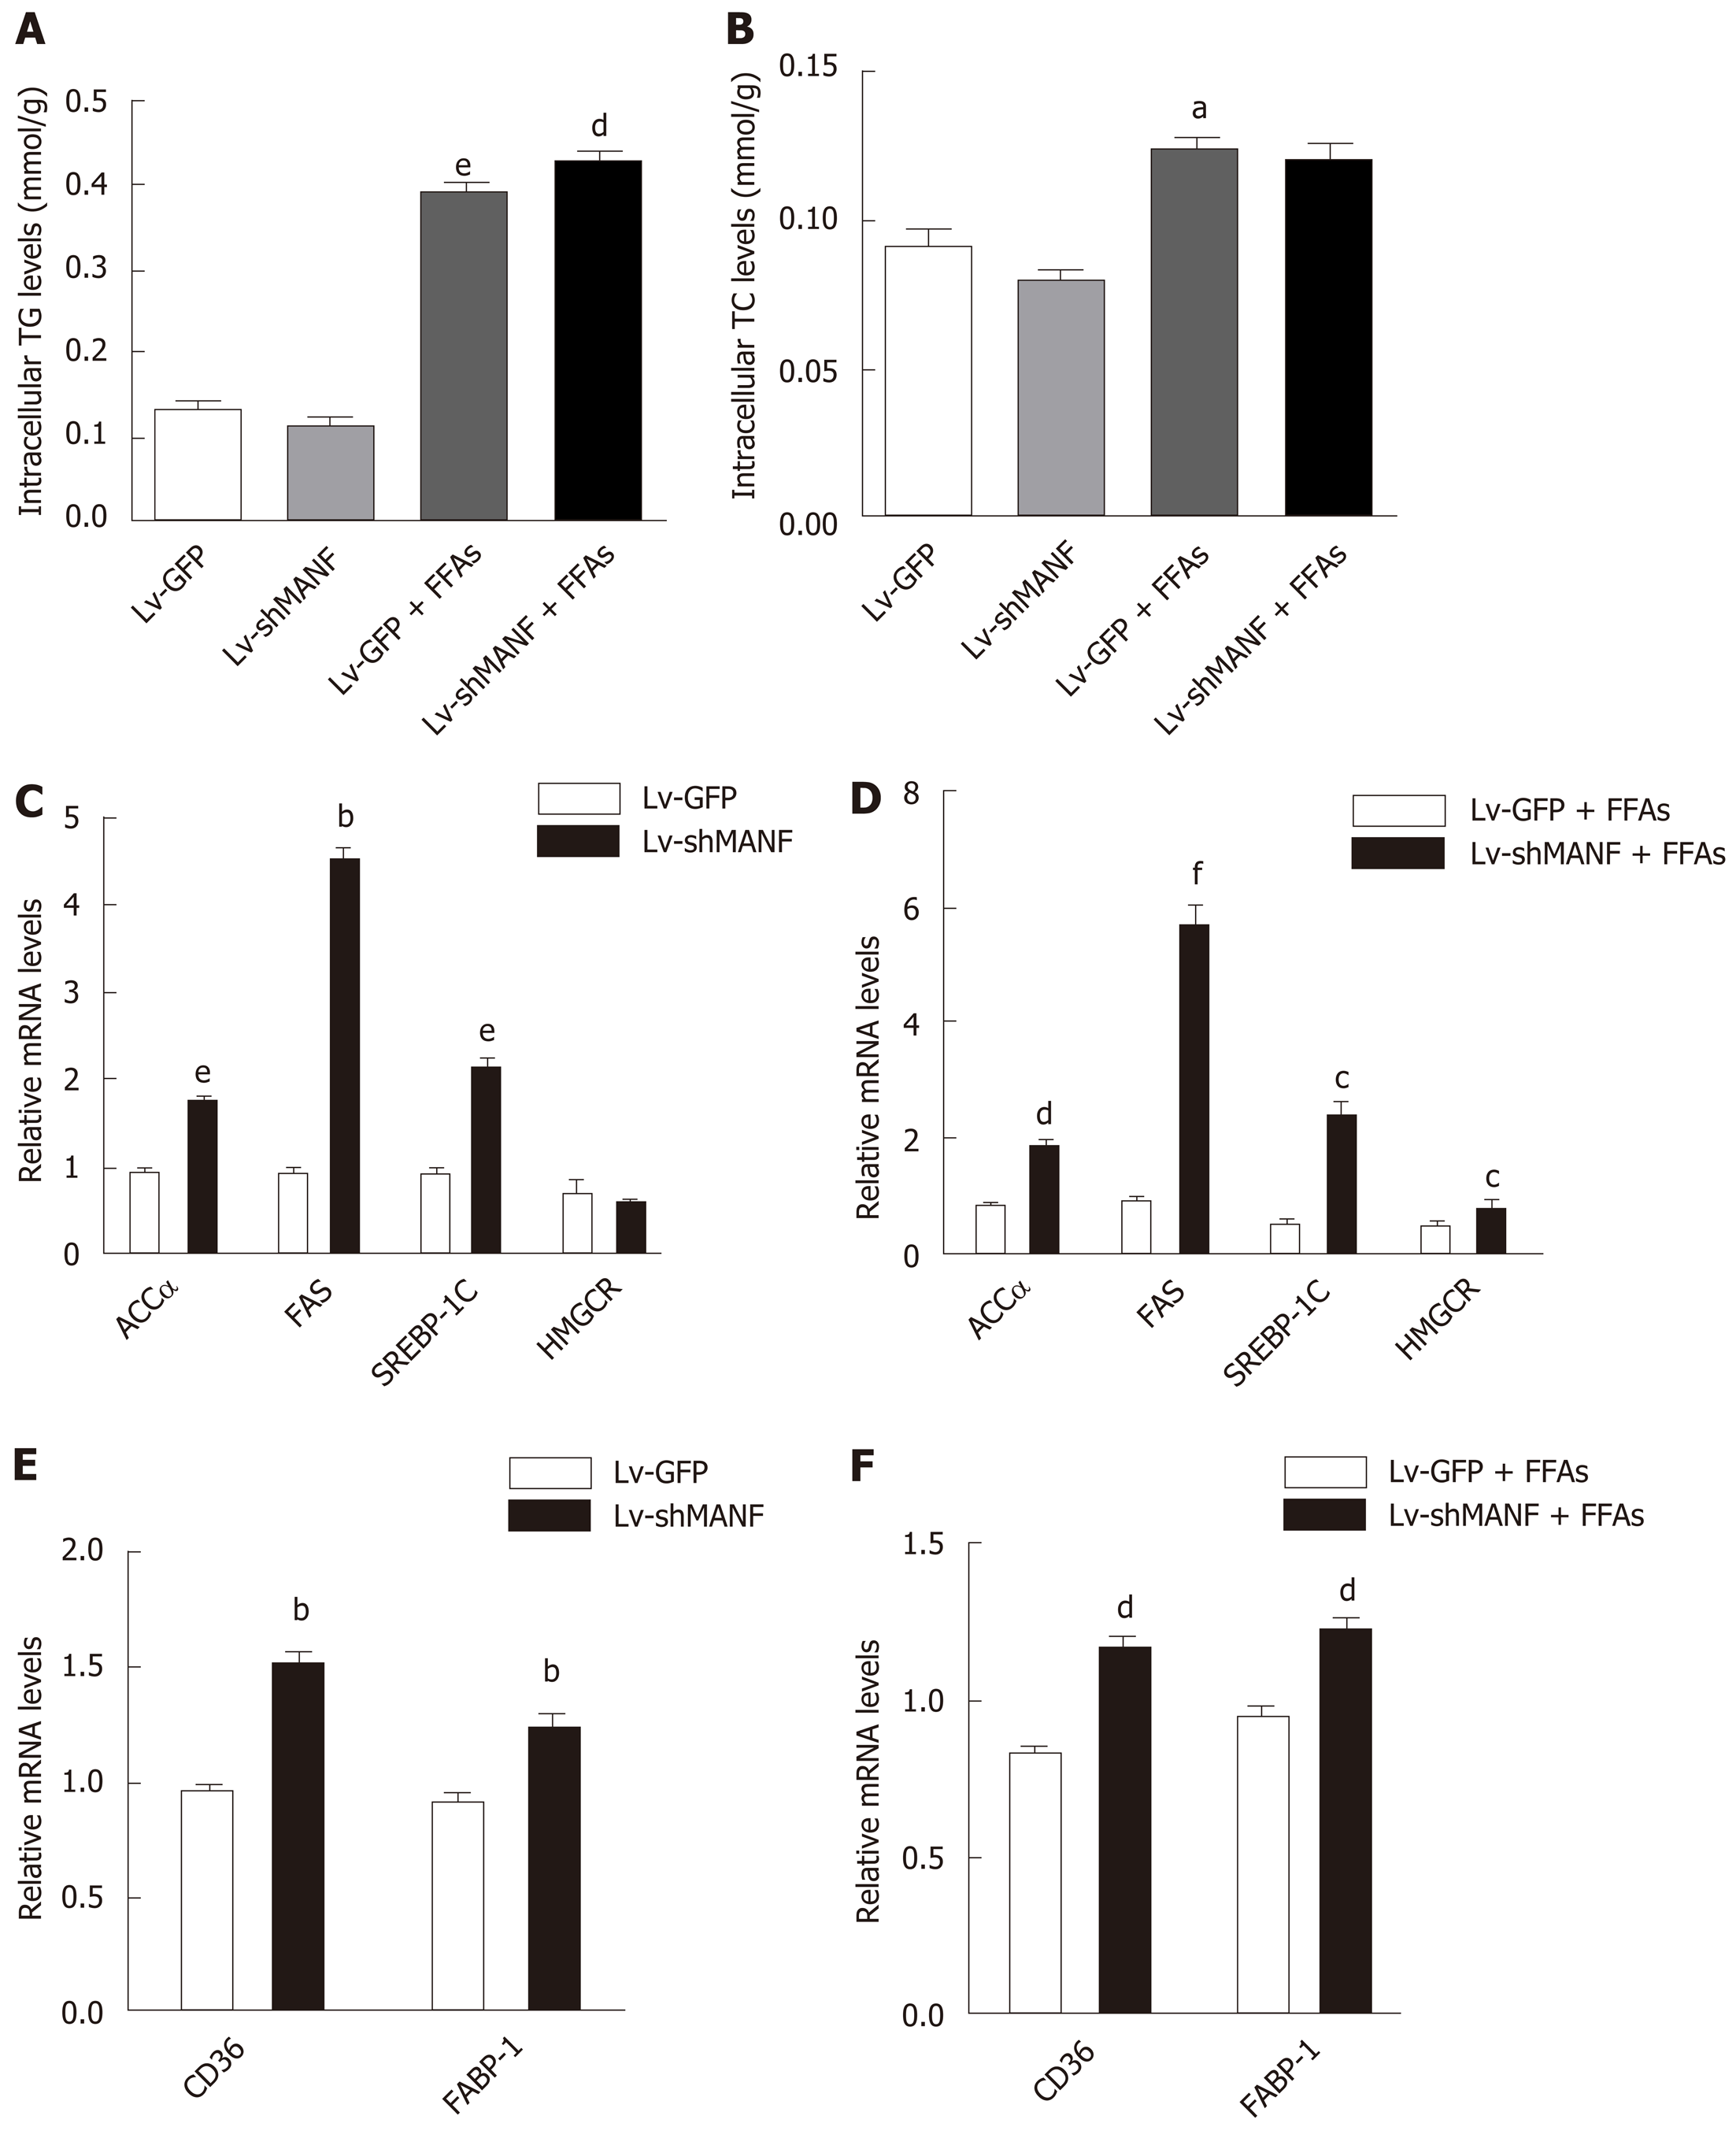
Figure 5 Mesencephalic astrocyte-derived neurotrophic factor knockdown increases lipogenesis.
A and B: The intracellular TG (A) and TC (B) levels of HepG2 cells treated with bovine serum albumin (BSA) or free fatty acids (FFAs) for 72 h, aP < 0.05, eP < 0.001 vs Lv-GFP; dP < 0.01 vs Lv-GFP + FFAs; C and D: The mRNA expression levels of ACCα, FAS, SREBP-1C, and HMGCR in HepG2 cells treated with BSA (C) and with FFAs (D), bP < 0.01, eP < 0.001 vs Lv-GFP; cP <0.05, dP<0.01, fP<0.001 vs Lv-GFP + FFAs; E and F: The mRNA expression of CD36 and FABP-1 in HepG2 cells treated with BSA (E) and with with FFAs (F), bP < 0.01 vs Lv-GFP; dP < 0.01 vs Lv-GFP + FFAs. All data are presented as the mean ± SE. All experiments were repeated three times. MANF: Mesencephalic astrocyte-derived neurotrophic factor; TG: Triglyceride; TC: Total cholesterol; Lv: Lentivirus; Lv-shMANF: Lentivirus expressing short hairpin RNA-targeted MANF; BSA: Bovine serum albumin; FFAs: Free fatty acids; ACCα: Acetyl-CoA carboxylase α; FAS: Fatty acid synthase; SREBP-1C: Sterol regulatory element binding transcription factor 1C; HMGCR: 3-hydroxy3-methylglutaryl coenzyme A reductase; FABP-1: Fatty acid binding protein-1.
- Citation: He M, Wang C, Long XH, Peng JJ, Liu DF, Yang GY, Jensen MD, Zhang LL. Mesencephalic astrocyte-derived neurotrophic factor ameliorates steatosis in HepG2 cells by regulating hepatic lipid metabolism. World J Gastroenterol 2020; 26(10): 1029-1041
- URL: https://www.wjgnet.com/1007-9327/full/v26/i10/1029.htm
- DOI: https://dx.doi.org/10.3748/wjg.v26.i10.1029


