Copyright
©The Author(s) 2019.
World J Gastroenterol. Mar 7, 2019; 25(9): 1100-1115
Published online Mar 7, 2019. doi: 10.3748/wjg.v25.i9.1100
Published online Mar 7, 2019. doi: 10.3748/wjg.v25.i9.1100
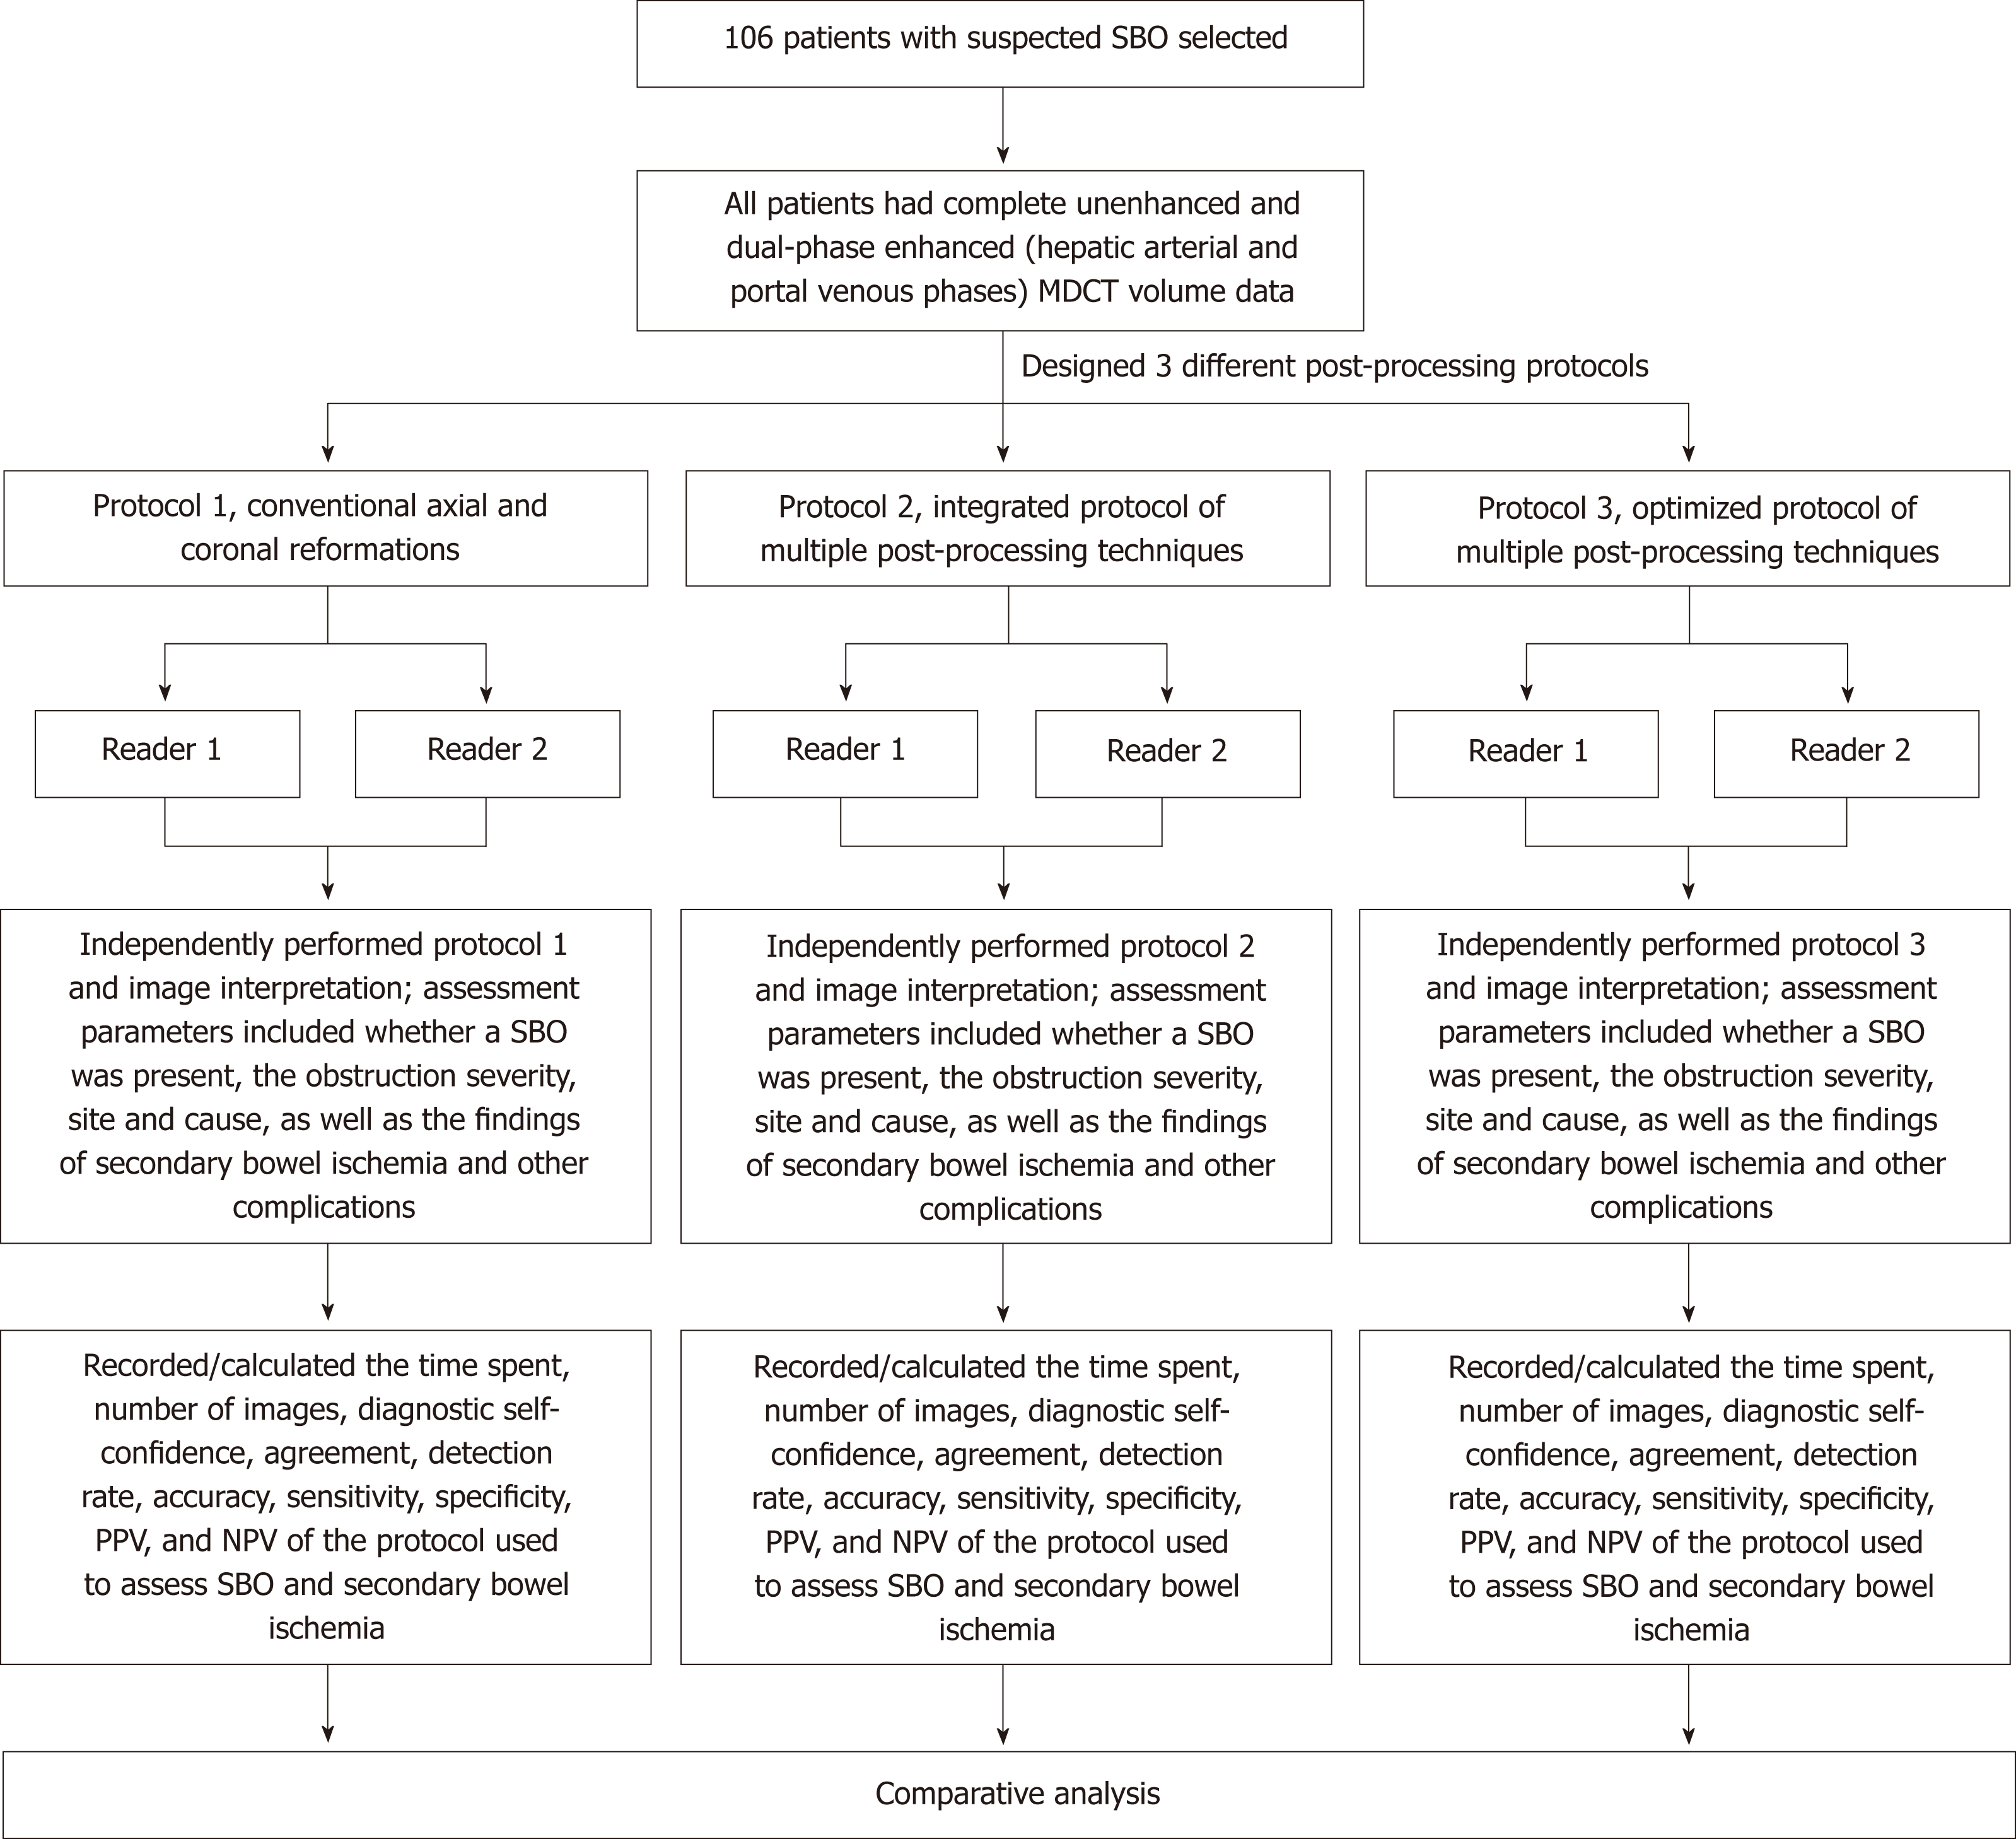
Figure 1 Flow chart showing three protocols for disease assessment in patients with clinically suspected small bowel obstruction.
SBO: Small bowel obstruction; MDCT: Multidetector computed tomography; PPV: Positive predictive value; NPV: Negative predictive value.
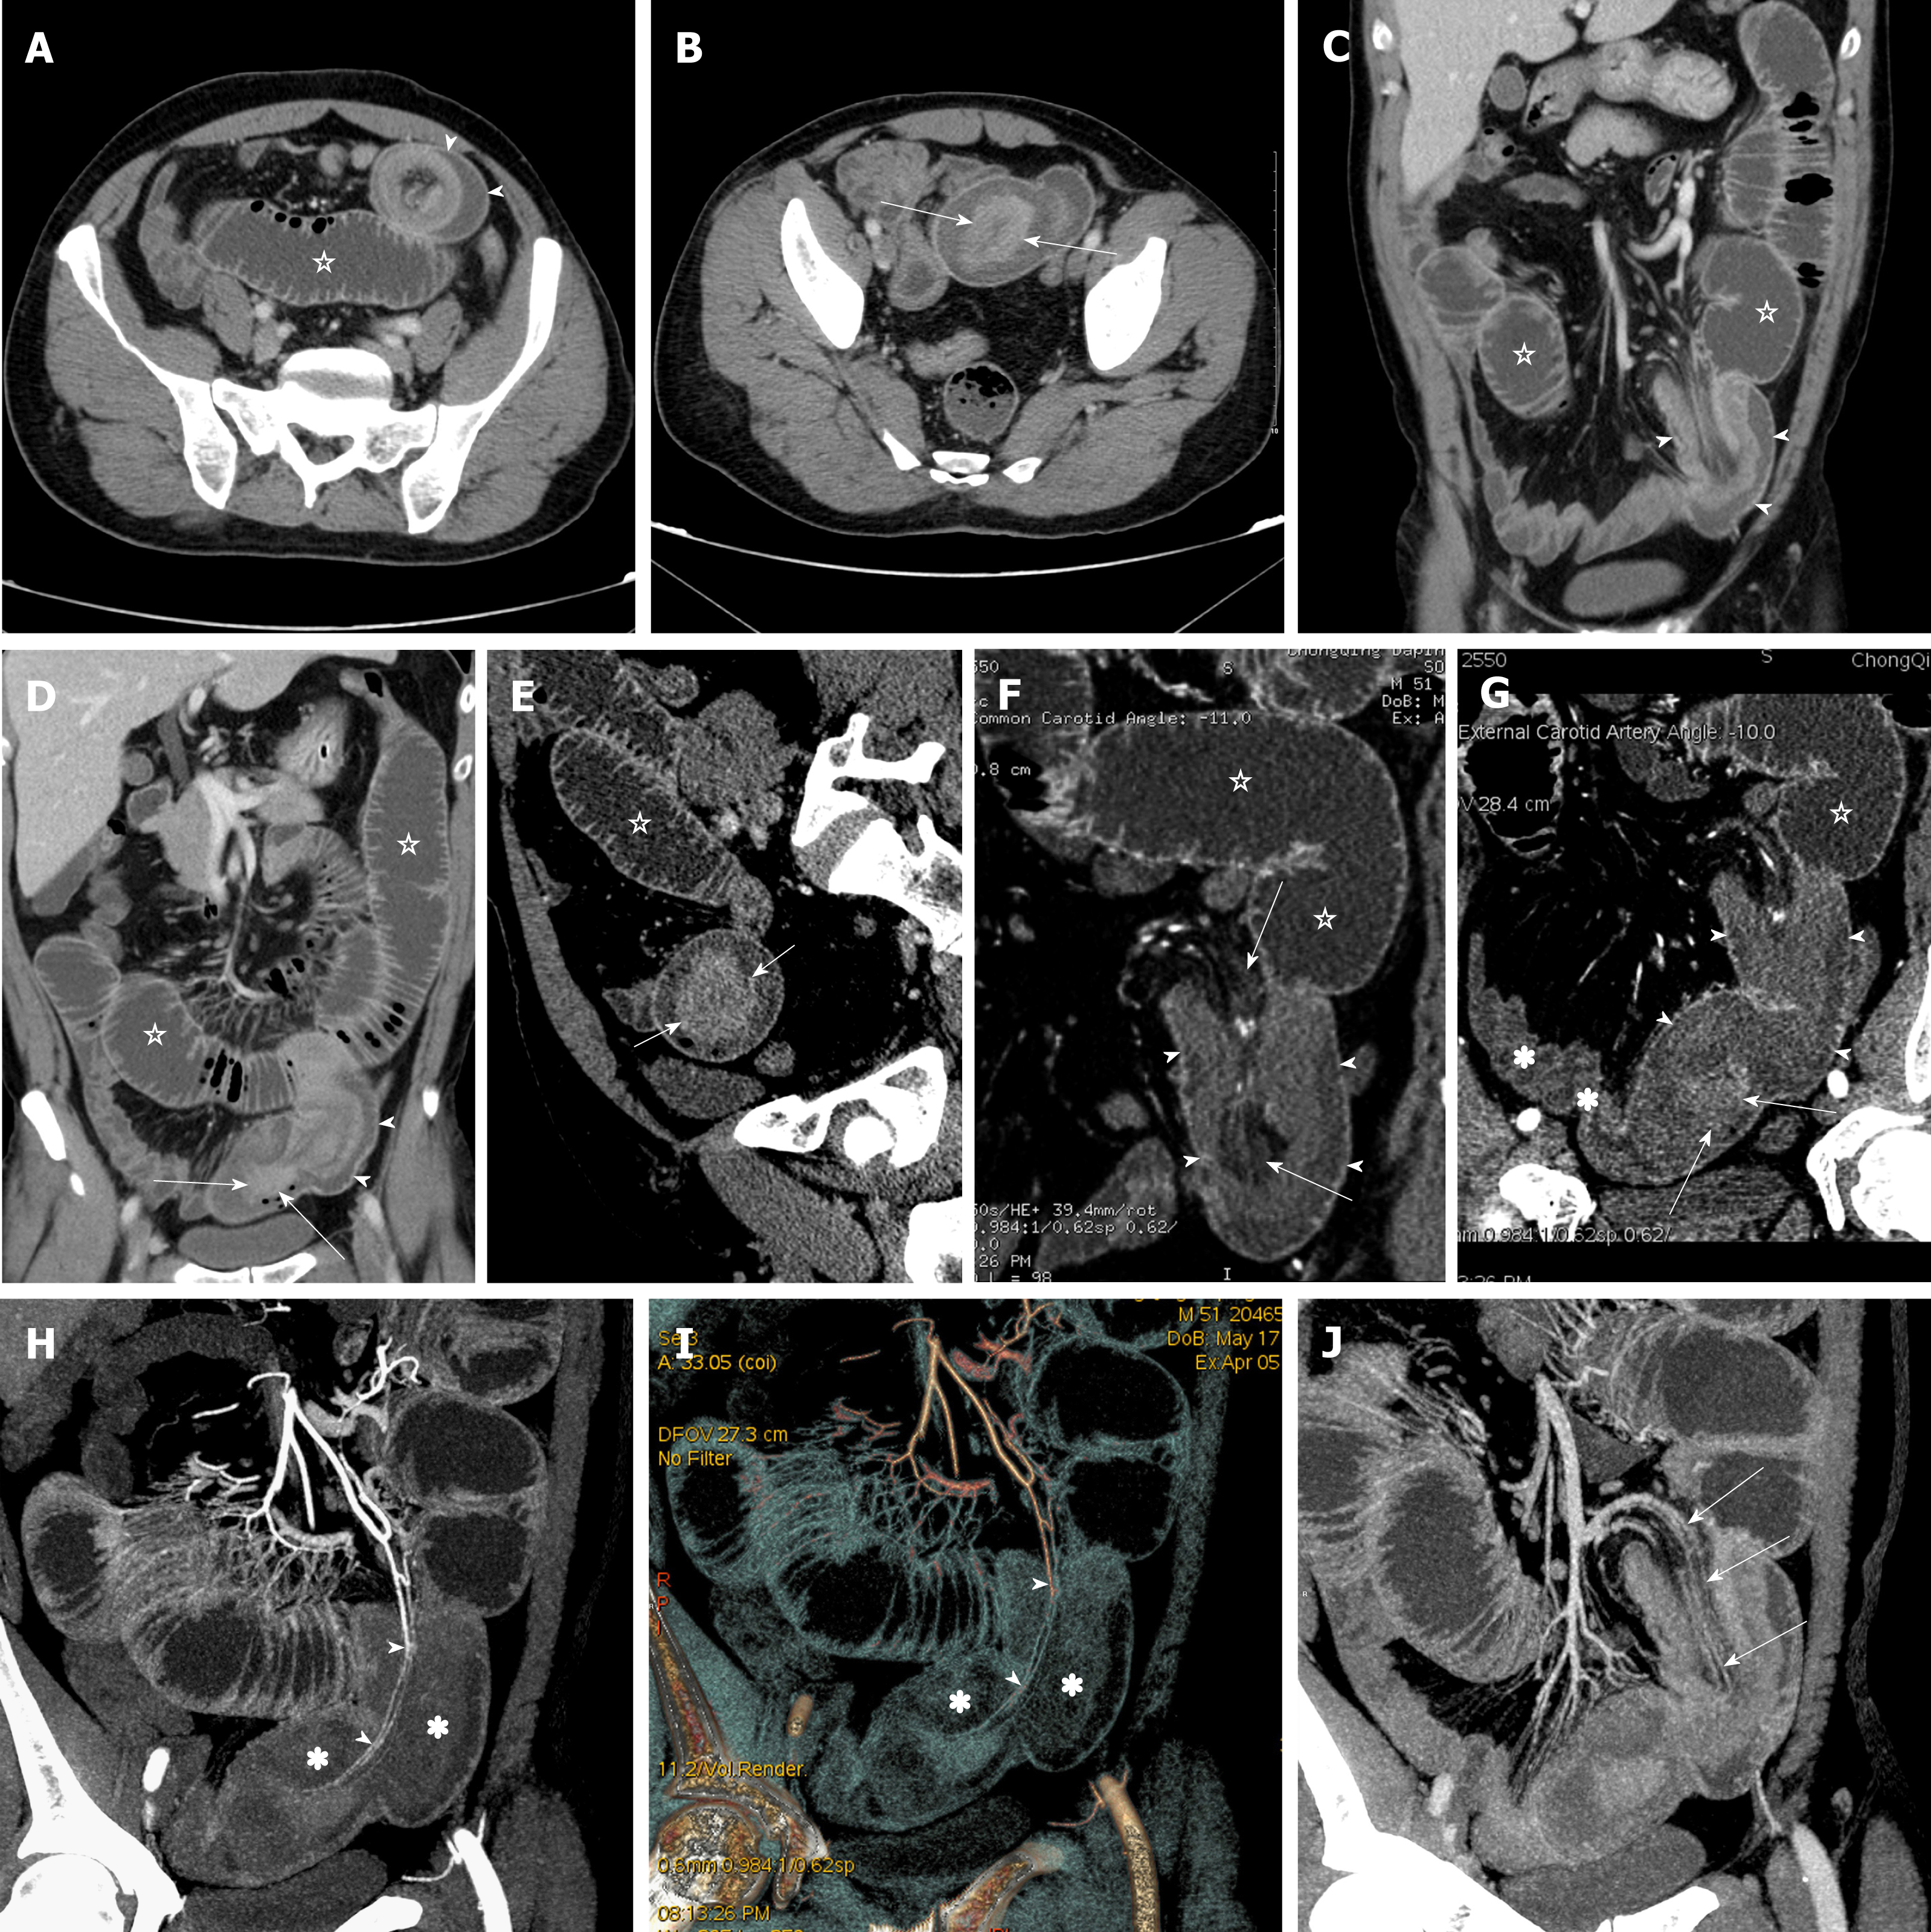
Figure 2 Protocol 2 applied in a 51-year-old man with a gastrointestinal stromal tumor causing intussusception and small bowel obstruction.
A-D: Multidetector computed tomography conventional axial and coronal reformations of the abdomen display a lamellar structure arranged in a concentric circle (arrowheads) and a mass (arrows) with a size of 4.8 cm × 2.9 cm × 1.9 cm at the distal end of the intussusception, and the bowel loops (pentagram) proximal to the intussusception are severely dilated with a maximum diameter of 5.1 cm. E and F: Multi-planar reformation images obtained from any direction and angle could clearly reveal the mass (short arrows), intussusception (arrowheads) and dilated proximal bowel loops (pentagram), and mesenteric haziness (long arrows) in the invaginating mesentery. G: Curved planar reformation image more clearly defining the anatomical relationship among the mass (arrows), intussusception (arrowheads), dilated proximal bowel loops (pentagram), and collapsed distal bowel loops (asterisk). H and I: Maximum intensity projection (MIP) and volume rendering images obtained in the arterial phase clearly showing the invaginating mesenteric artery branches (arrowheads) with superior contrast enhancement, and decreased bowel wall enhancement in the invaginating bowel (asterisk). J: MIP image obtained in the portal venous phase revealing poor contrast enhancement in the invaginating mesenteric veins (arrows) compared with the adjacent mesenteric vein branches. The poor contrast enhancement of the invaginating mesenteric veins and the decreased bowel wall enhancement of the invaginating bowel segment imply the presence of secondary bowel ischemia.
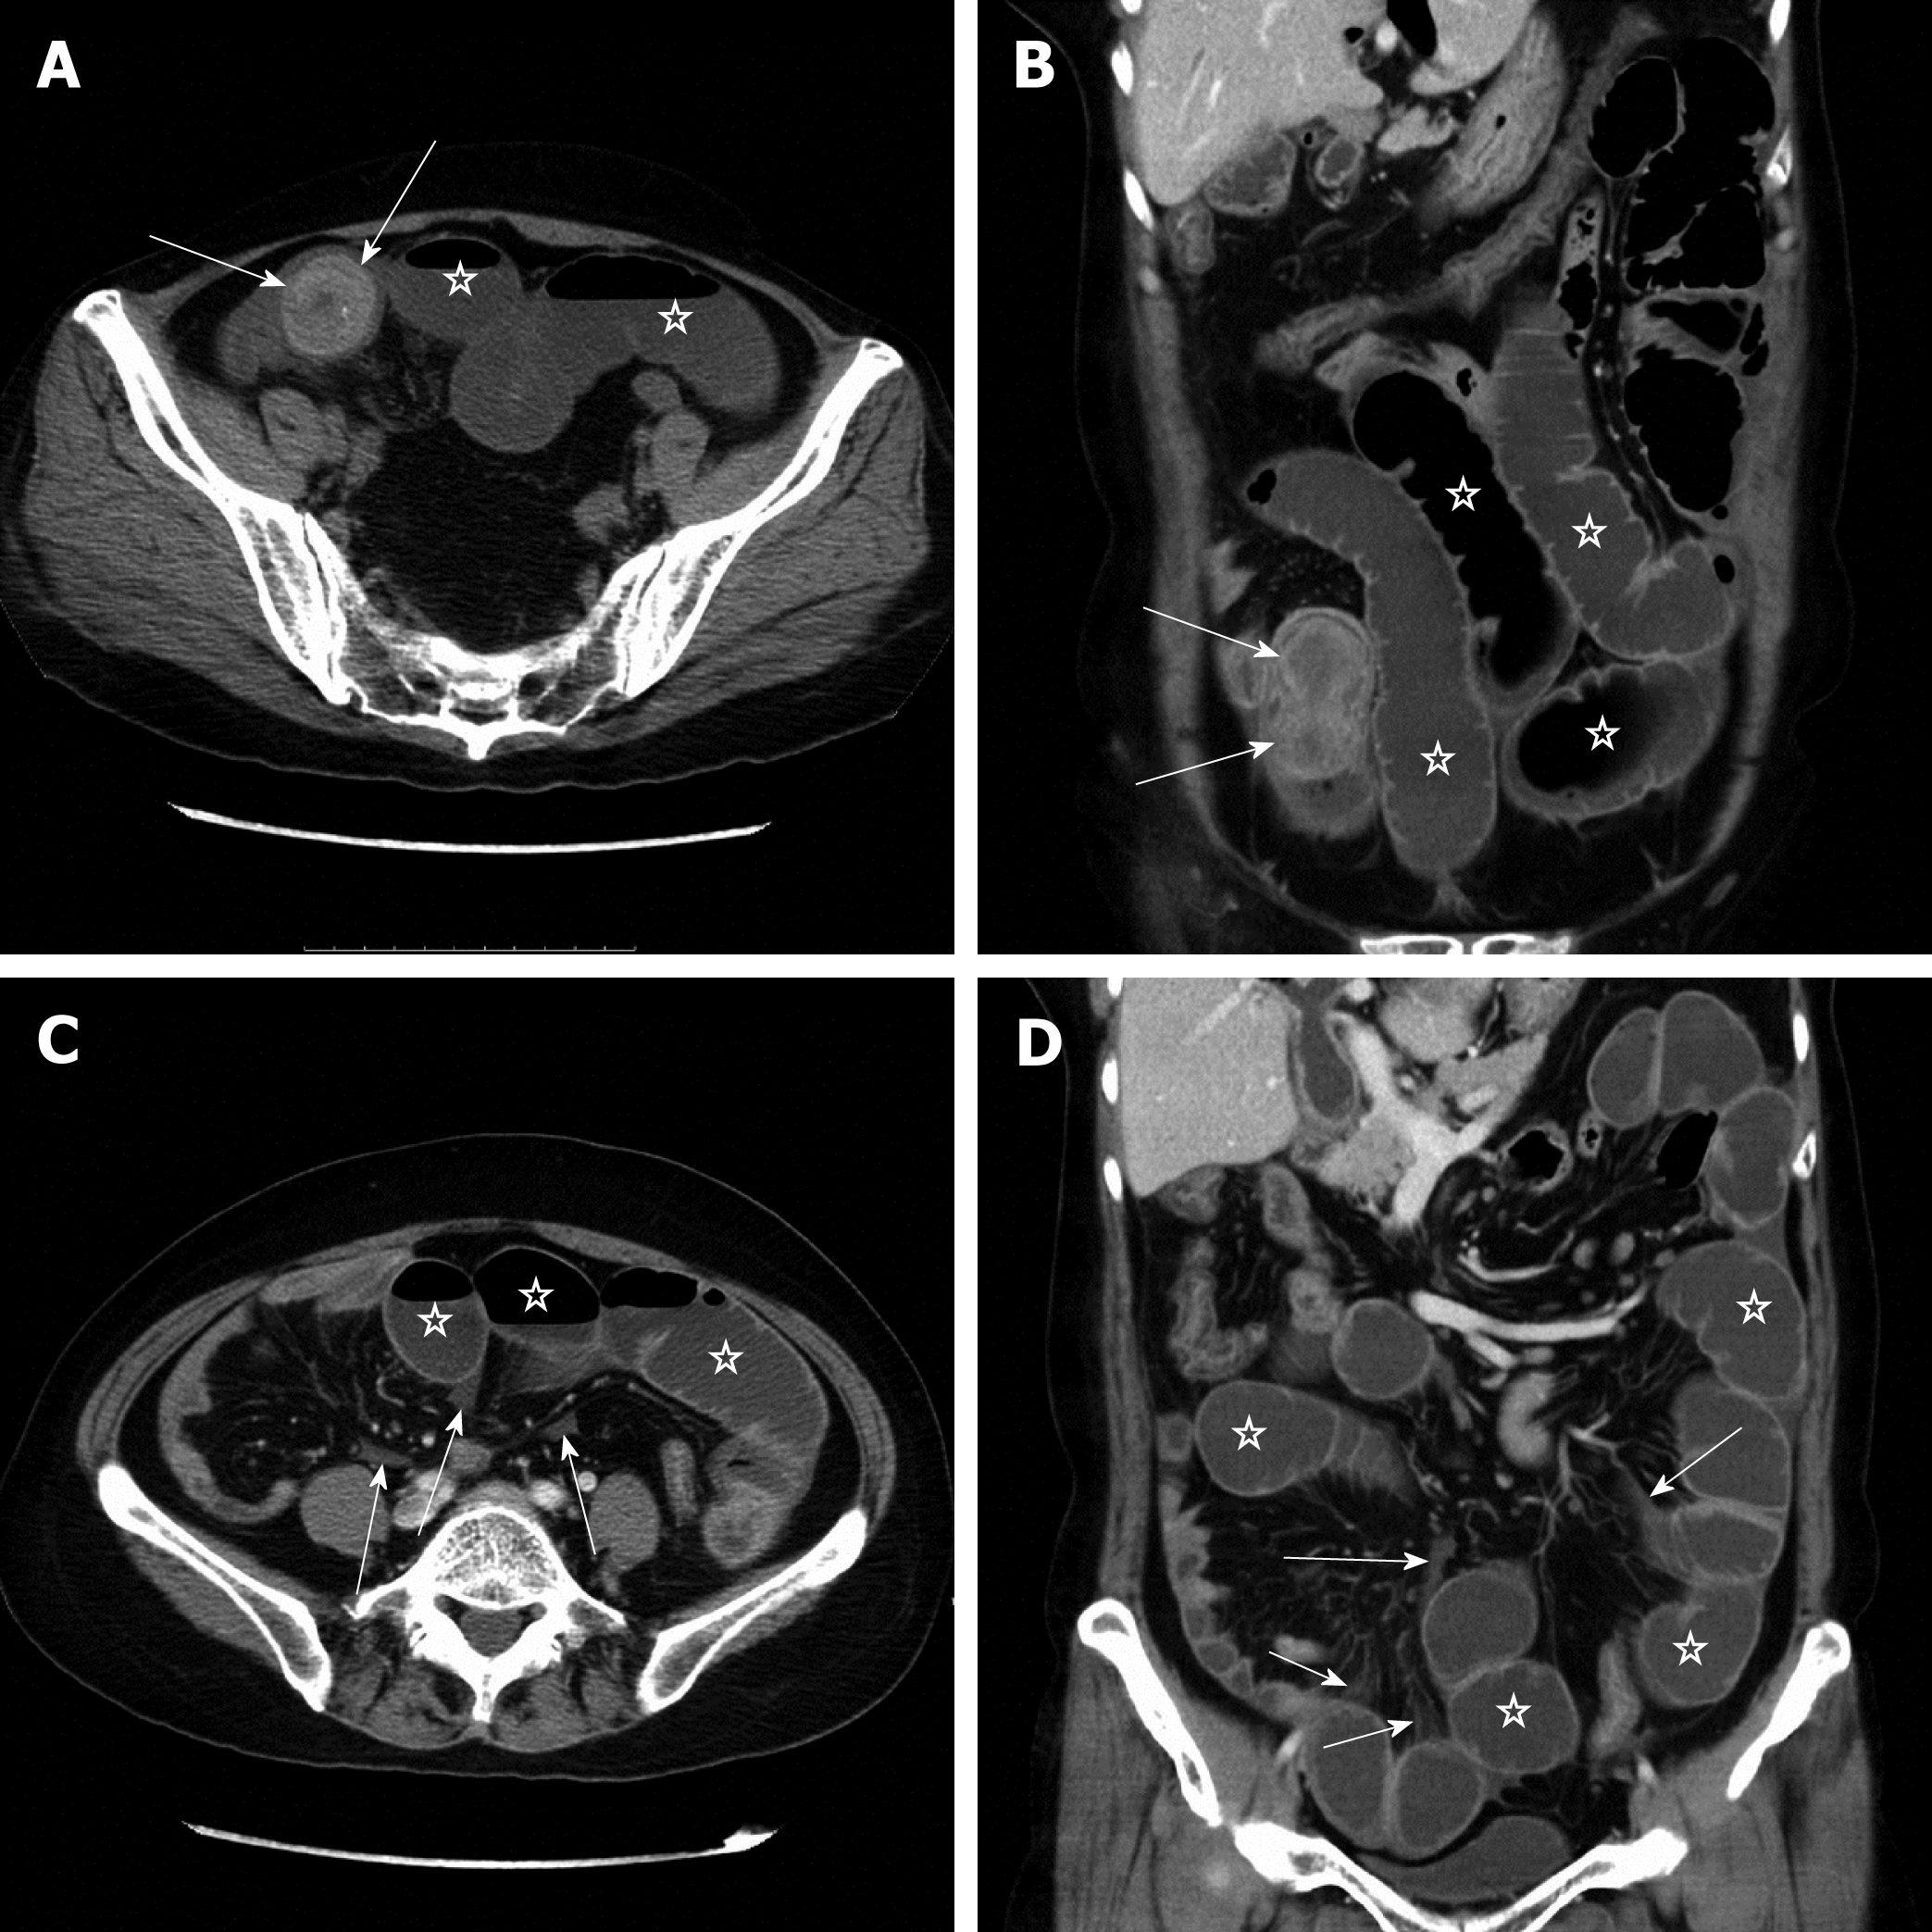
Figure 3 Protocol 3 applied in a 57-year-old woman with a bezoar causing small bowel obstruction.
Because all assessment parameters could be evaluated with high self-confidence and satisfaction using the conventional axial and coronal reformations, the reader did not perform the multiple post-processing techniques. A and B: Multidetector computed tomography (MDCT) axial and coronal images of the abdomen reveal a well-defined, dumbbell-shaped bezoar (arrows) with a size of 5.8 cm × 3.5 cm × 3.5 cm in the distal segment of the small bowel. The bowel loops (pentagram) proximal to the bezoar are severely dilated with a maximum diameter of 4.5 cm. C and D: Additional MDCT axial and coronal images indicate small patchy mesenteric haziness and fluid (arrows), as well as the dilated bowel loops (pentagram), but no more signs of secondary bowel ischemia were found in the patient.
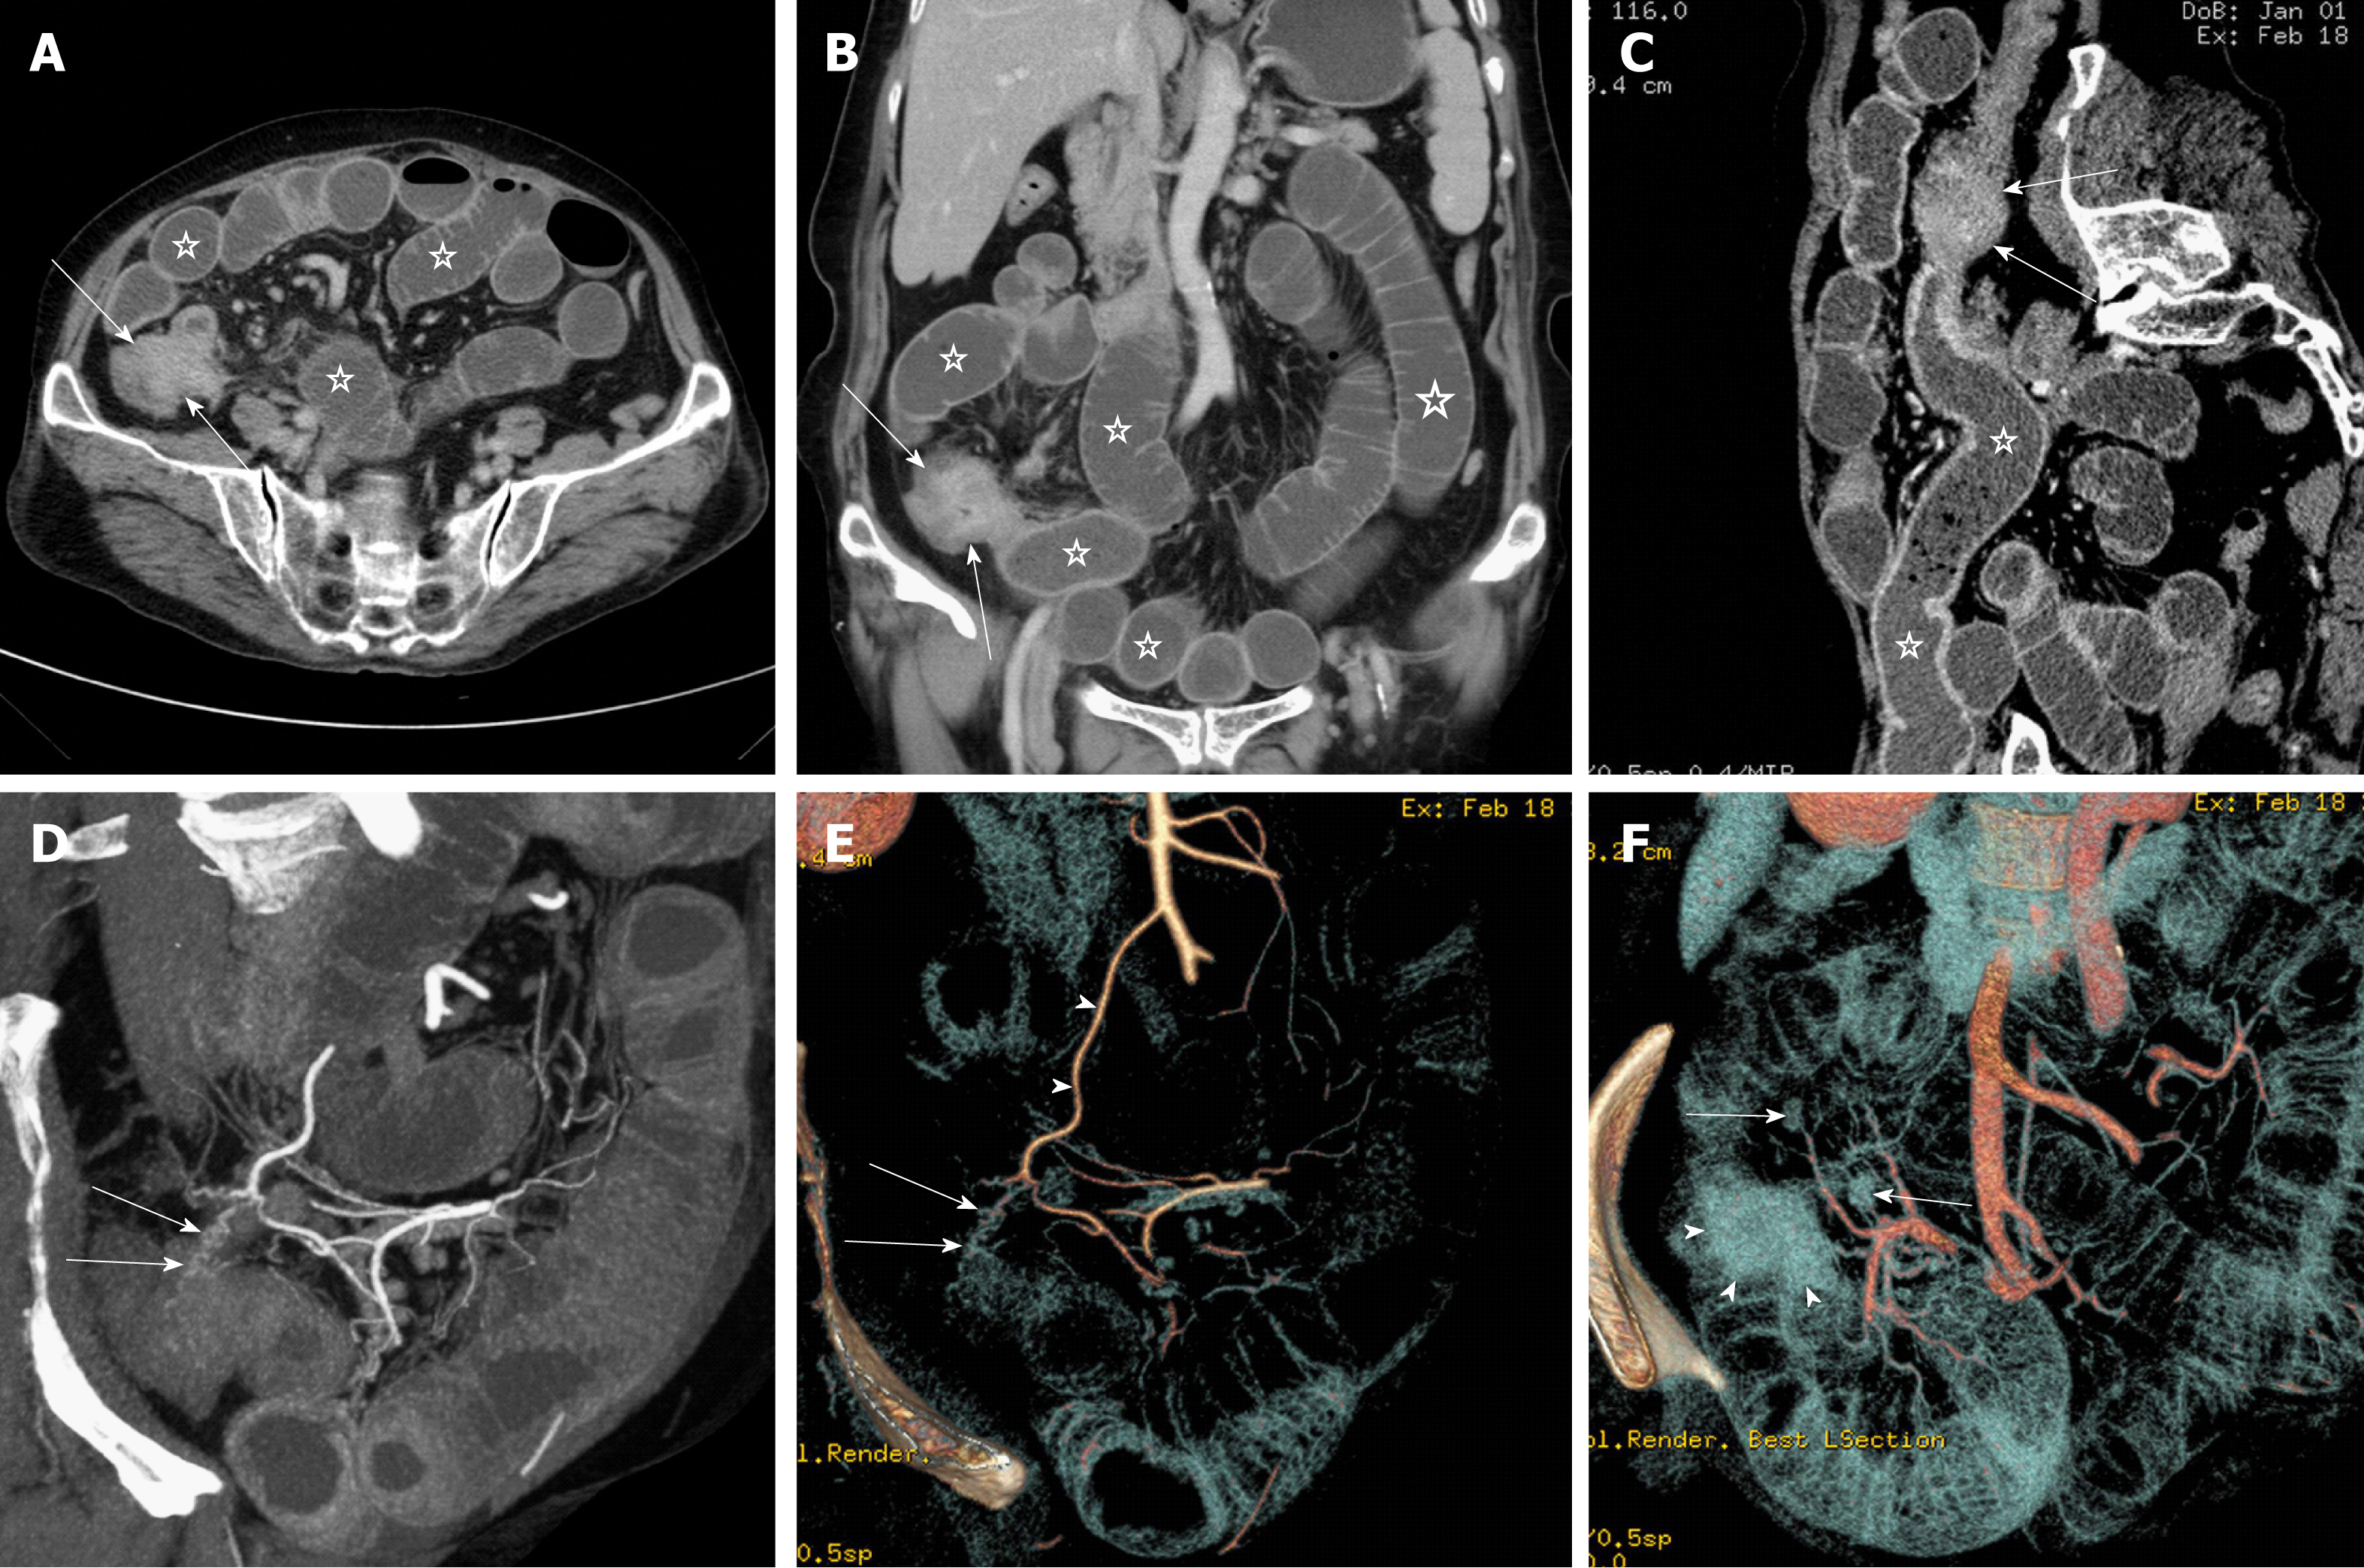
Figure 4 Protocol 3 applied in a 72-year-old woman with an adenocarcinoma at the end of the small bowel causing small bowel obstruction.
Because it was difficult to identify the relationship between the mass and the dilated small bowel loops by conventional axial and coronal reformations, the reader selectively performed multiple post-processing techniques. A and B: Multidetector computed tomography axial and coronal images of the abdomen reveal an irregular, obviously enhanced mass (arrows) with a size of 4.4 cm × 4.2 cm × 3.7 cm in the right lower abdomen, and the small bowel loops (pentagram) in the abdominal cavity are moderately dilated with a maximum diameter of 3.6 cm. C: Curved planar reformation image clearly shows the location of the mass (arrows), dilated proximal bowel loops (pentagram), and collapsed distal bowel loops (arrowheads). D and E: Maximum intensity projection and volume rendering (VR) images obtained in the arterial phase indicate the mass with distorted and enlarged neovascular structures (arrows) arising from the ileocolic branch (arrowheads) of the superior mesenteric artery. F: VR image obtained in the portal venous phase reveals an obviously stained mass (arrowheads) and lymph nodes (arrows) in the adjacent mesentery.
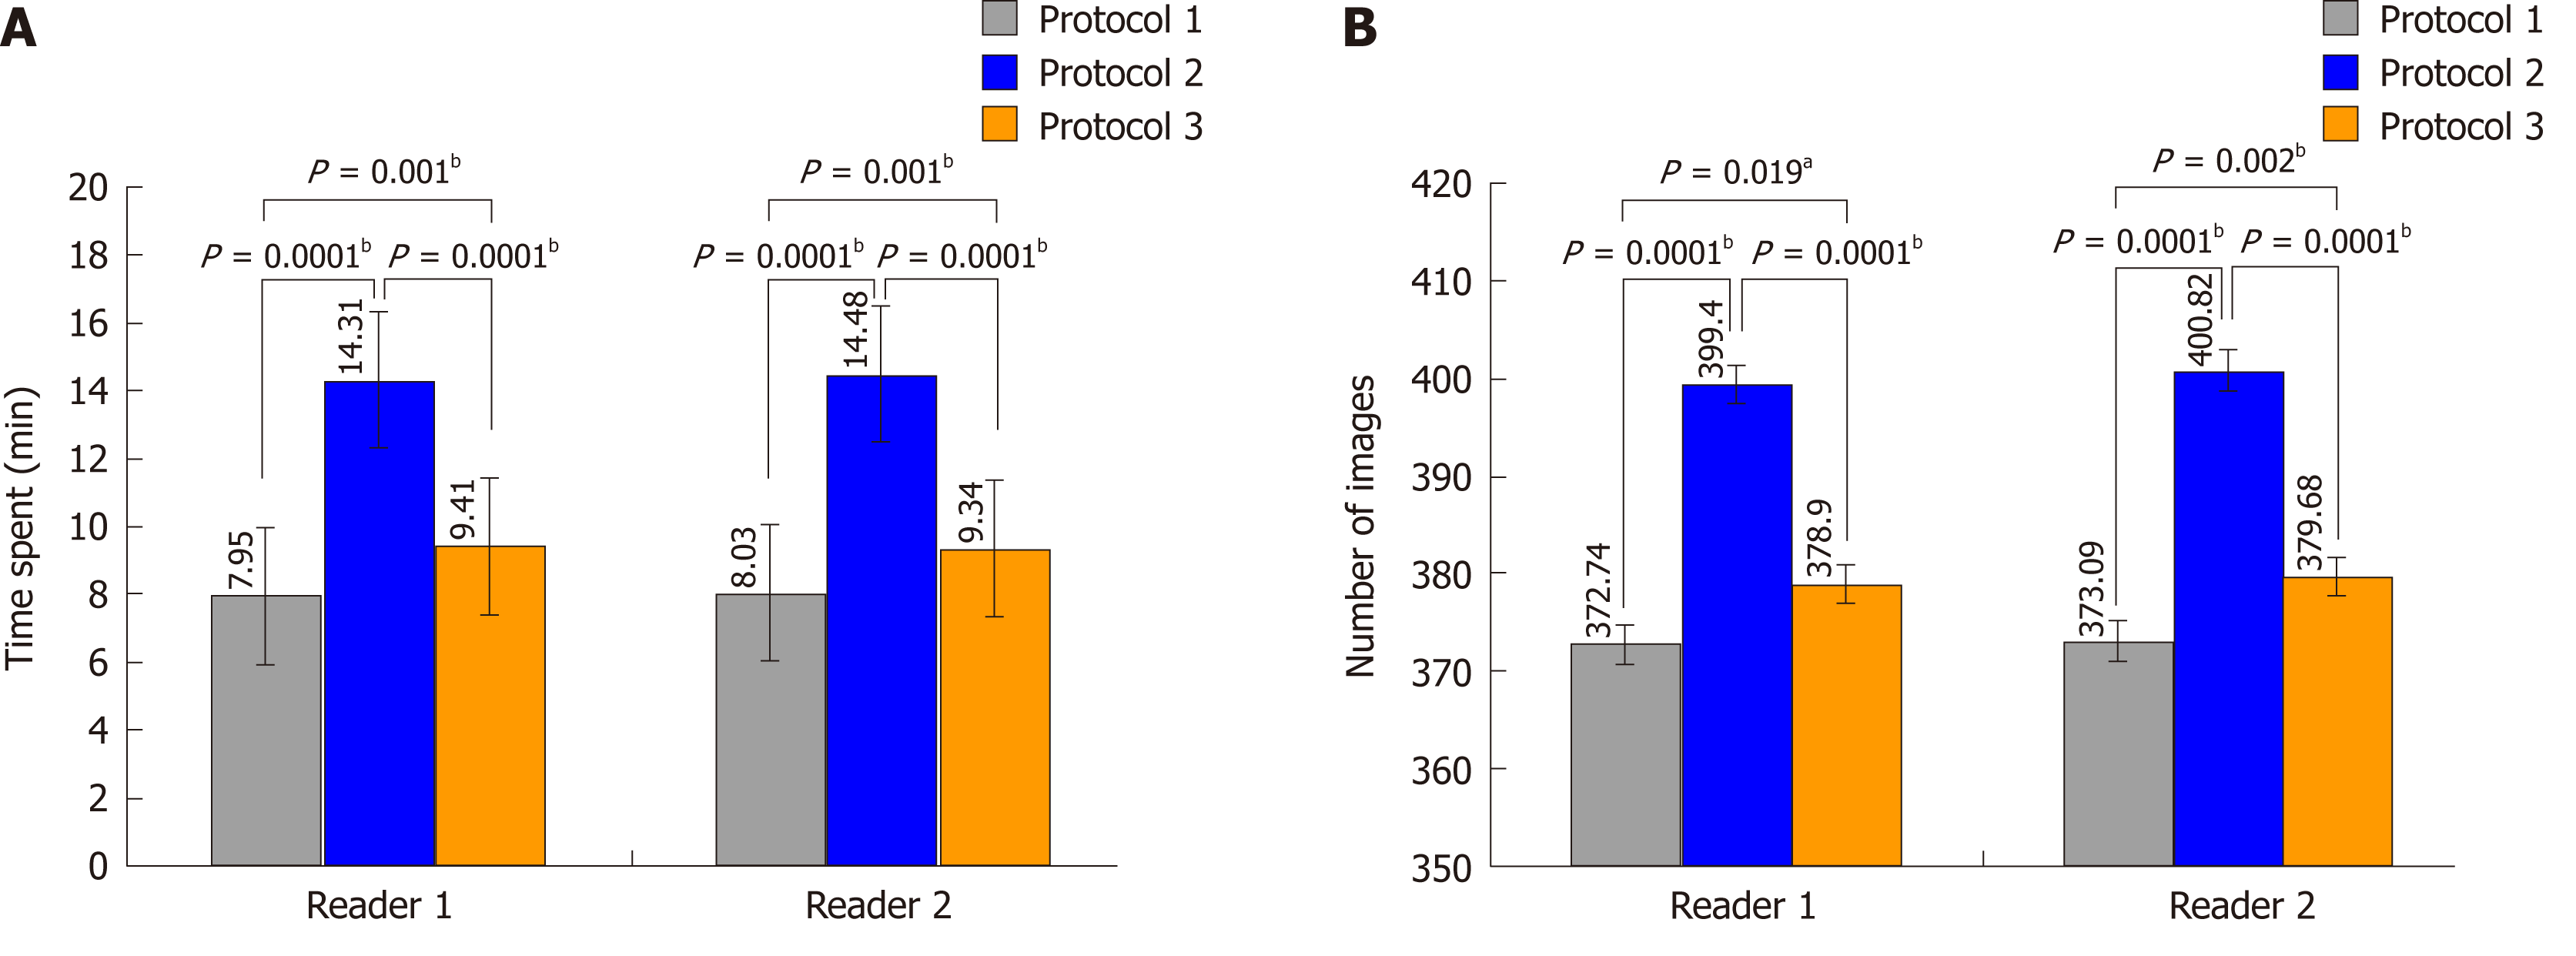
Figure 5 Graphs showing (A) time spent and (B) number of images used for three protocols for disease assessment in patients with clinically suspected small bowel obstruction.
Student’s t test and one-way analysis of variance were used to compare the mean of each result in both the inter and intrareader data sets. aP < 0.05, bP < 0.01.
- Citation: Kuang LQ, Tang W, Li R, Cheng C, Tang SY, Wang Y. Optimized protocol of multiple post-processing techniques improves diagnostic accuracy of multidetector computed tomography in assessment of small bowel obstruction compared with conventional axial and coronal reformations. World J Gastroenterol 2019; 25(9): 1100-1115
- URL: https://www.wjgnet.com/1007-9327/full/v25/i9/1100.htm
- DOI: https://dx.doi.org/10.3748/wjg.v25.i9.1100


