Copyright
©The Author(s) 2019.
World J Gastroenterol. Feb 28, 2019; 25(8): 1012-1023
Published online Feb 28, 2019. doi: 10.3748/wjg.v25.i8.1012
Published online Feb 28, 2019. doi: 10.3748/wjg.v25.i8.1012
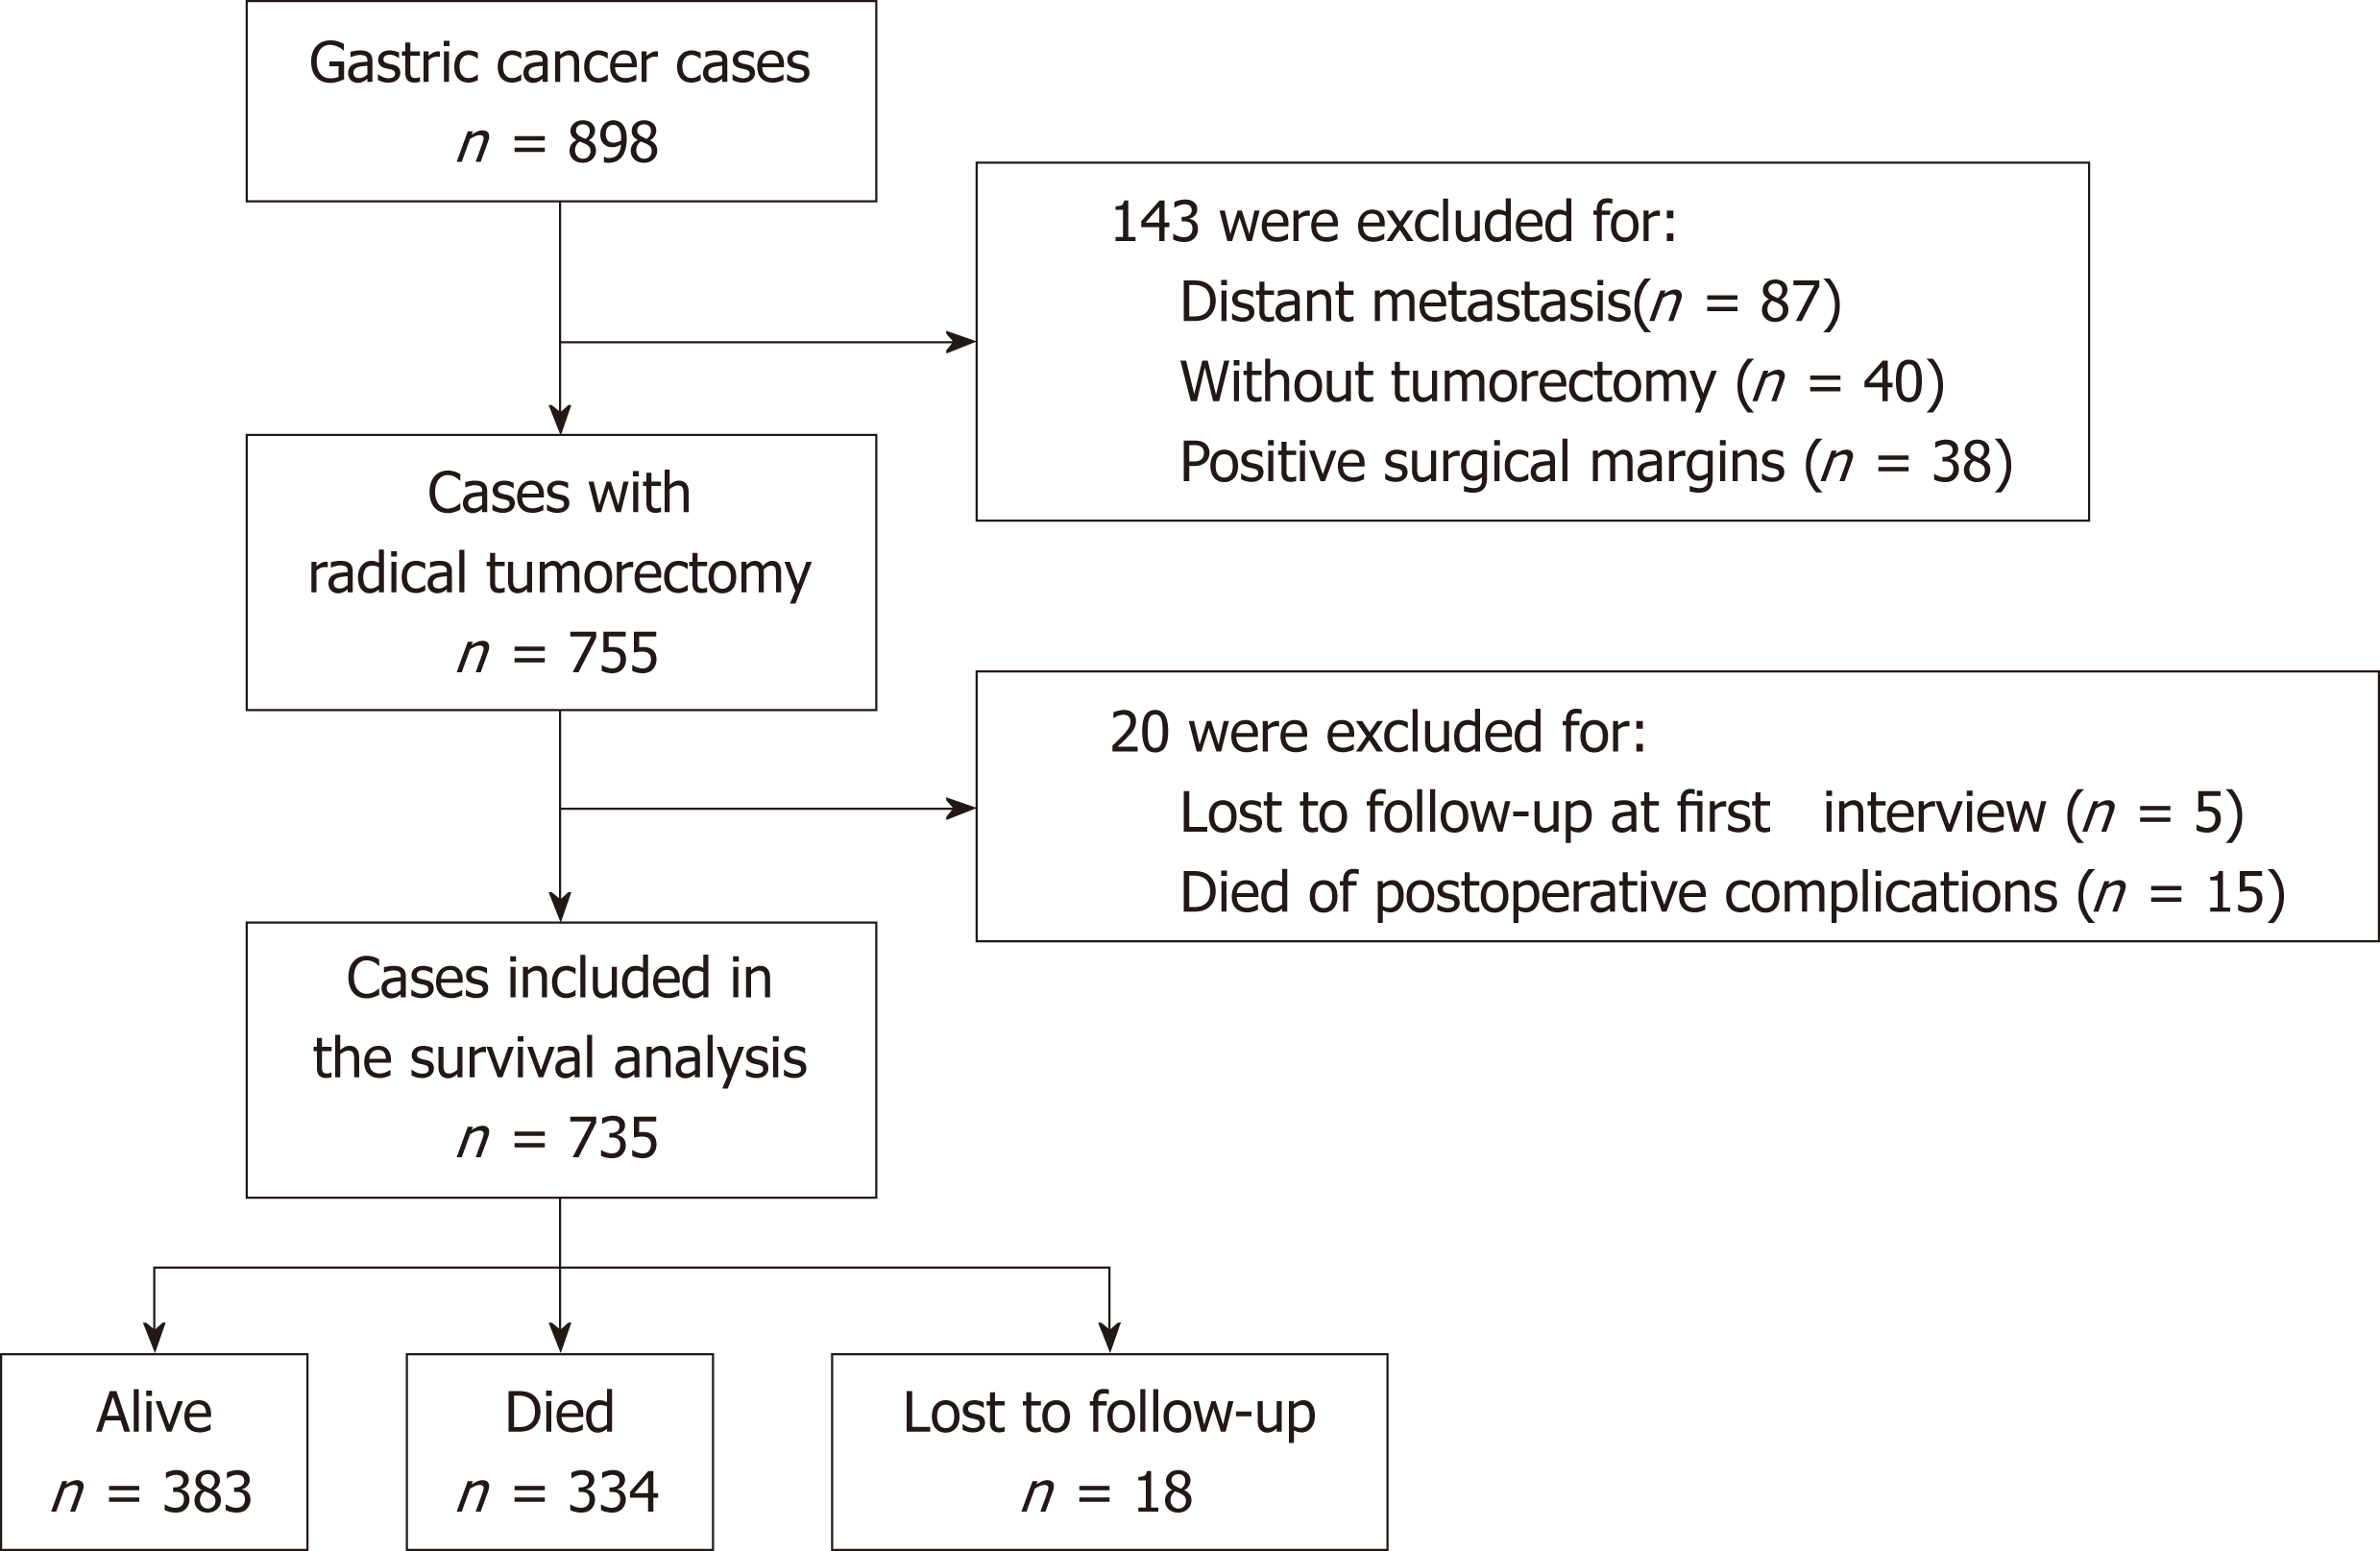
Figure 1 The flow chart of patients included in the survival analysis.
Figure 2 Survival plot of gastric cancer patients stratified by rs10889677 genotypes.
Compared with the survival of patients with no C allele of rs10889677 (genotype A/A, blue line), patients with one C allele (genotype C/A, red line) exhibited a decreased survival rate and patients with two C alleles (genotype C/C, cyan line) exhibited the lowest survival rate.
- Citation: Jia ZF, Cao DH, Wu YH, Jin MS, Pan YC, Cao XY, Jiang J. Lethal-7-related polymorphisms are associated with susceptibility to and prognosis of gastric cancer. World J Gastroenterol 2019; 25(8): 1012-1023
- URL: https://www.wjgnet.com/1007-9327/full/v25/i8/1012.htm
- DOI: https://dx.doi.org/10.3748/wjg.v25.i8.1012


