Copyright
©The Author(s) 2019.
World J Gastroenterol. Feb 21, 2019; 25(7): 808-823
Published online Feb 21, 2019. doi: 10.3748/wjg.v25.i7.808
Published online Feb 21, 2019. doi: 10.3748/wjg.v25.i7.808
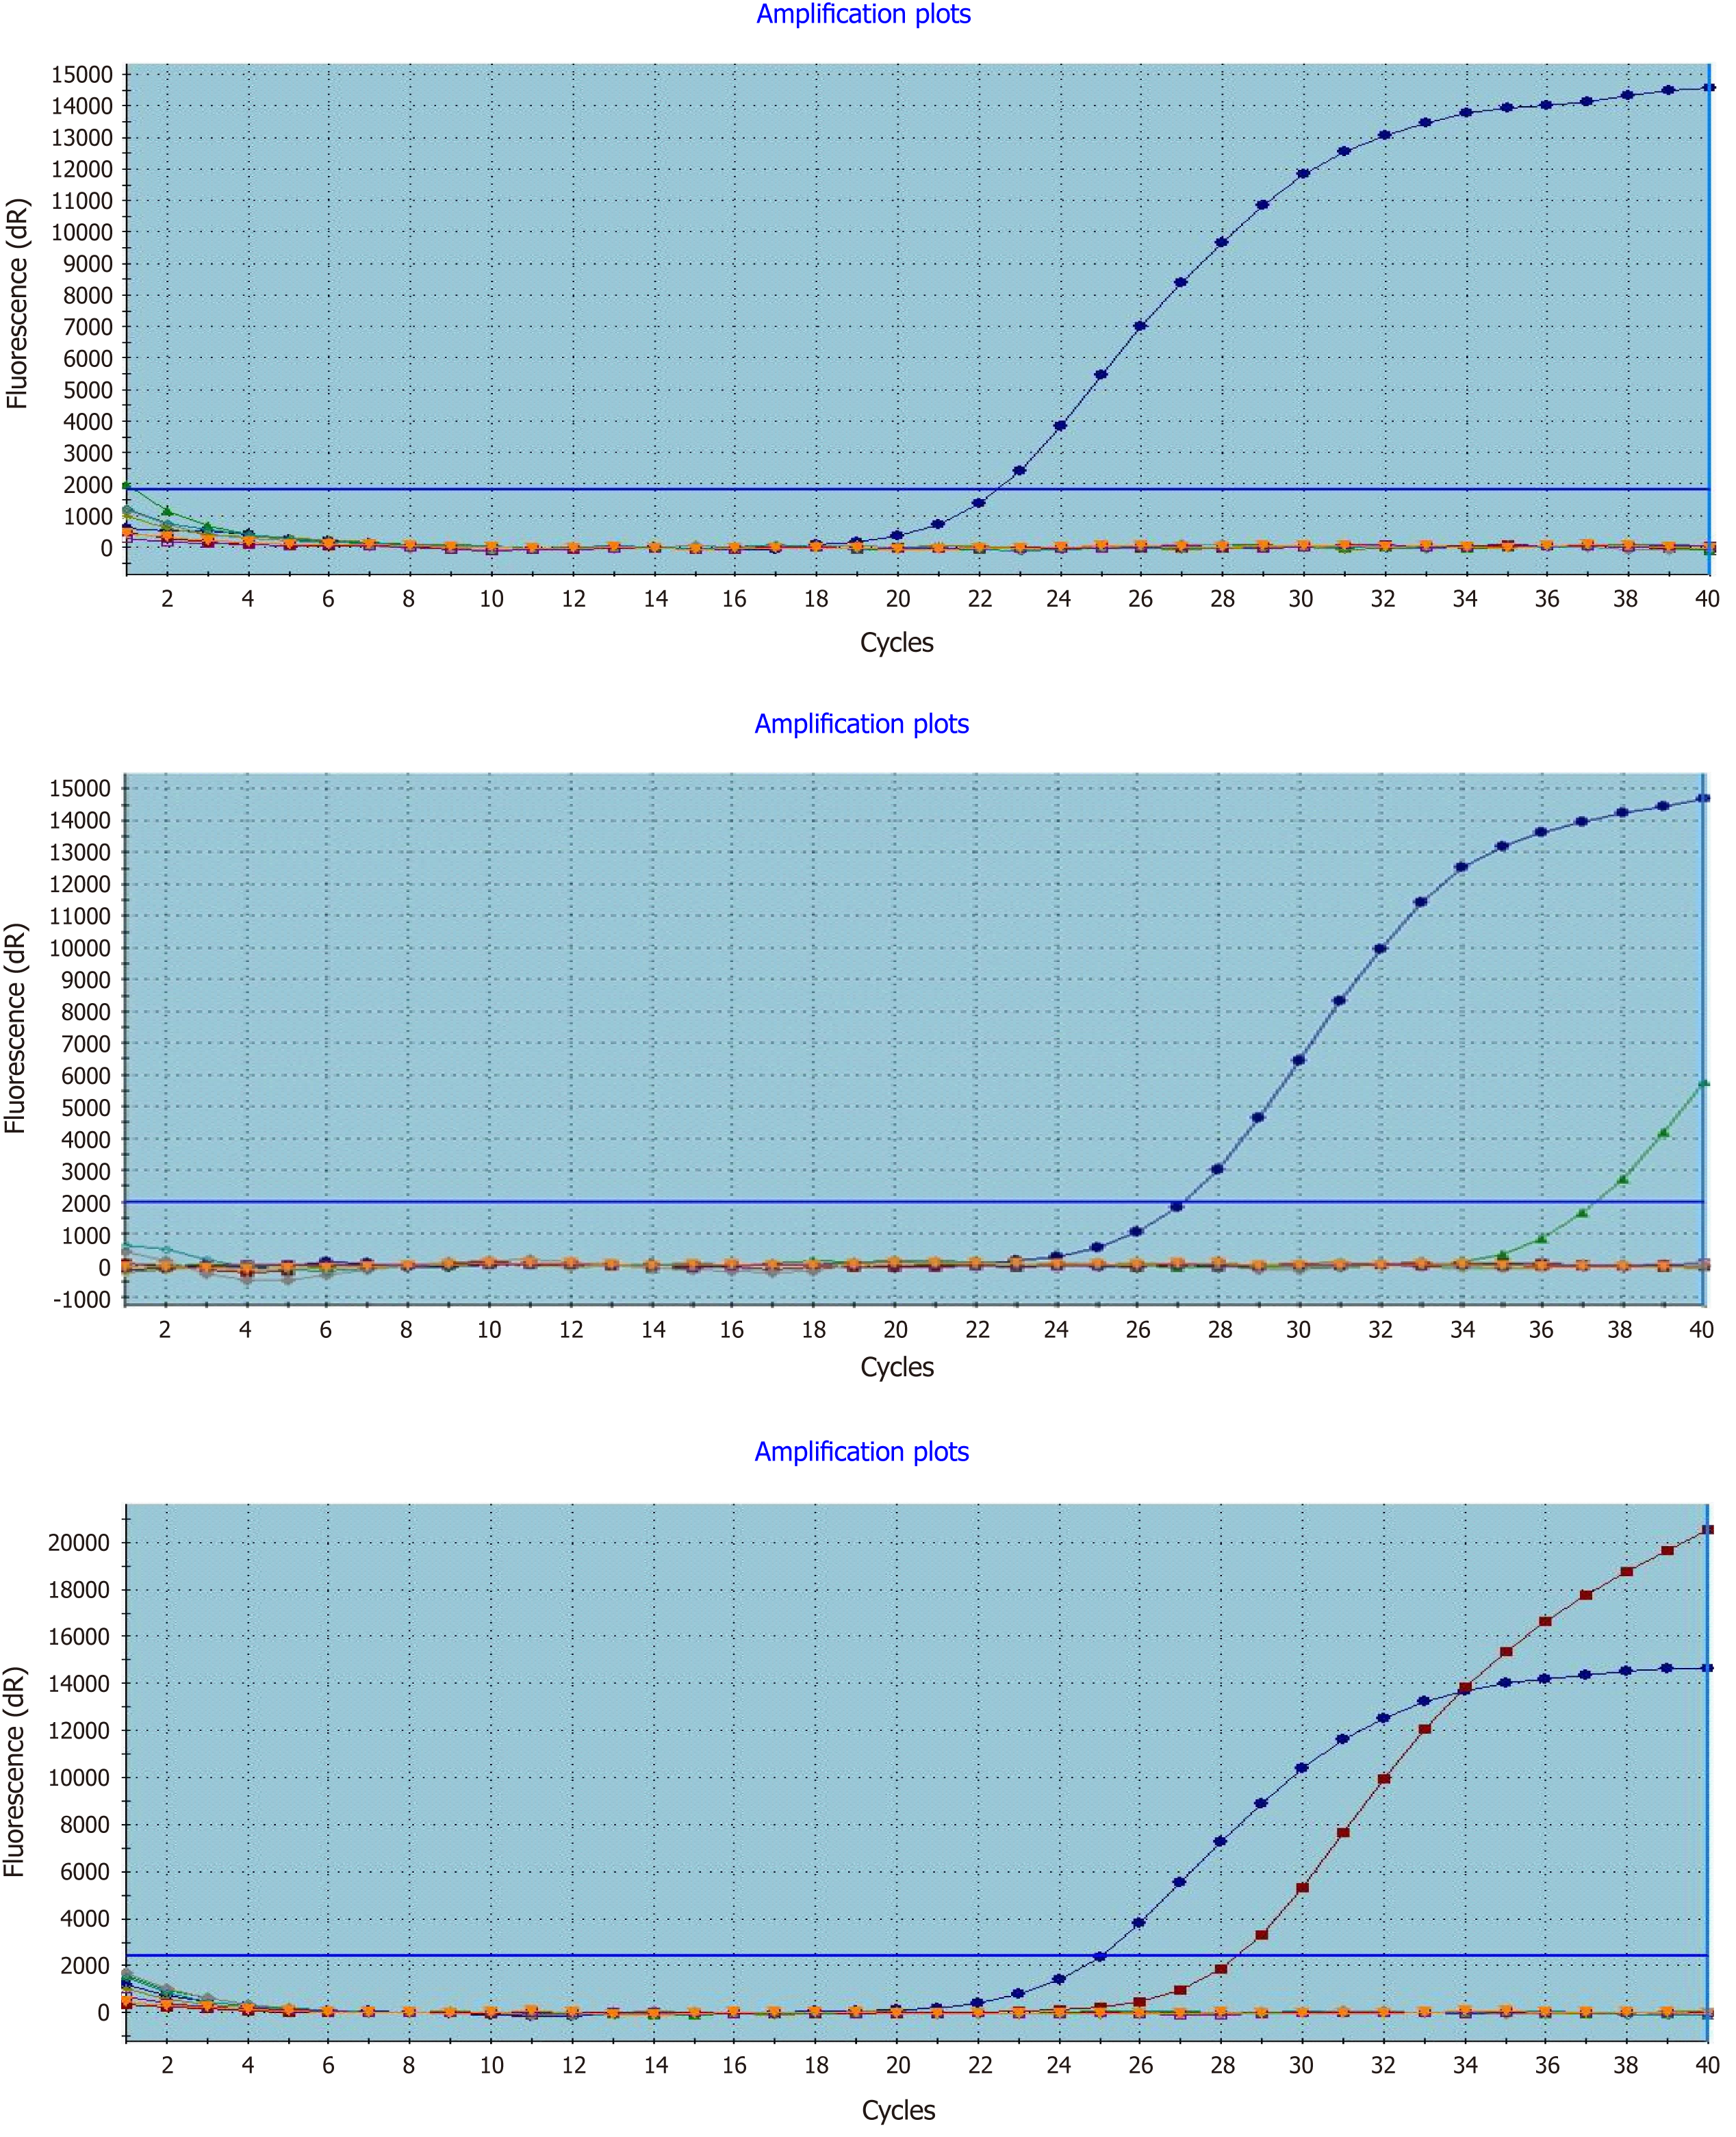
Figure 1 Real-time polymerase chain reaction detection of mutated KRAS in formalin-fixed paraffin-embedded colorectal cancer tissues.
Left to right representative amplification plots for samples with wild-type, uncertain mutation status, and mutated KRAS genes.
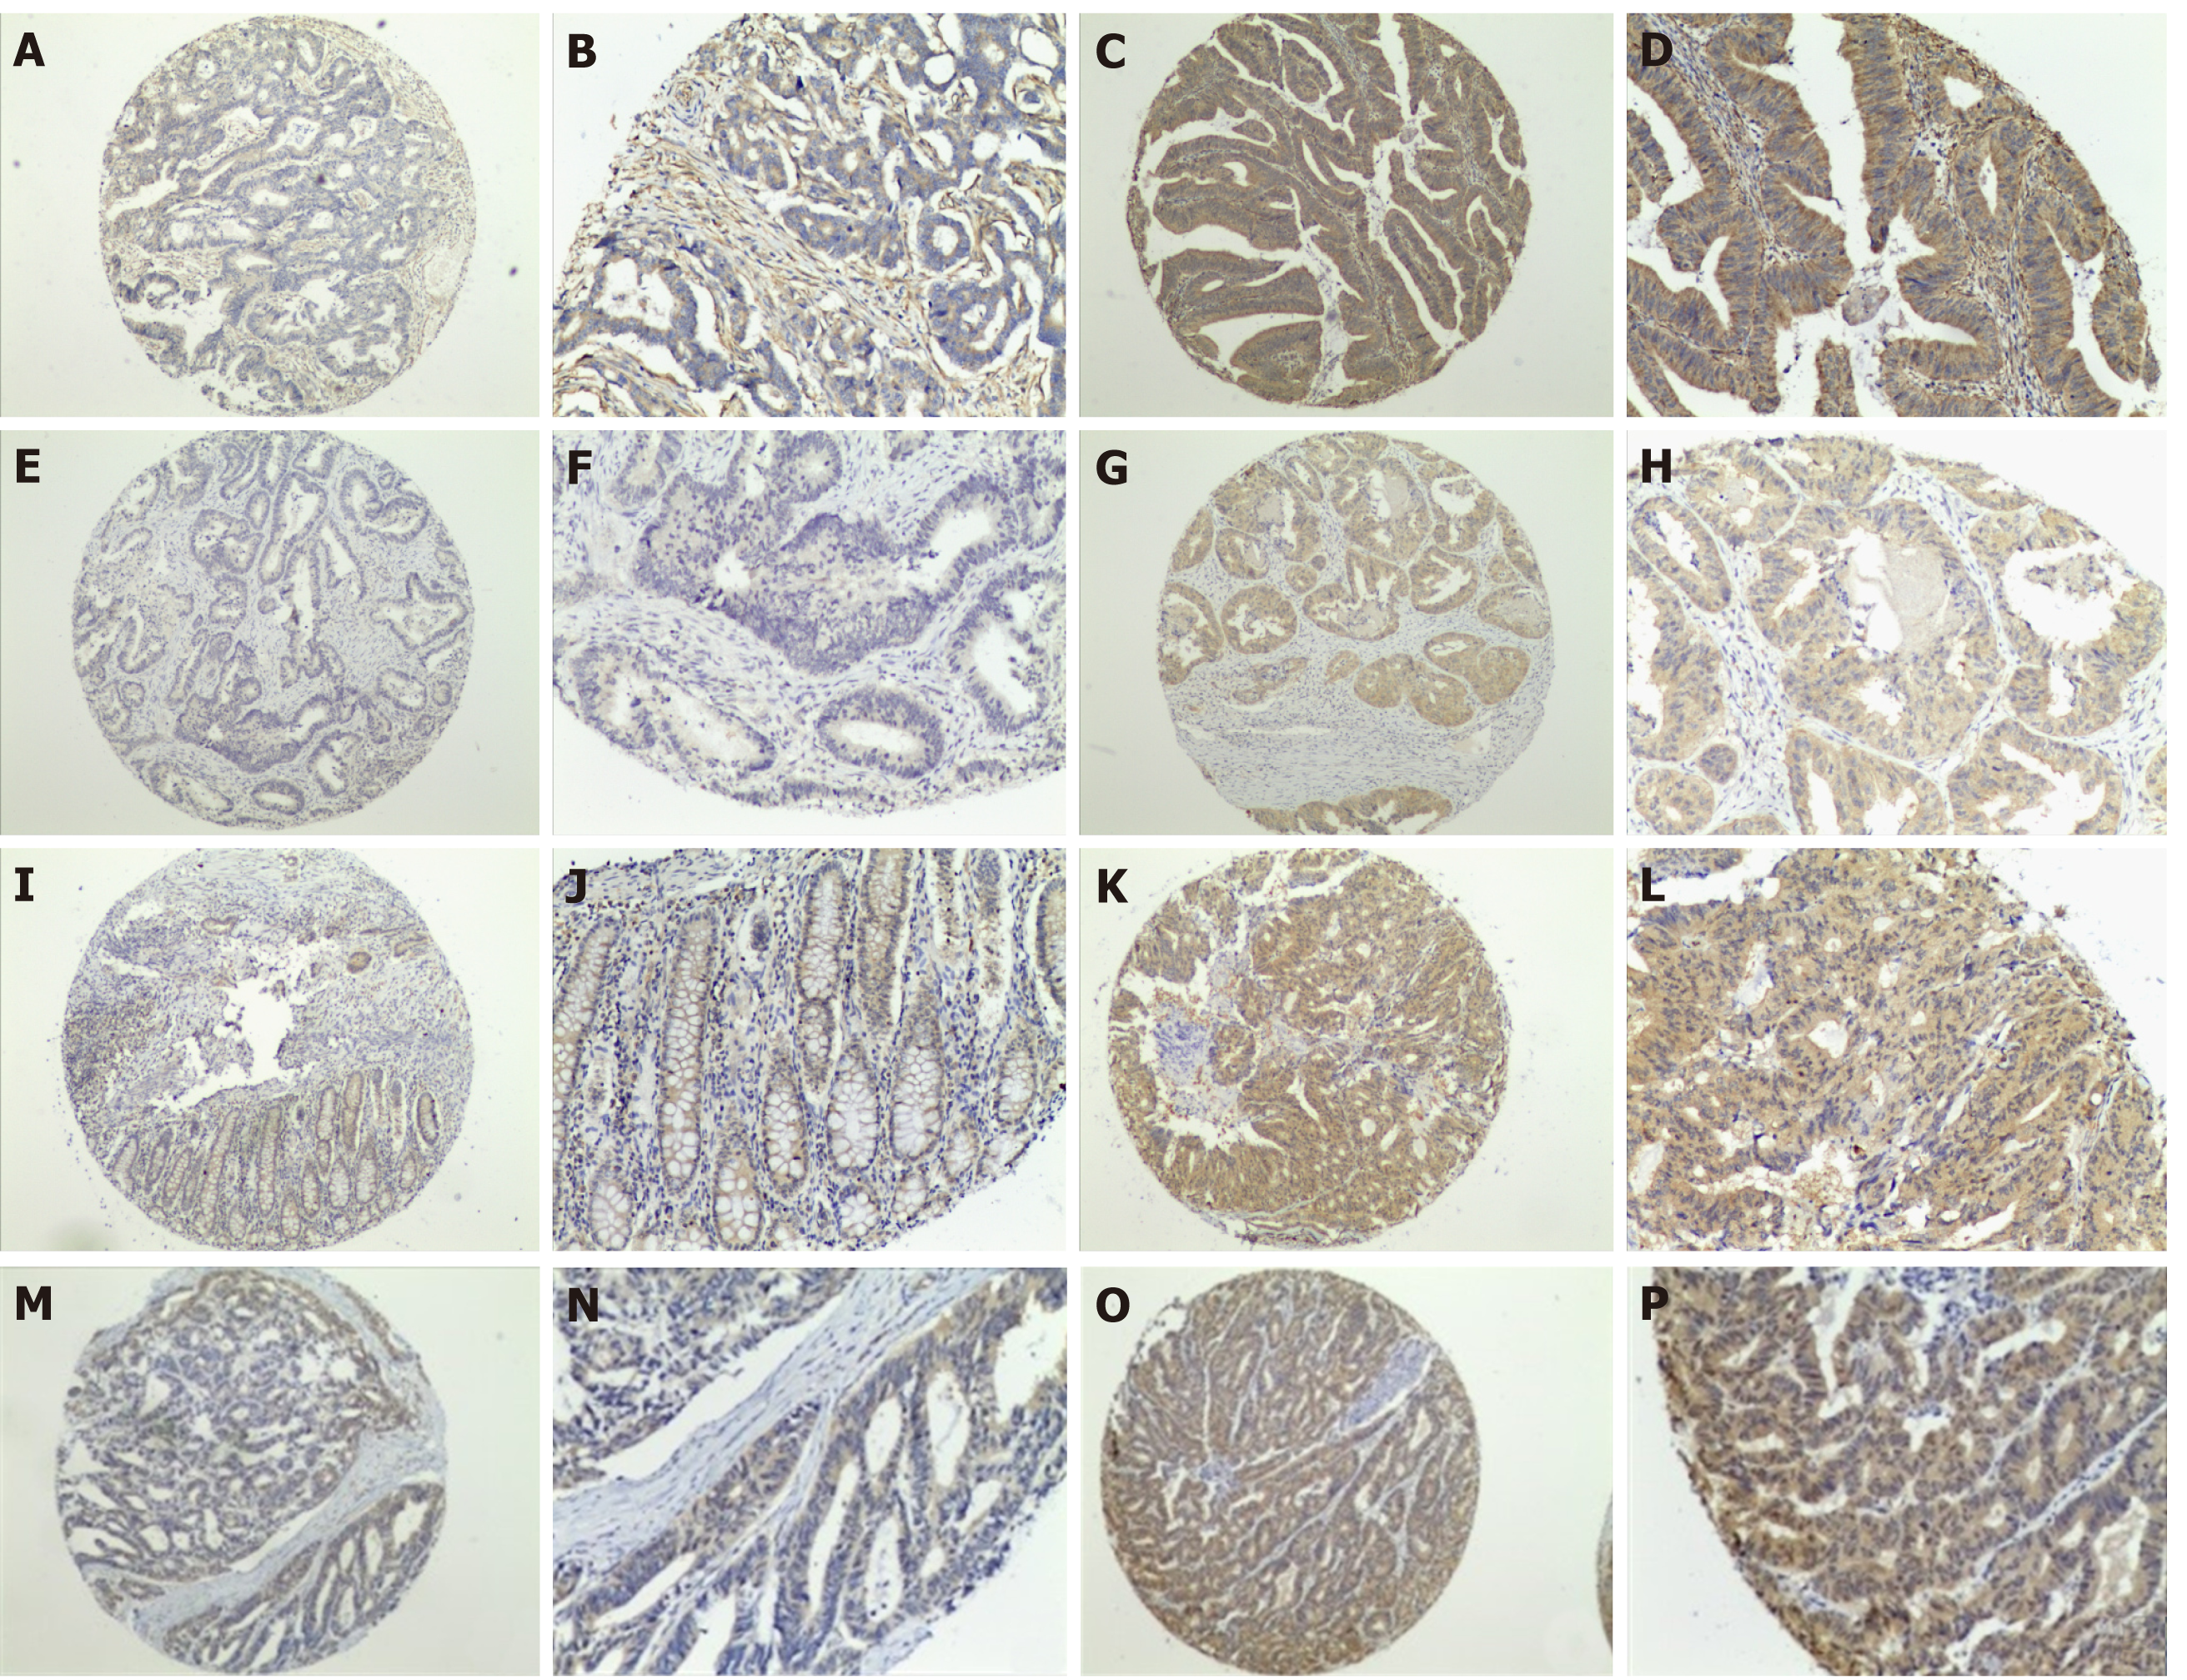
Figure 2 Expression of RAS pathway proteins in colorectal cancer.
A-D: KRAS negative (A and B) and positive (C and D) expression at magnification × 40 (A and C) and × 100 (B and D). E-P: As described for (A-D), except that staining for BRAF protein (E-H), MEK protein (I-L), and ERK protein (M-P) is shown.
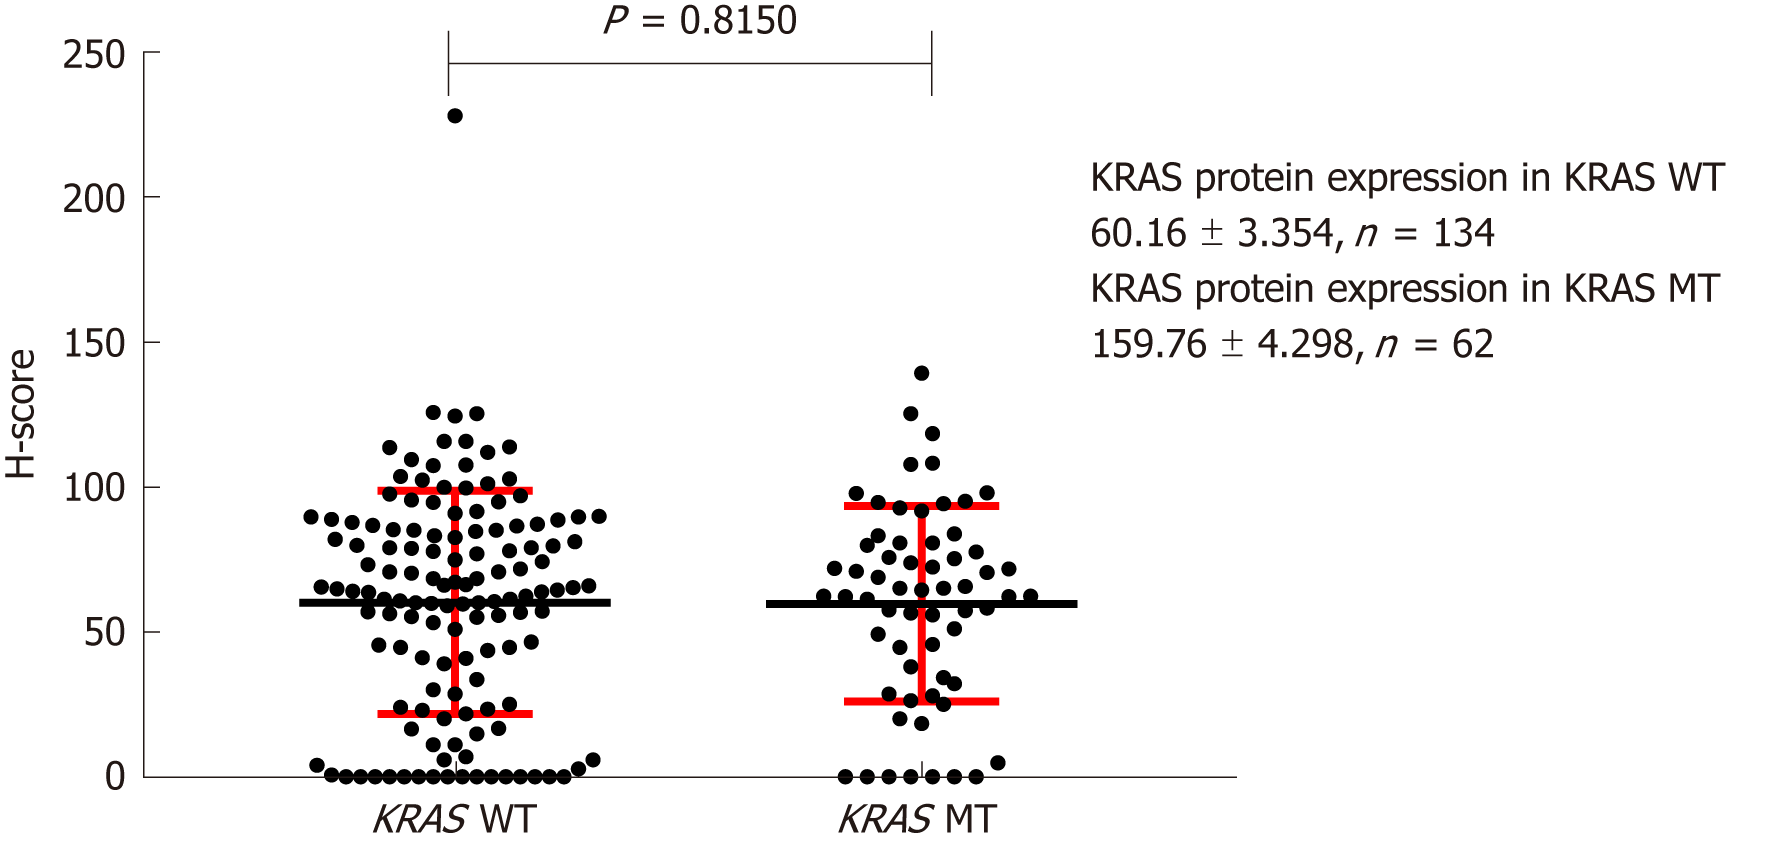
Figure 3 Effect of KRAS gene status on expression of KRAS protein on the cell membrane.
H-score: Histochemistry score.
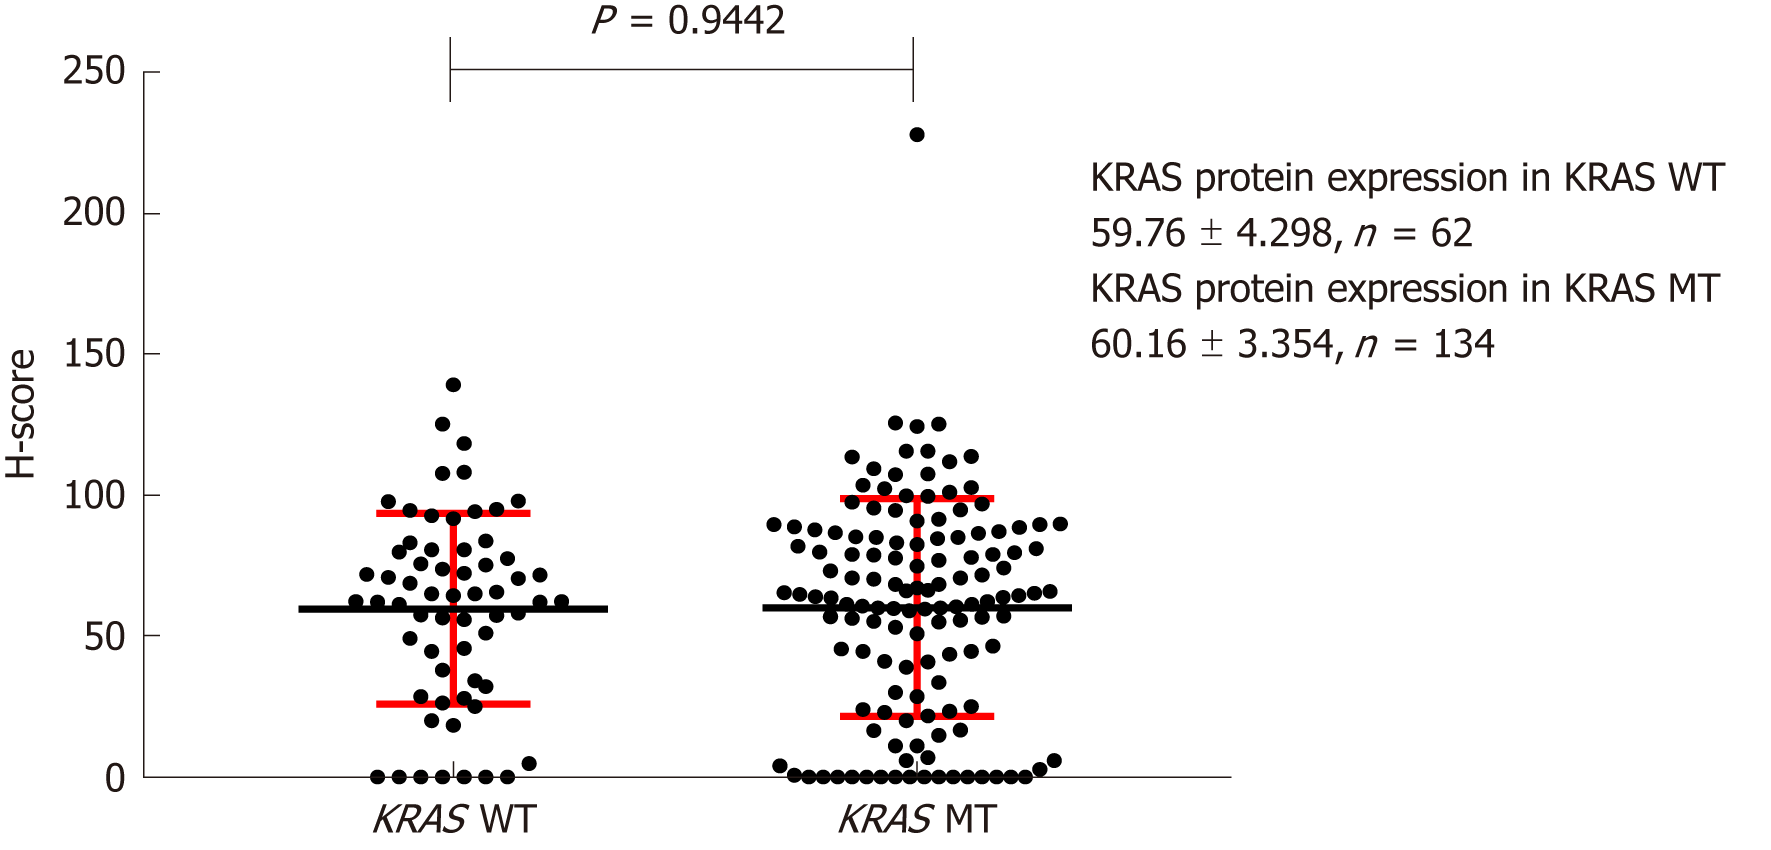
Figure 4 Effect of KRAS gene status on expression of KRAS protein in the cytoplasm.
H-score: Histochemistry score.
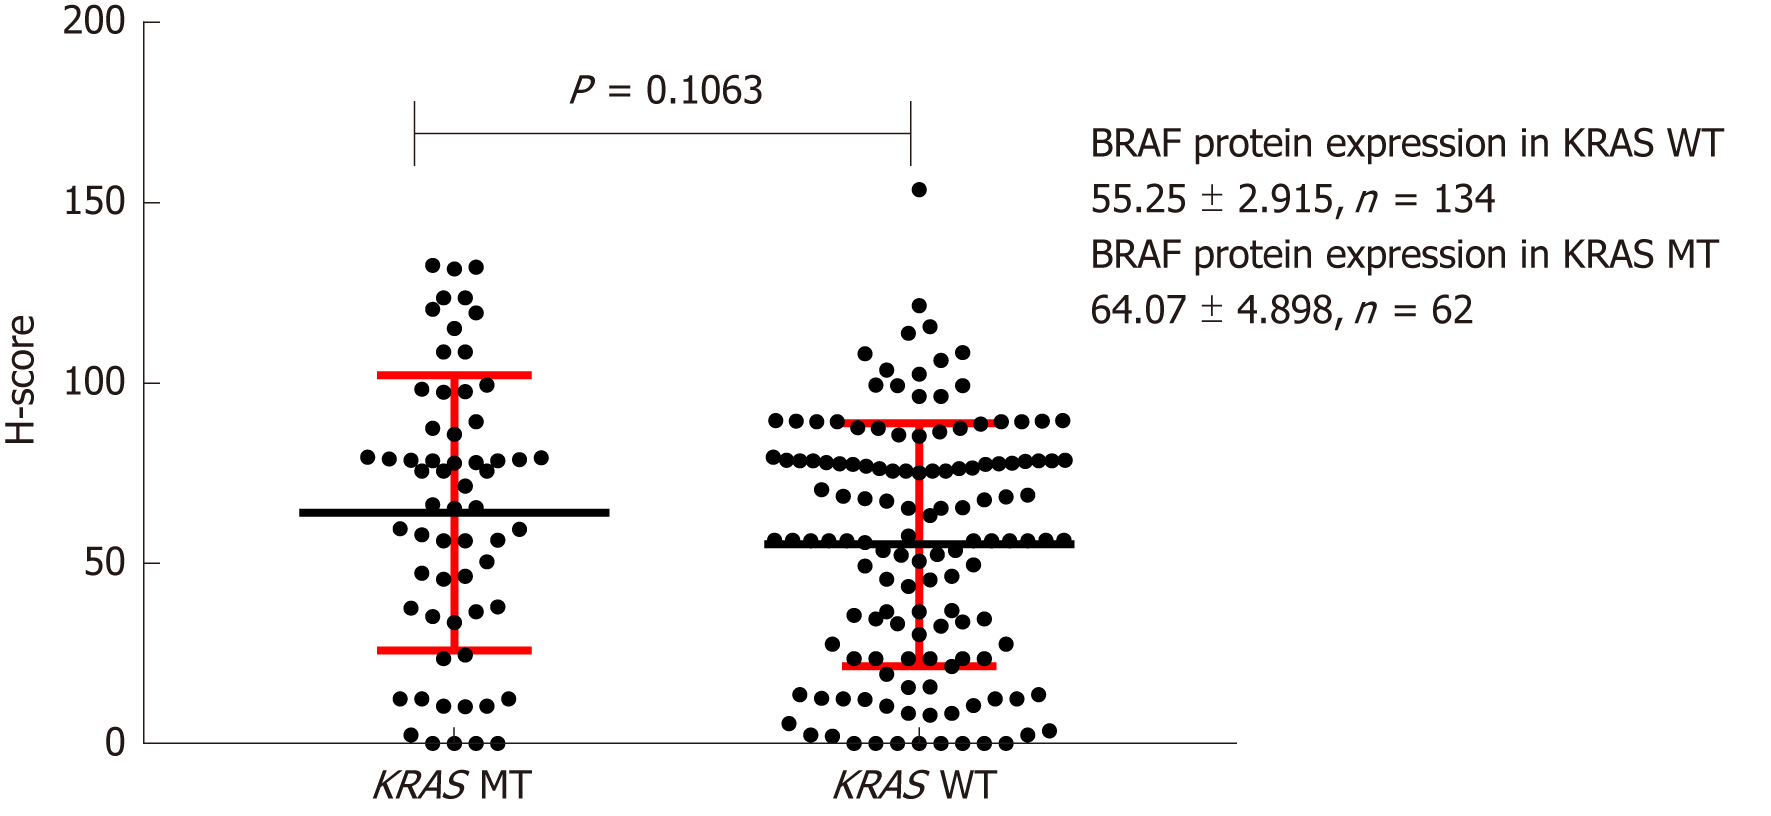
Figure 5 Effect of KRAS gene status on BRAF protein expression.
H-score: Histochemistry score.
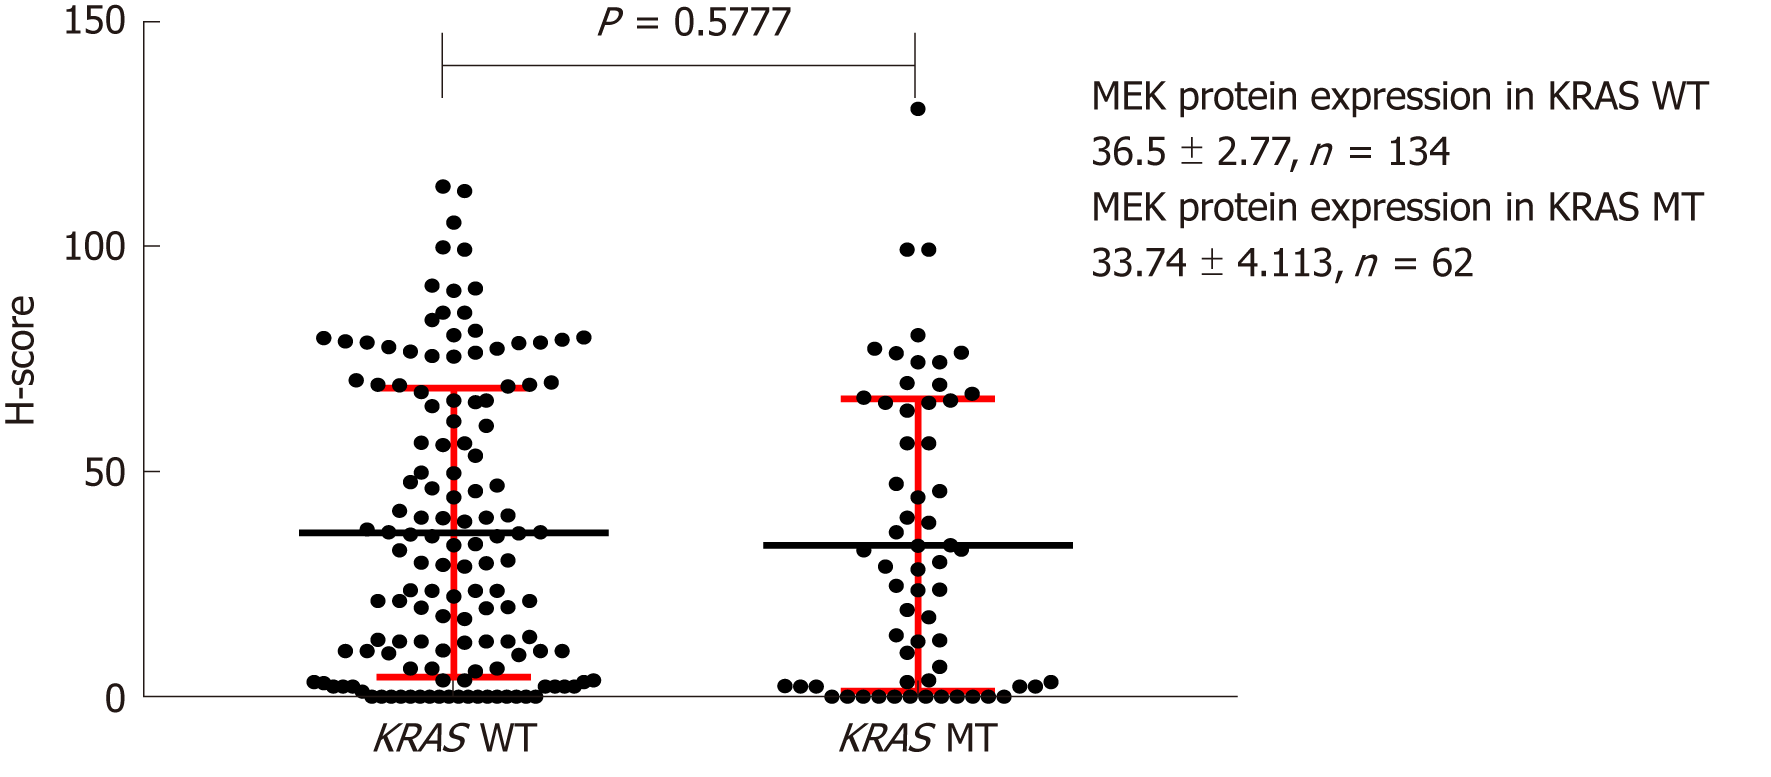
Figure 6 Effect of KRAS gene status on MEK protein expression.
H-score: Histochemistry score.
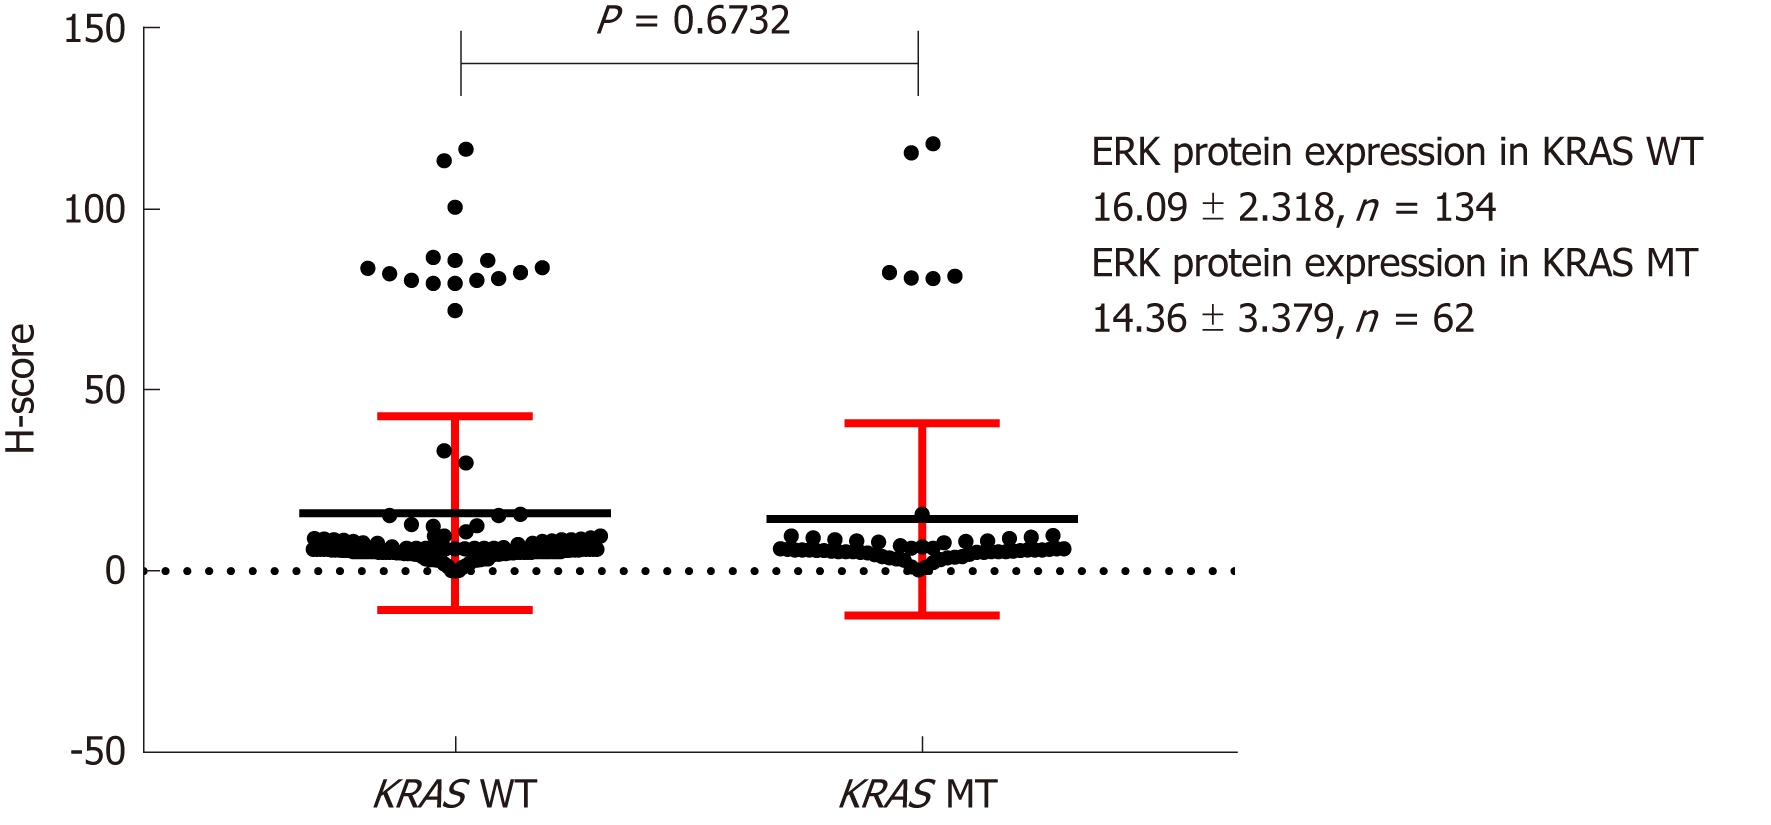
Figure 7 Effect of KRAS gene status on ERK protein expression.
H-score: Histochemistry score.
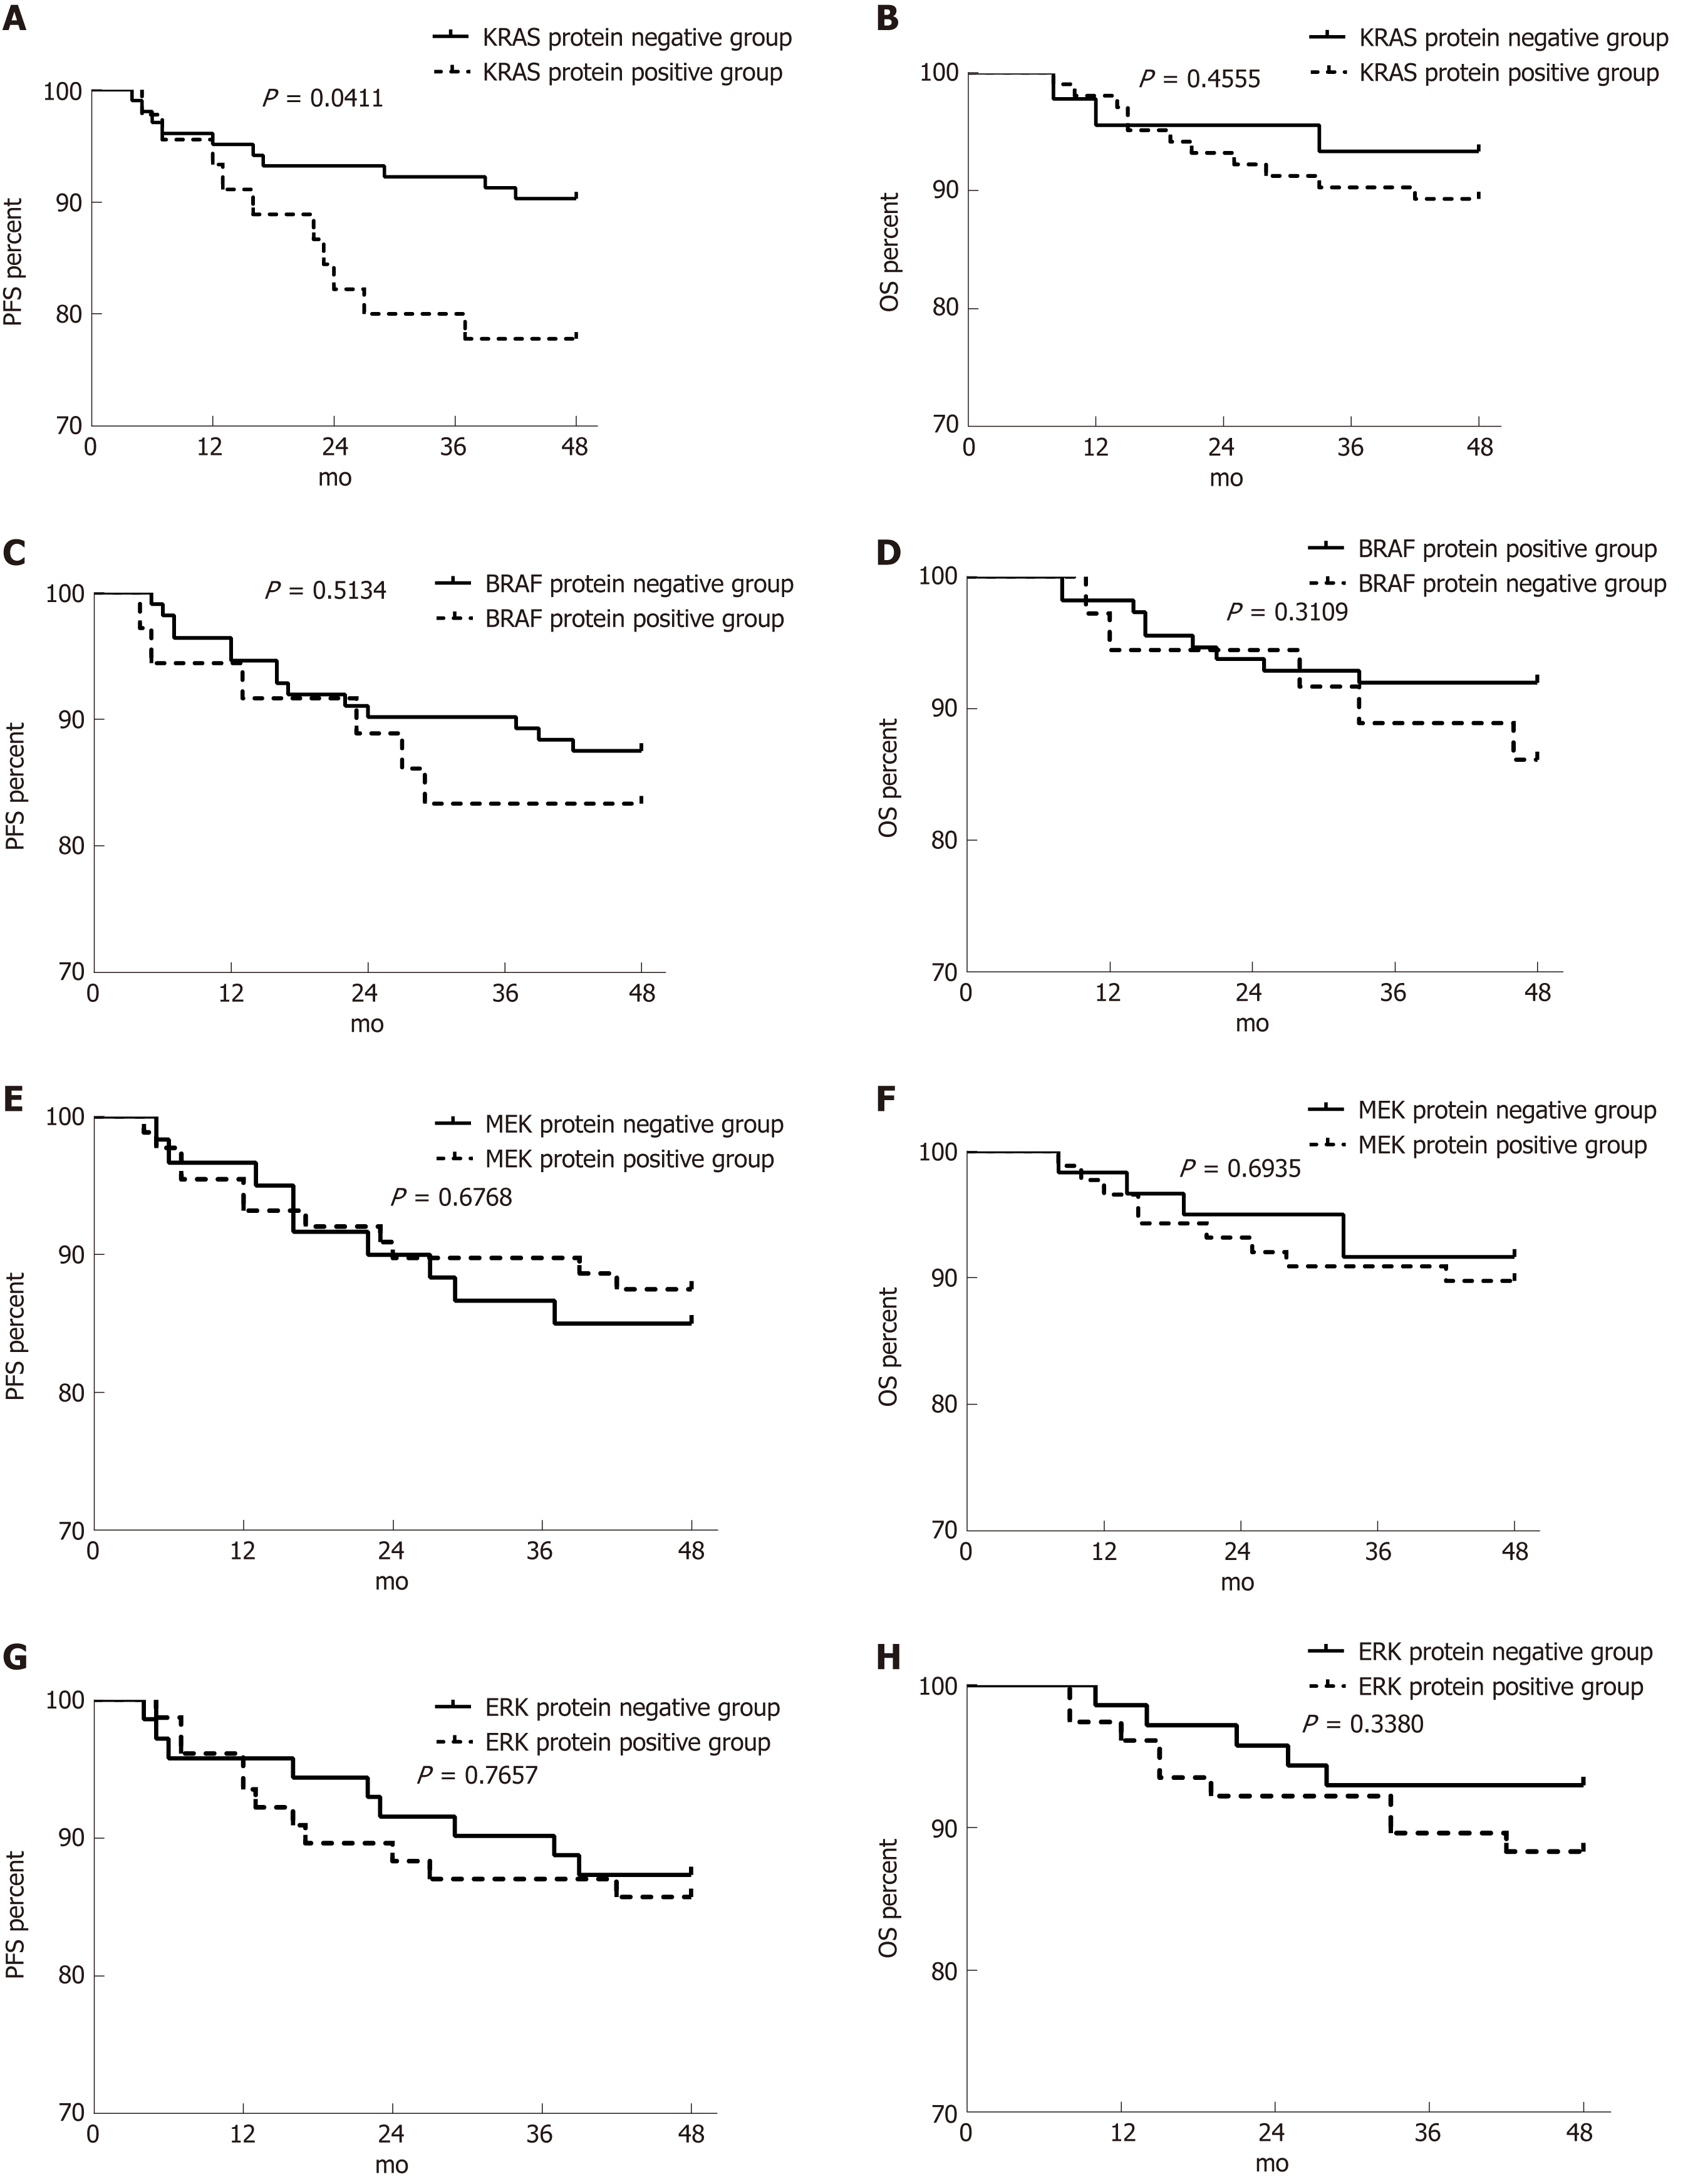
Figure 8 Effect of RAS pathway protein expression on progression-free survival and overall survival in patients with stage II/III colorectal cancer.
A-H: Effects of KRAS (A and B), BRAF (C and D), MEK (E and F), and ERK (G and H) protein expression on progression-free survival (A, C, E, and G) and overall survival (B, D, F, and H). PFS: Progression-free survival; OS: Overall survival.
- Citation: Wan XB, Wang AQ, Cao J, Dong ZC, Li N, Yang S, Sun MM, Li Z, Luo SX. Relationships among KRAS mutation status, expression of RAS pathway signaling molecules, and clinicopathological features and prognosis of patients with colorectal cancer. World J Gastroenterol 2019; 25(7): 808-823
- URL: https://www.wjgnet.com/1007-9327/full/v25/i7/808.htm
- DOI: https://dx.doi.org/10.3748/wjg.v25.i7.808


