Copyright
©The Author(s) 2019.
World J Gastroenterol. Feb 14, 2019; 25(6): 729-743
Published online Feb 14, 2019. doi: 10.3748/wjg.v25.i6.729
Published online Feb 14, 2019. doi: 10.3748/wjg.v25.i6.729
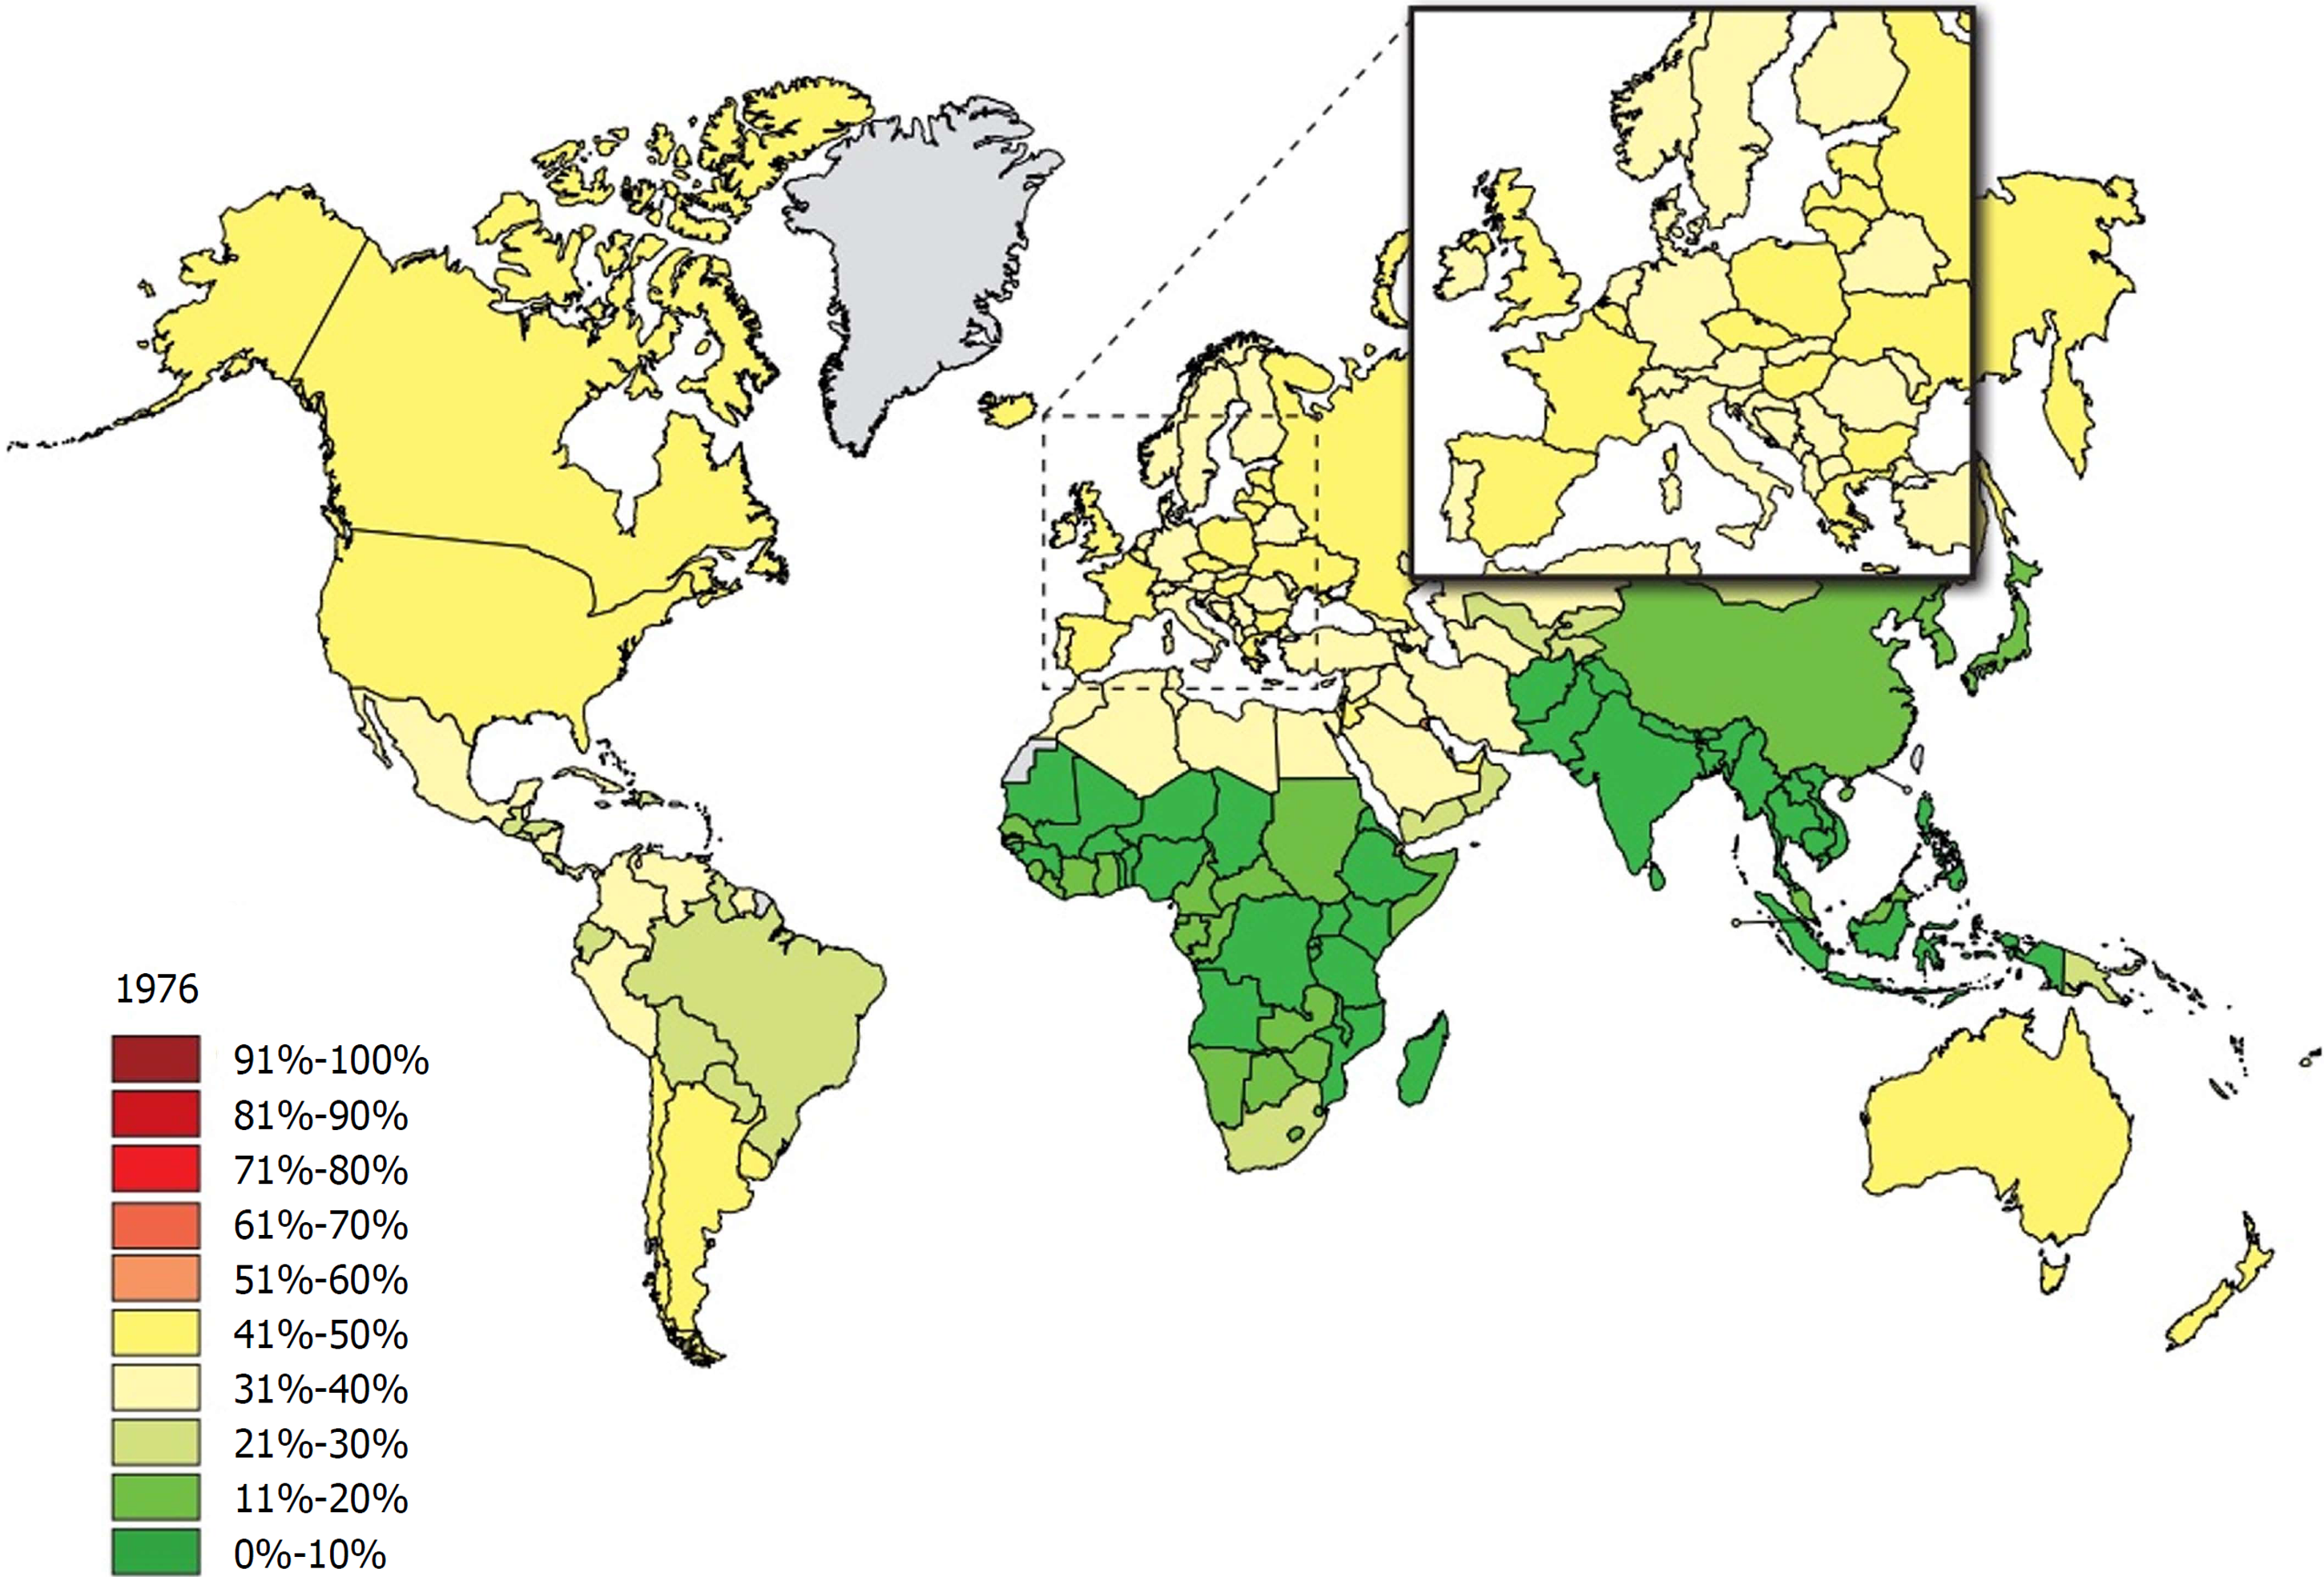
Figure 1 The rate of individuals with a body-mass index ≥ 25 among adults in 1976.
Source: Global Health Observatory data repository http://apps.who.int/gho/data/node.main.A897A?lang=en.
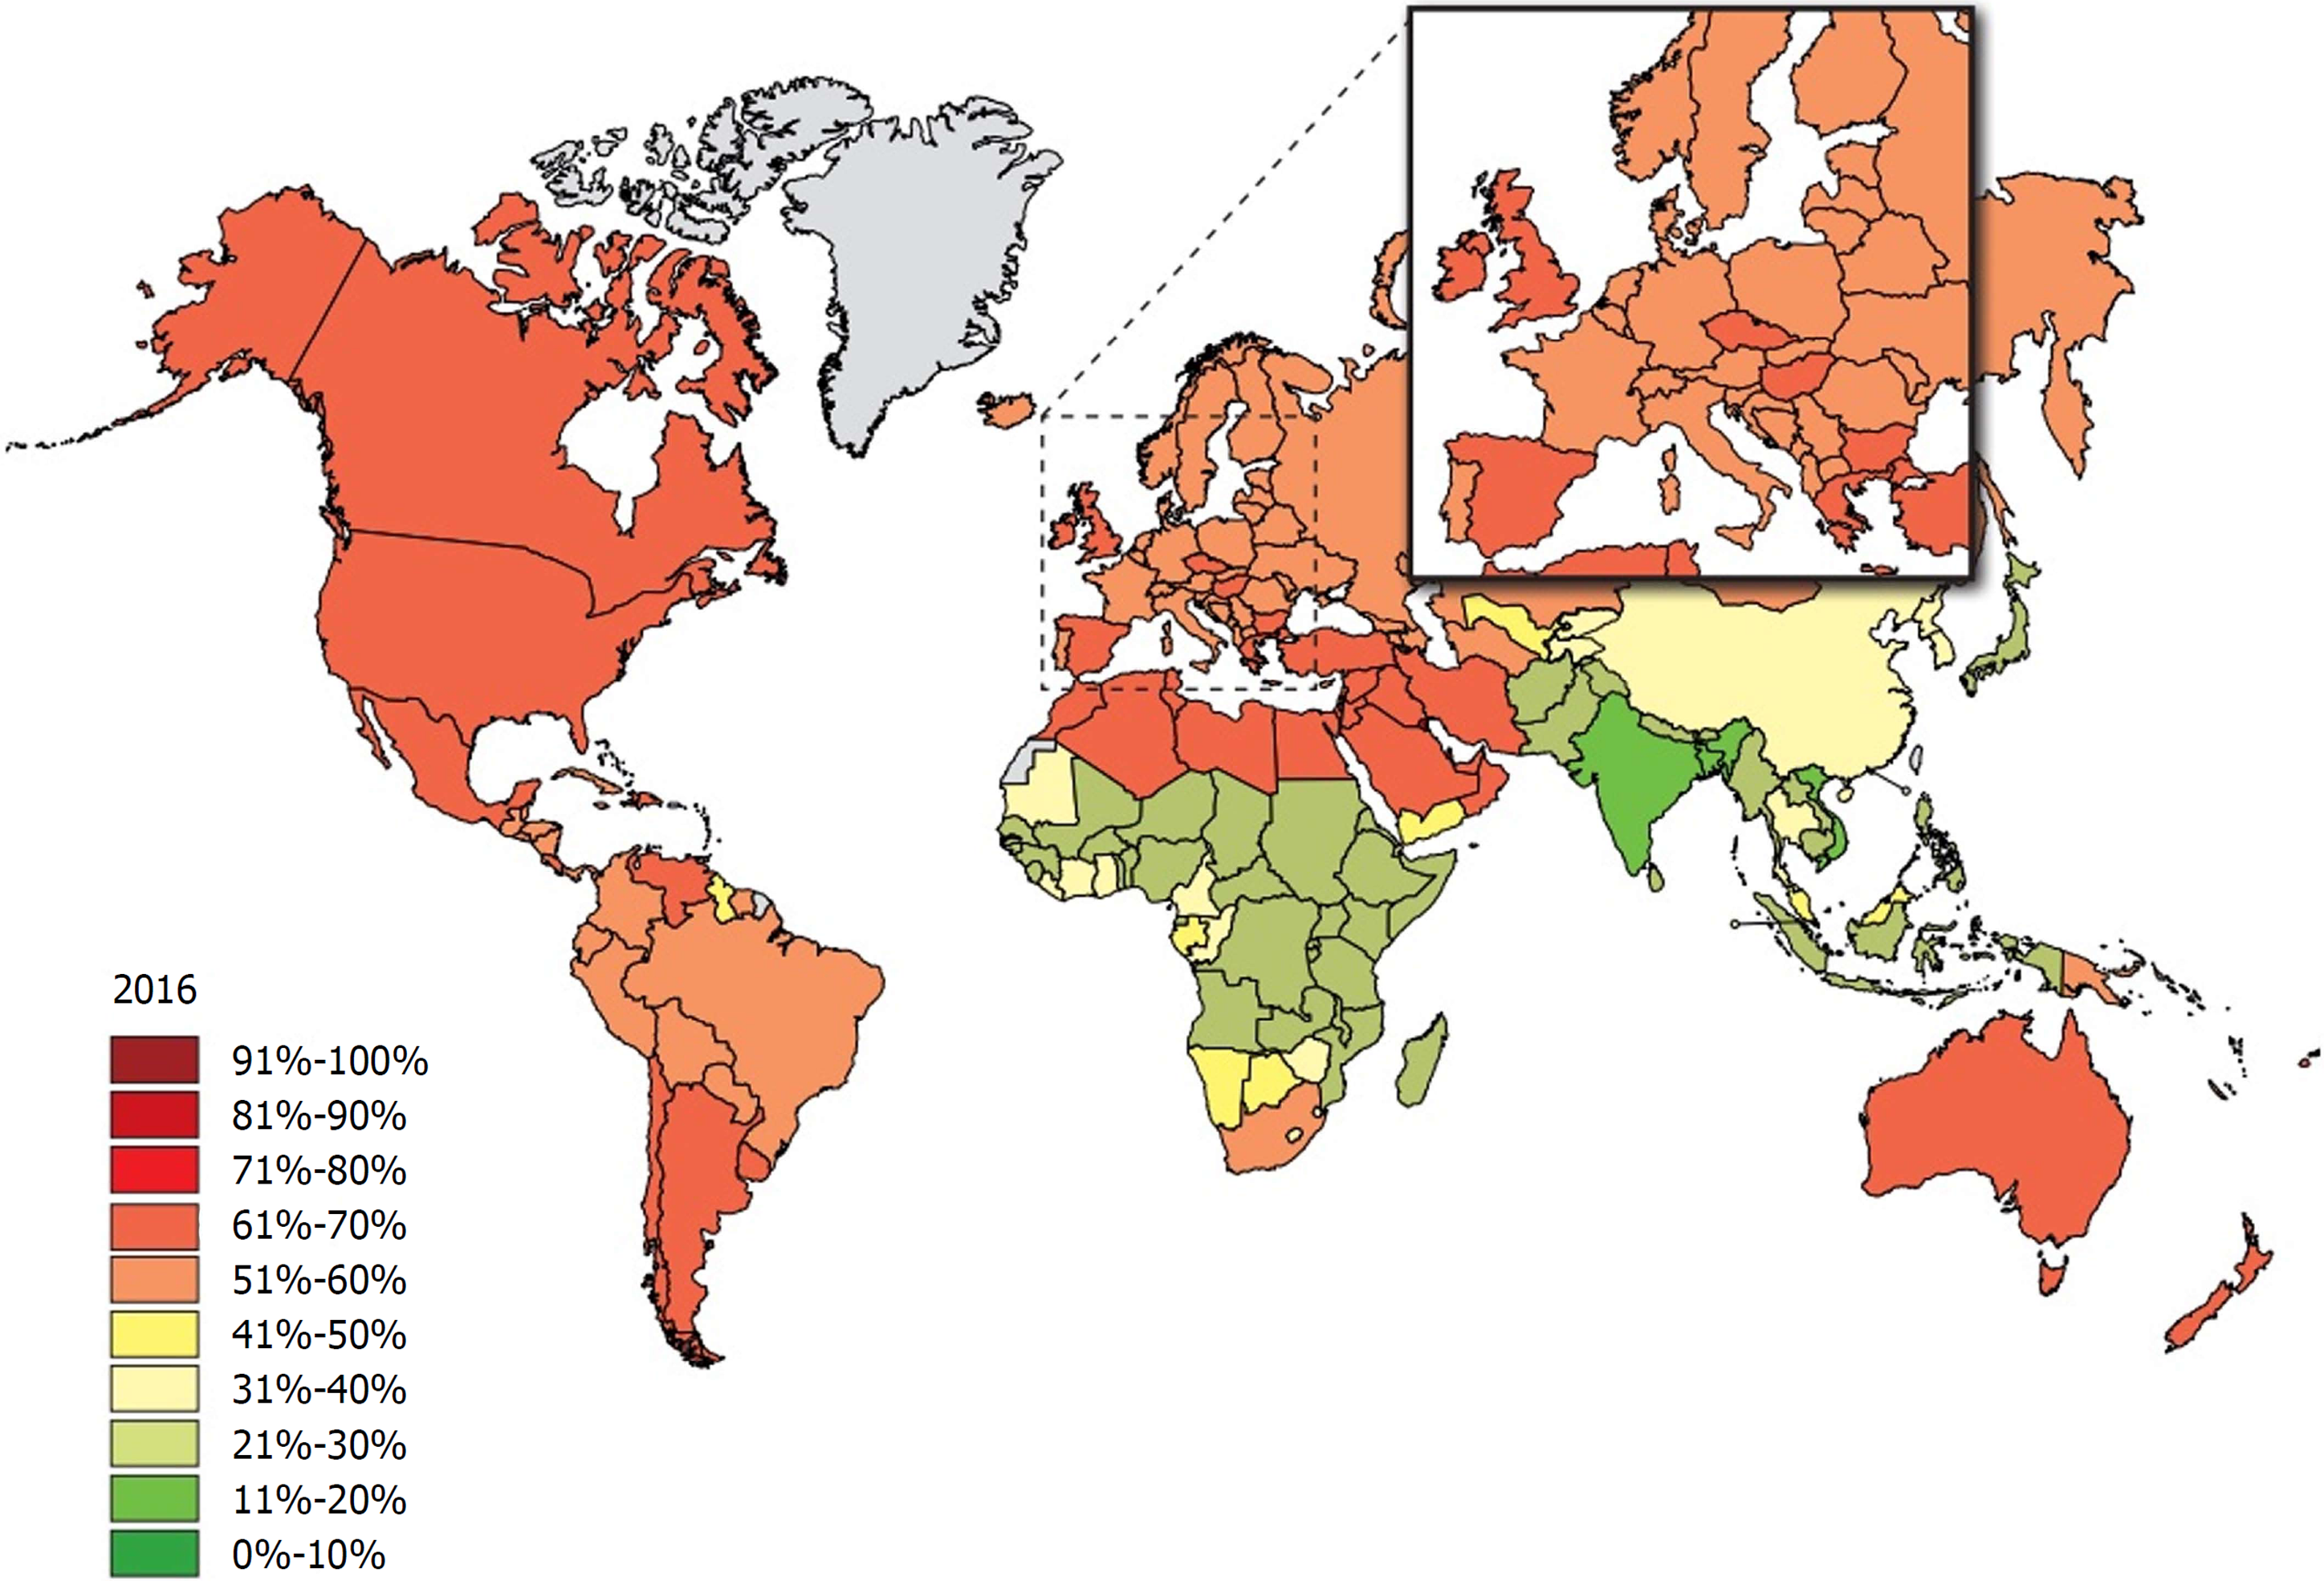
Figure 2 The rate of individuals with a body-mass index ≥ 25 among adults 40 years later in 2016.
Source: Global Health Observatory data repository (http://apps.who.int/gho/data/node.main.A897A?lang=en).
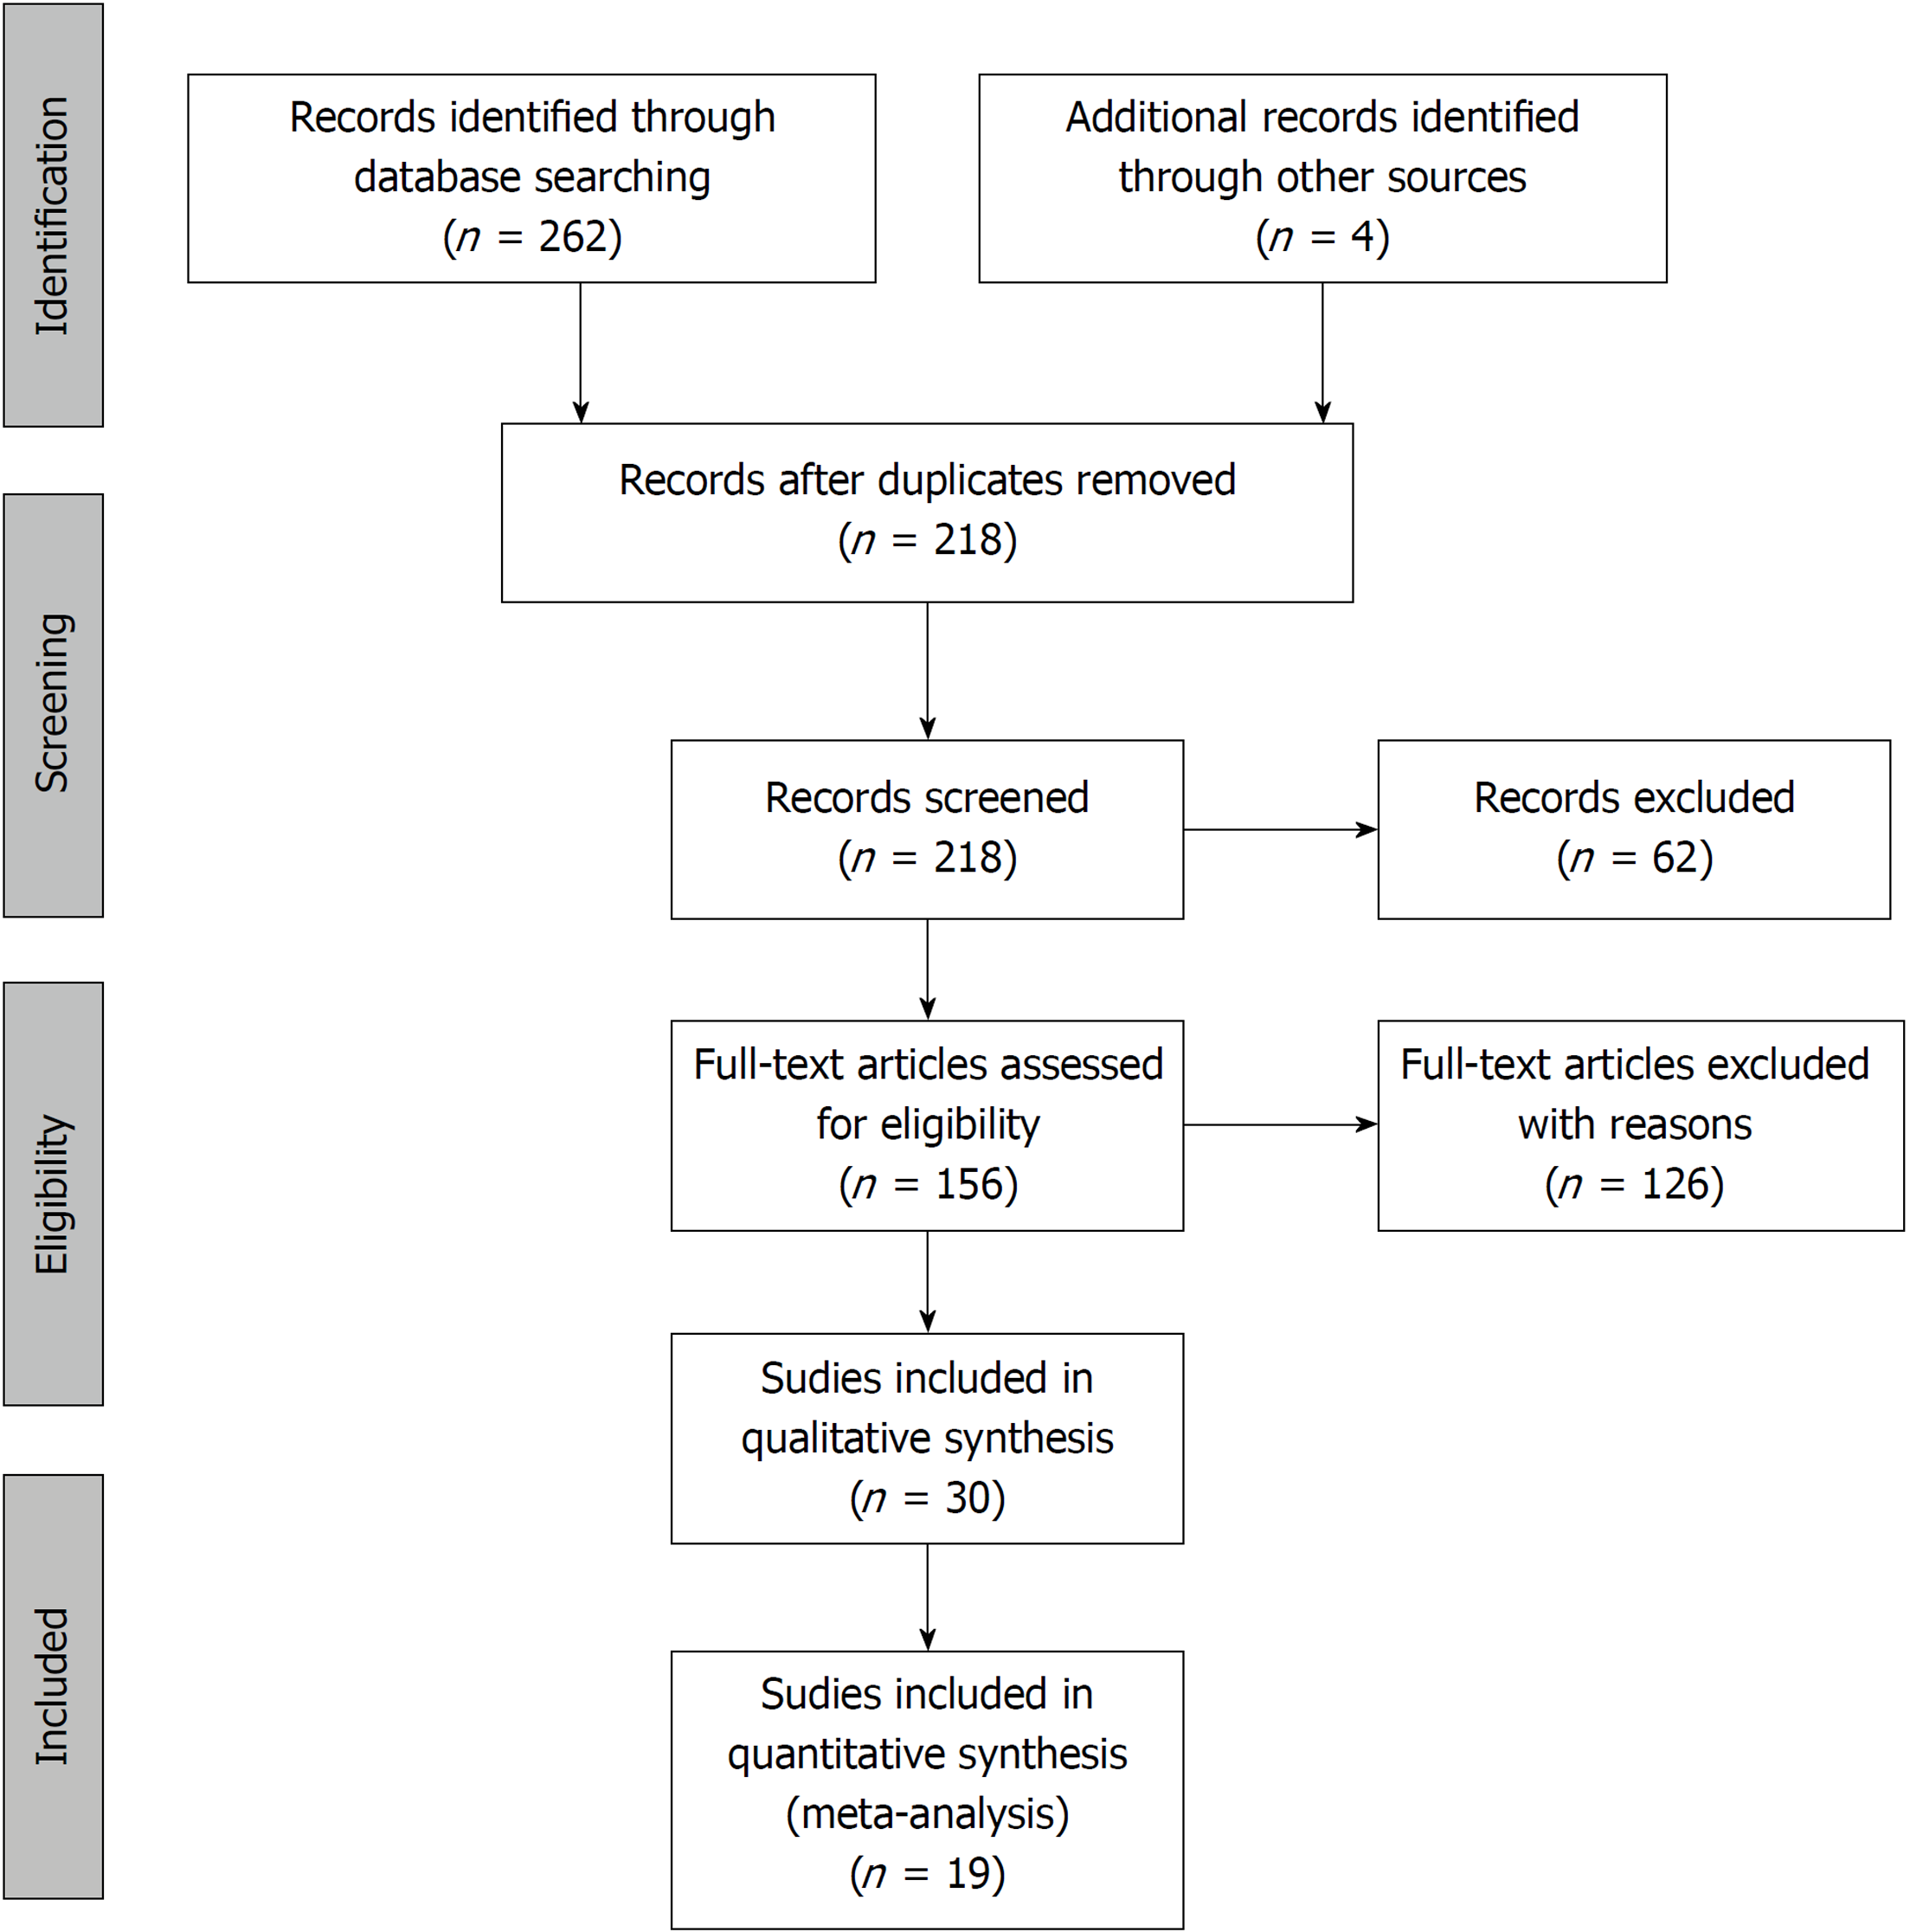
Figure 3 Flowchart of the study selection procedure.
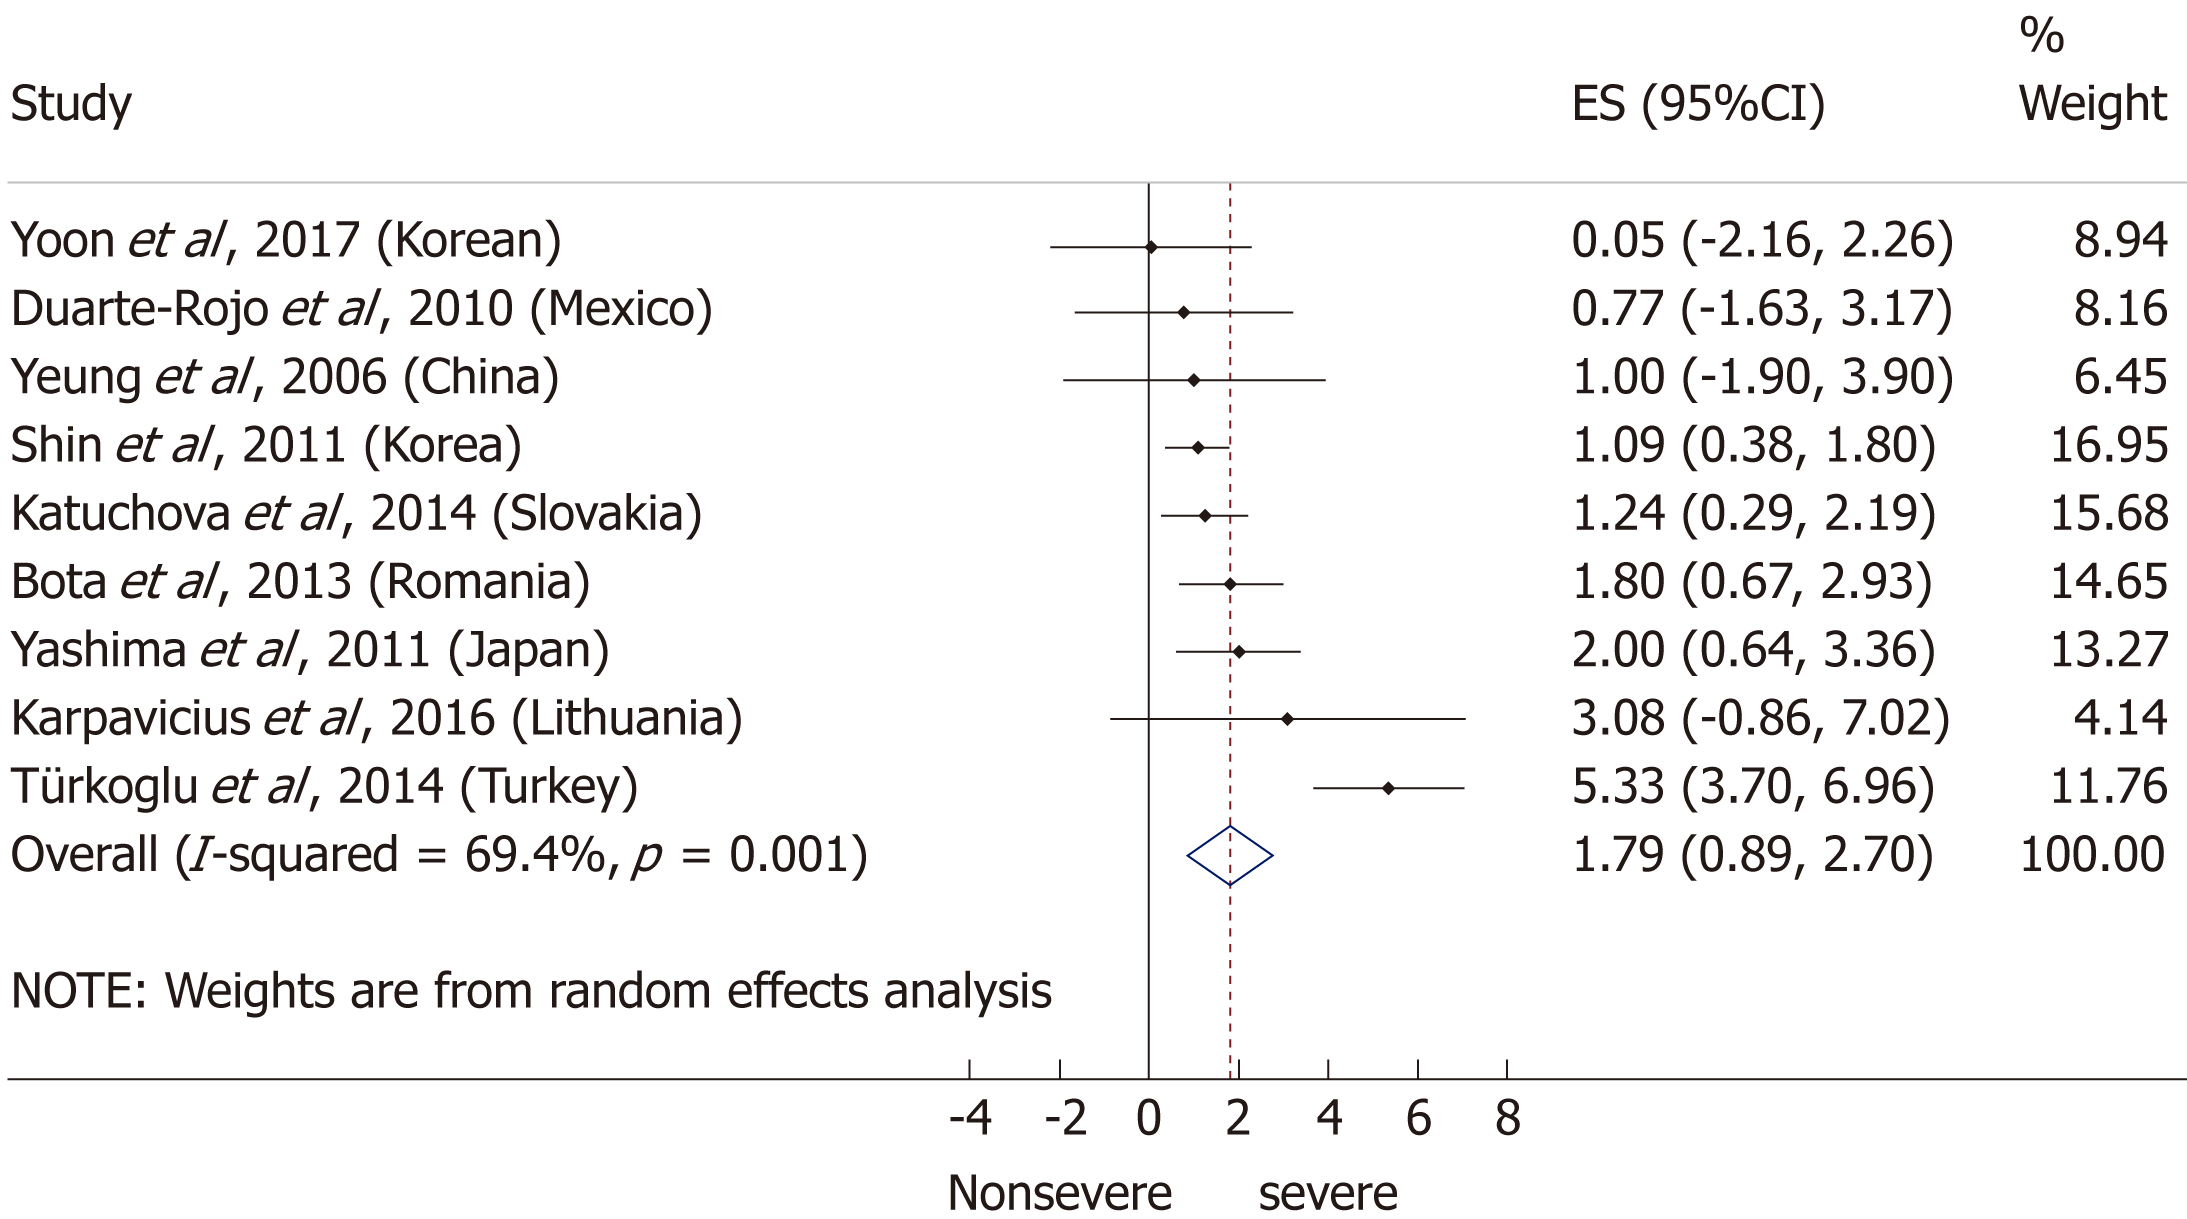
Figure 4 Forest plot of mean body-mass index in the non-severe and severe patient subgroups.
Filled circles represent the mean difference derived from the studies analyzed. Horizontal bars represent 95%CI. Empty rhombuses show the overall, combined mean difference (point estimation is the middle of the rhombus and CIs are the edges). CI: Confidence interval.
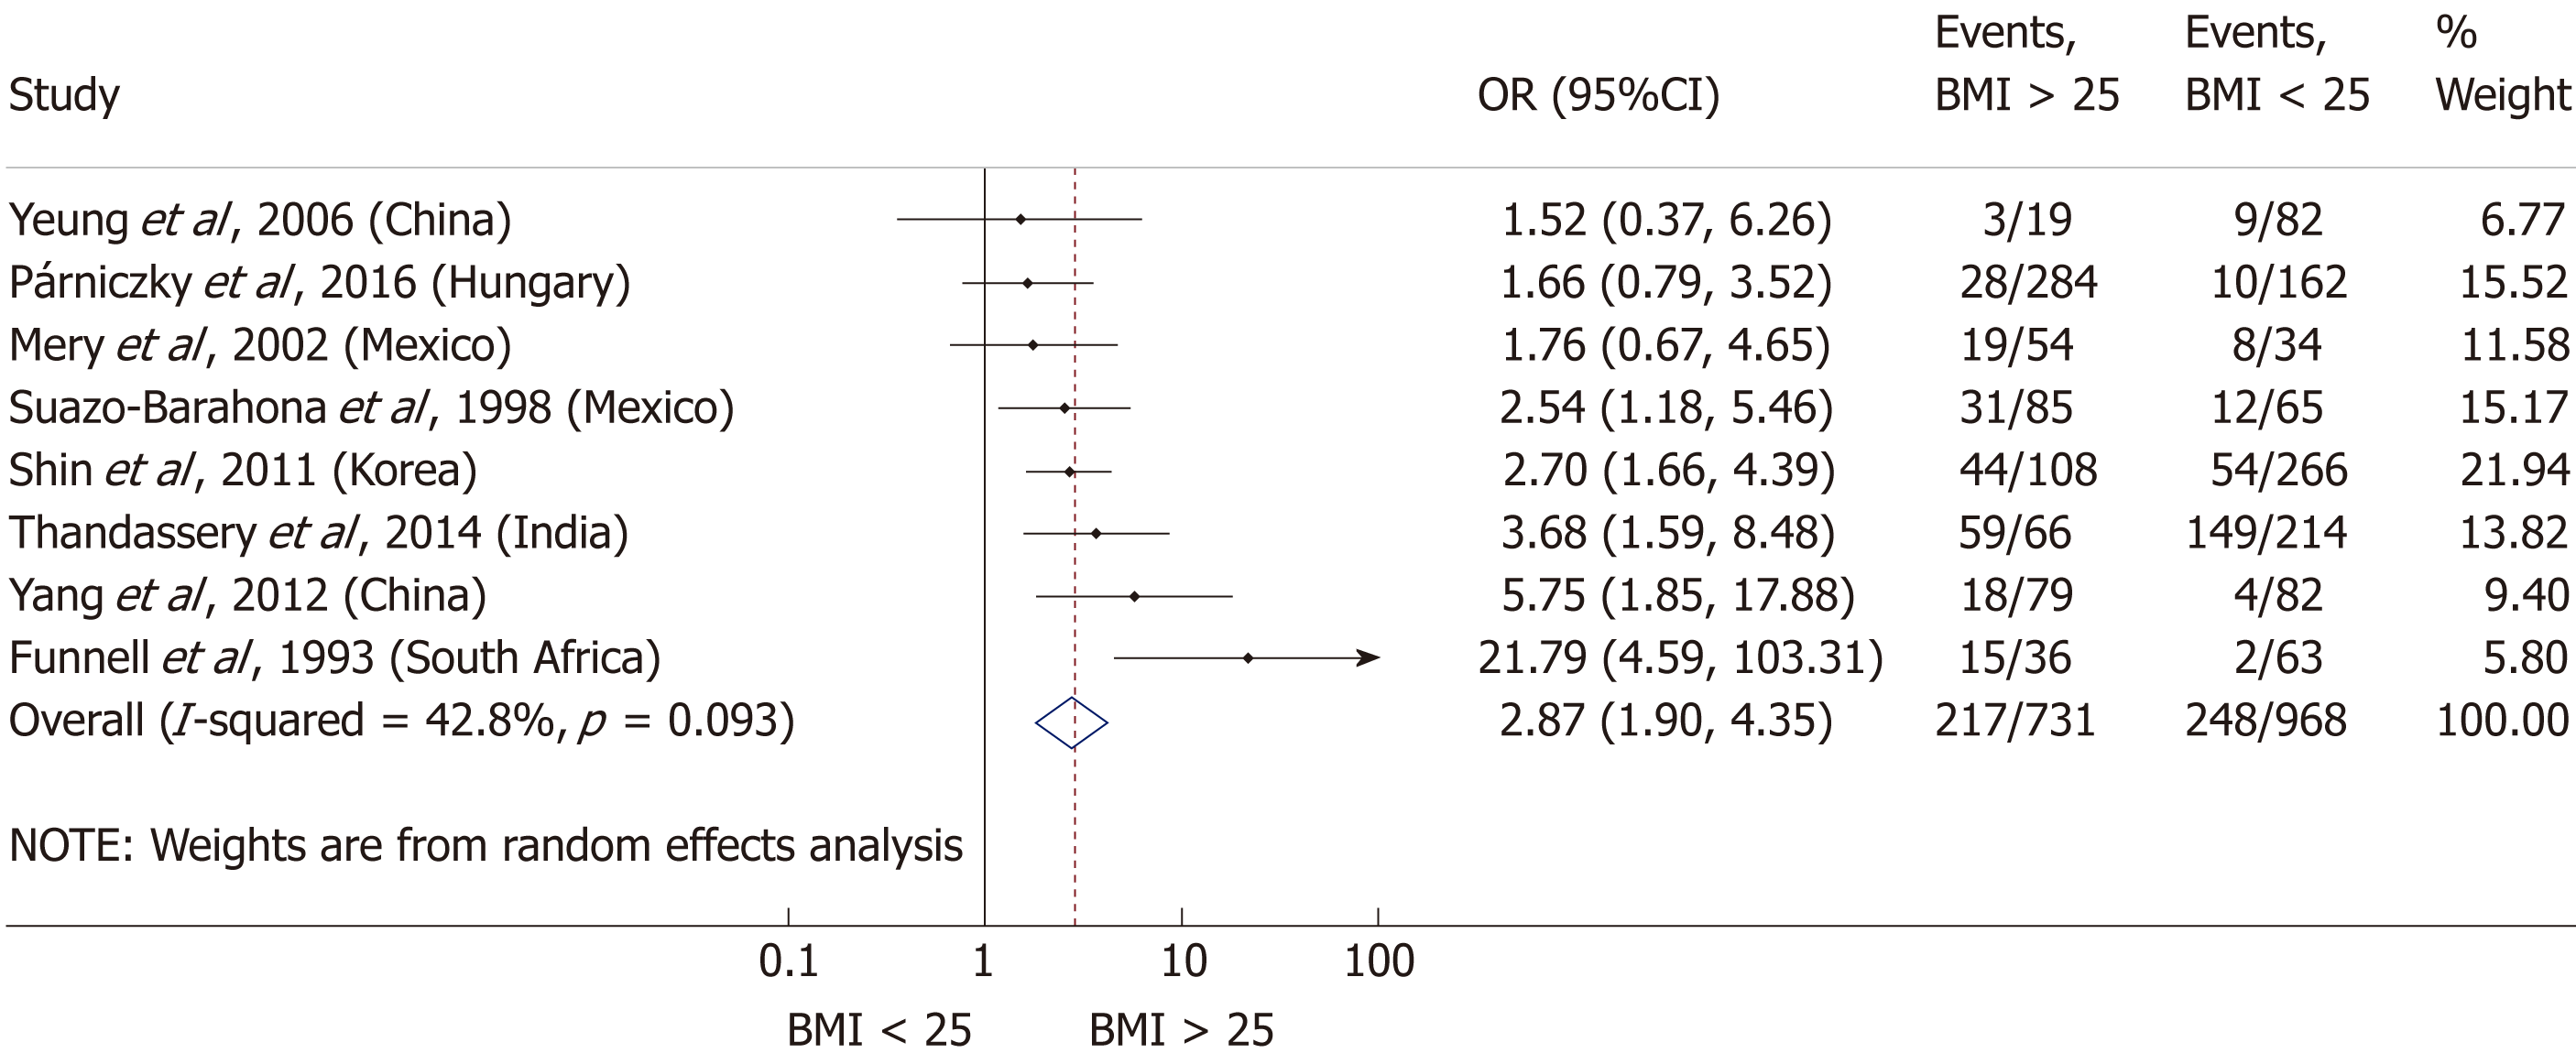
Figure 5 Forest plot of severe acute pancreatitis in the body-mass index < 25 and body-mass index > 25 subgroups.
Filled circles represent the odds ratio derived from the studies analyzed. Horizontal bars represent 95%CI. Empty rhombuses show the overall, combined effect (OR is the middle of the rhombus and CIs are the edges). BMI: Body-mass index; CI: Confidence interval; OR: Odds ratio.
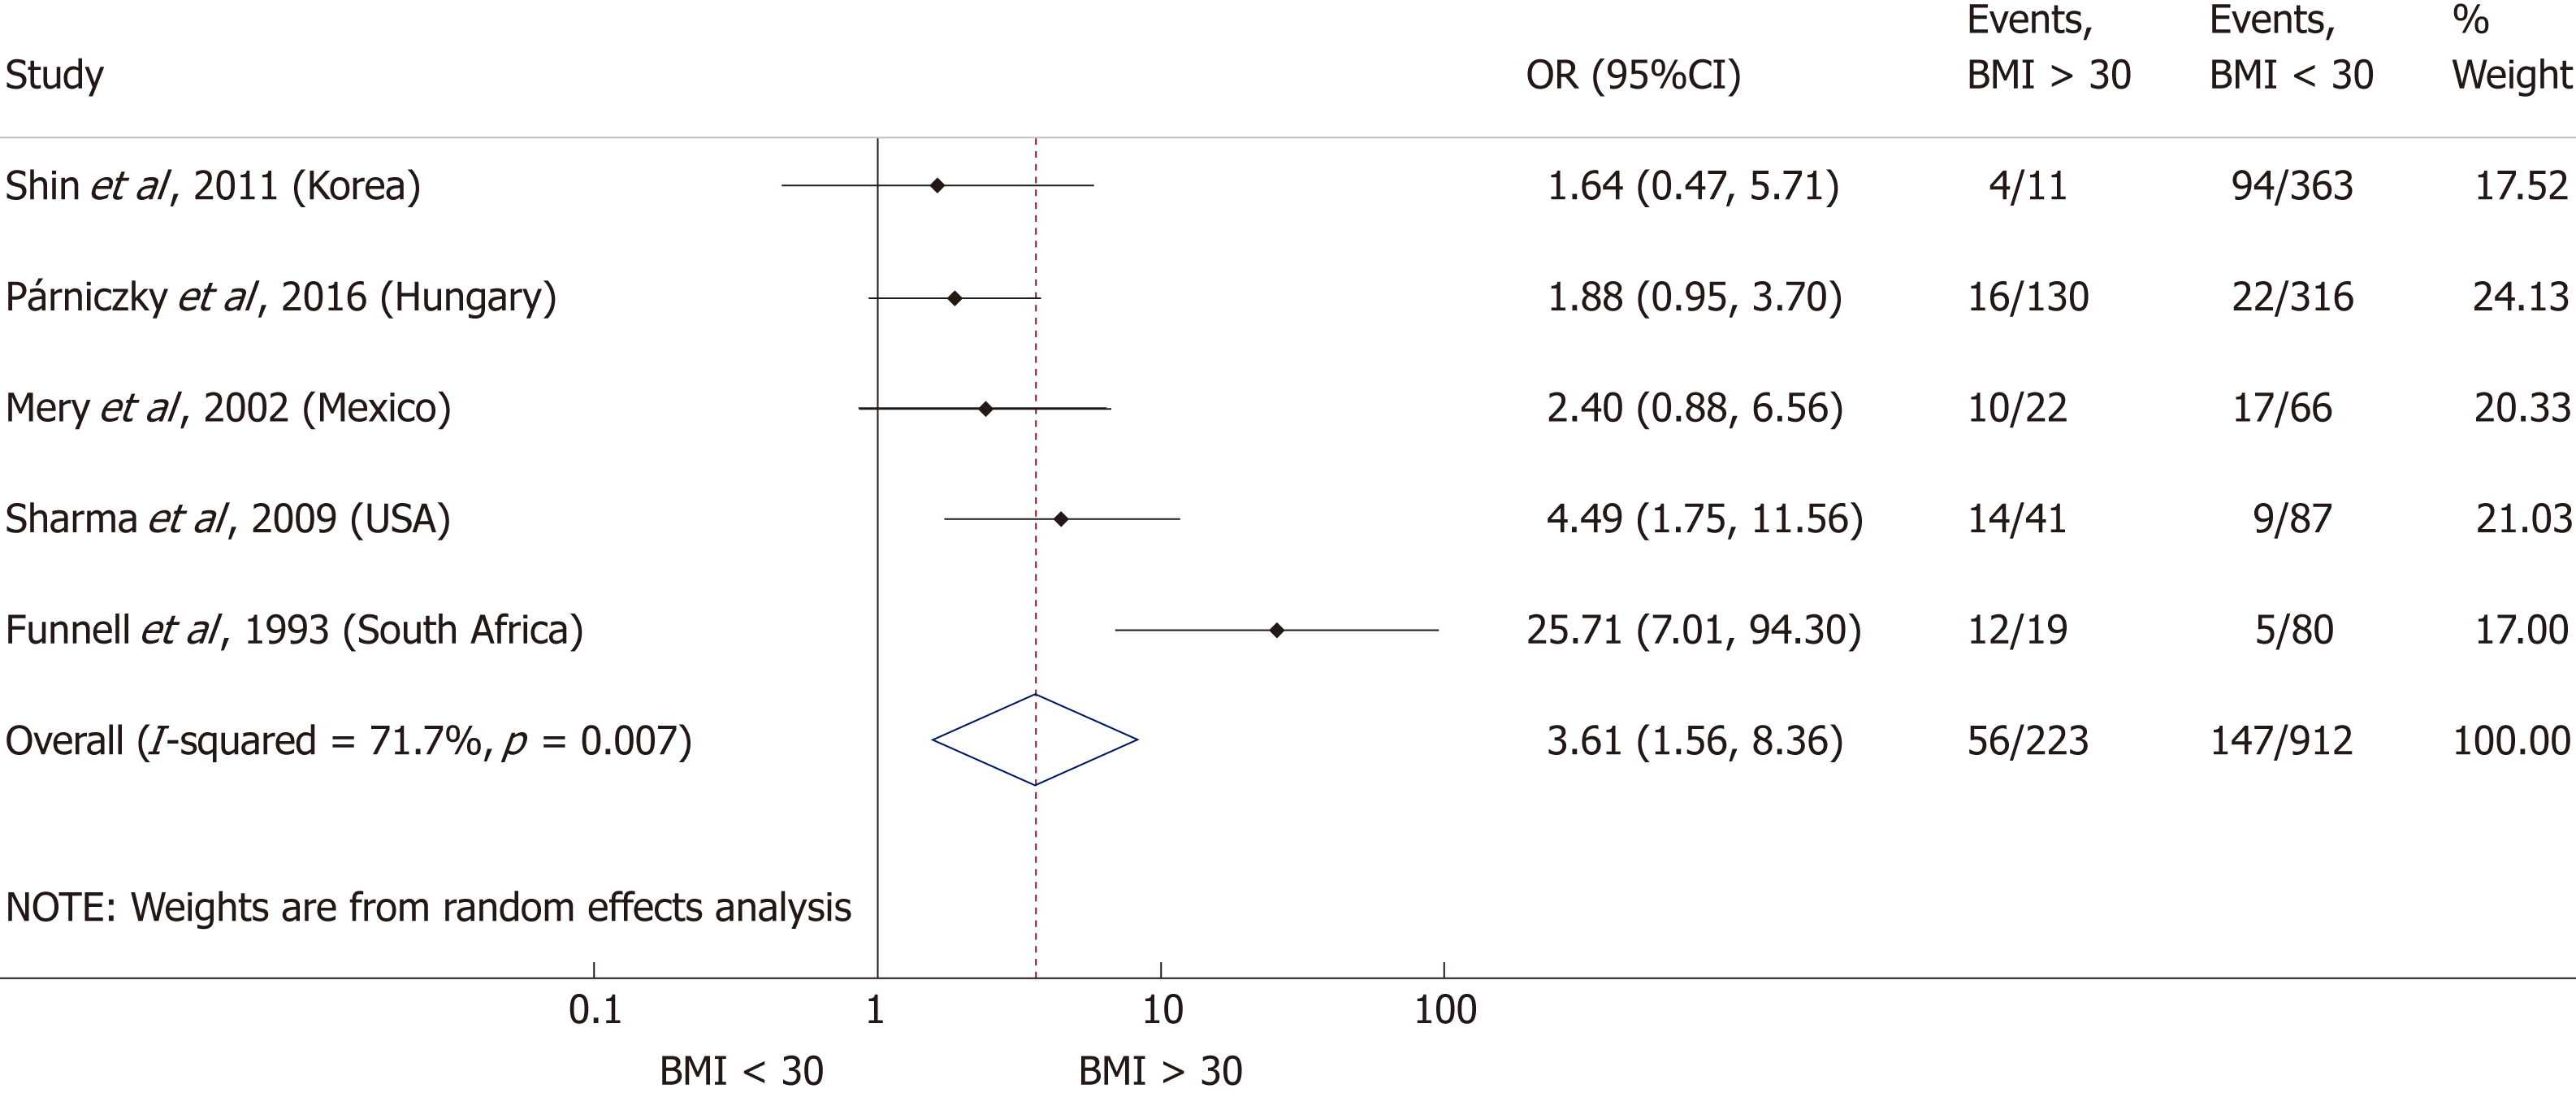
Figure 6 Forest plot of severe acute pancreatitis in the body-mass index < 30 and body-mass index > 30 subgroups.
Filled circles represent the odds ratio derived from the studies analyzed. Horizontal bars represent 95%CI. Empty rhombuses show the overall, combined effect (OR is the middle of the rhombus and CIs are the edges). BMI: Body-mass index; CI: Confidence interval; OR: Odds ratio.
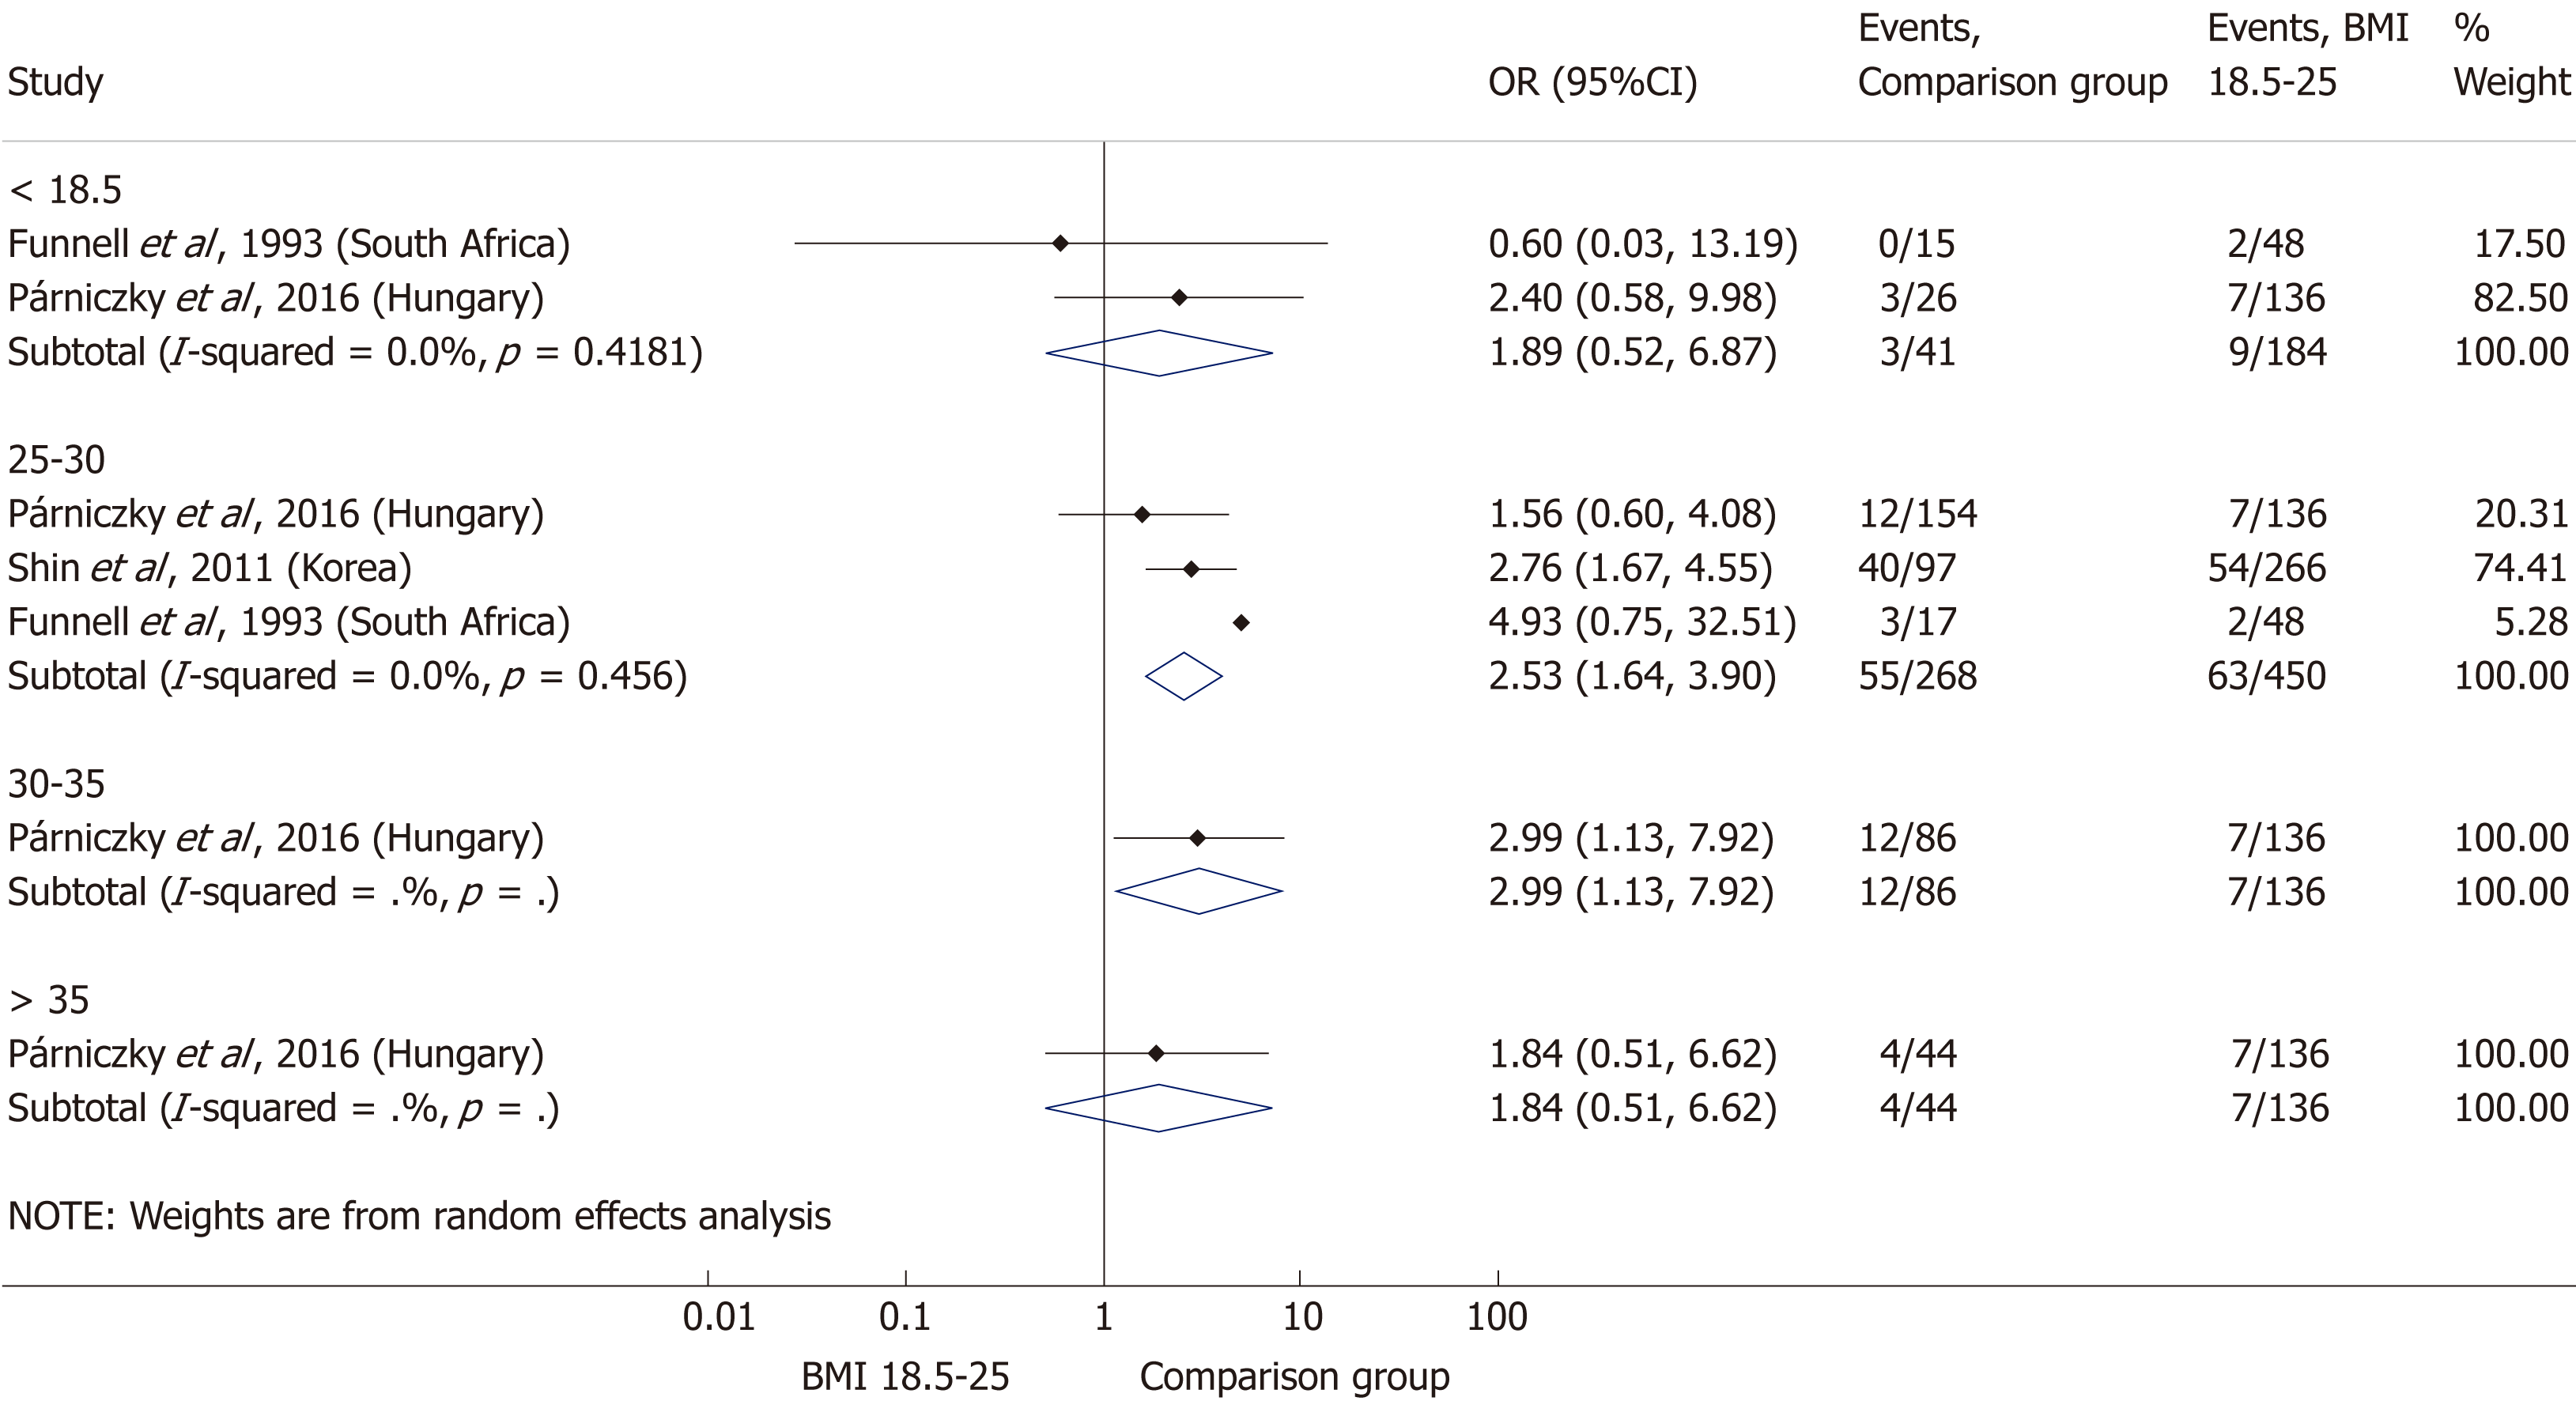
Figure 7 Forest plot of acute pancreatitis severity comparing the normal body-mass index group (body-mass index 18.
5-25) to other body-mass index categories. Filled circles represent the odds ratio derived from the studies analyzed. Horizontal bars represent 95% CI. Empty rhombuses show the overall, combined effect (OR is the middle of the rhombus and CIs are the edges). BMI: Body-mass index; CI: Confidence interval; OR: Odds ratio.
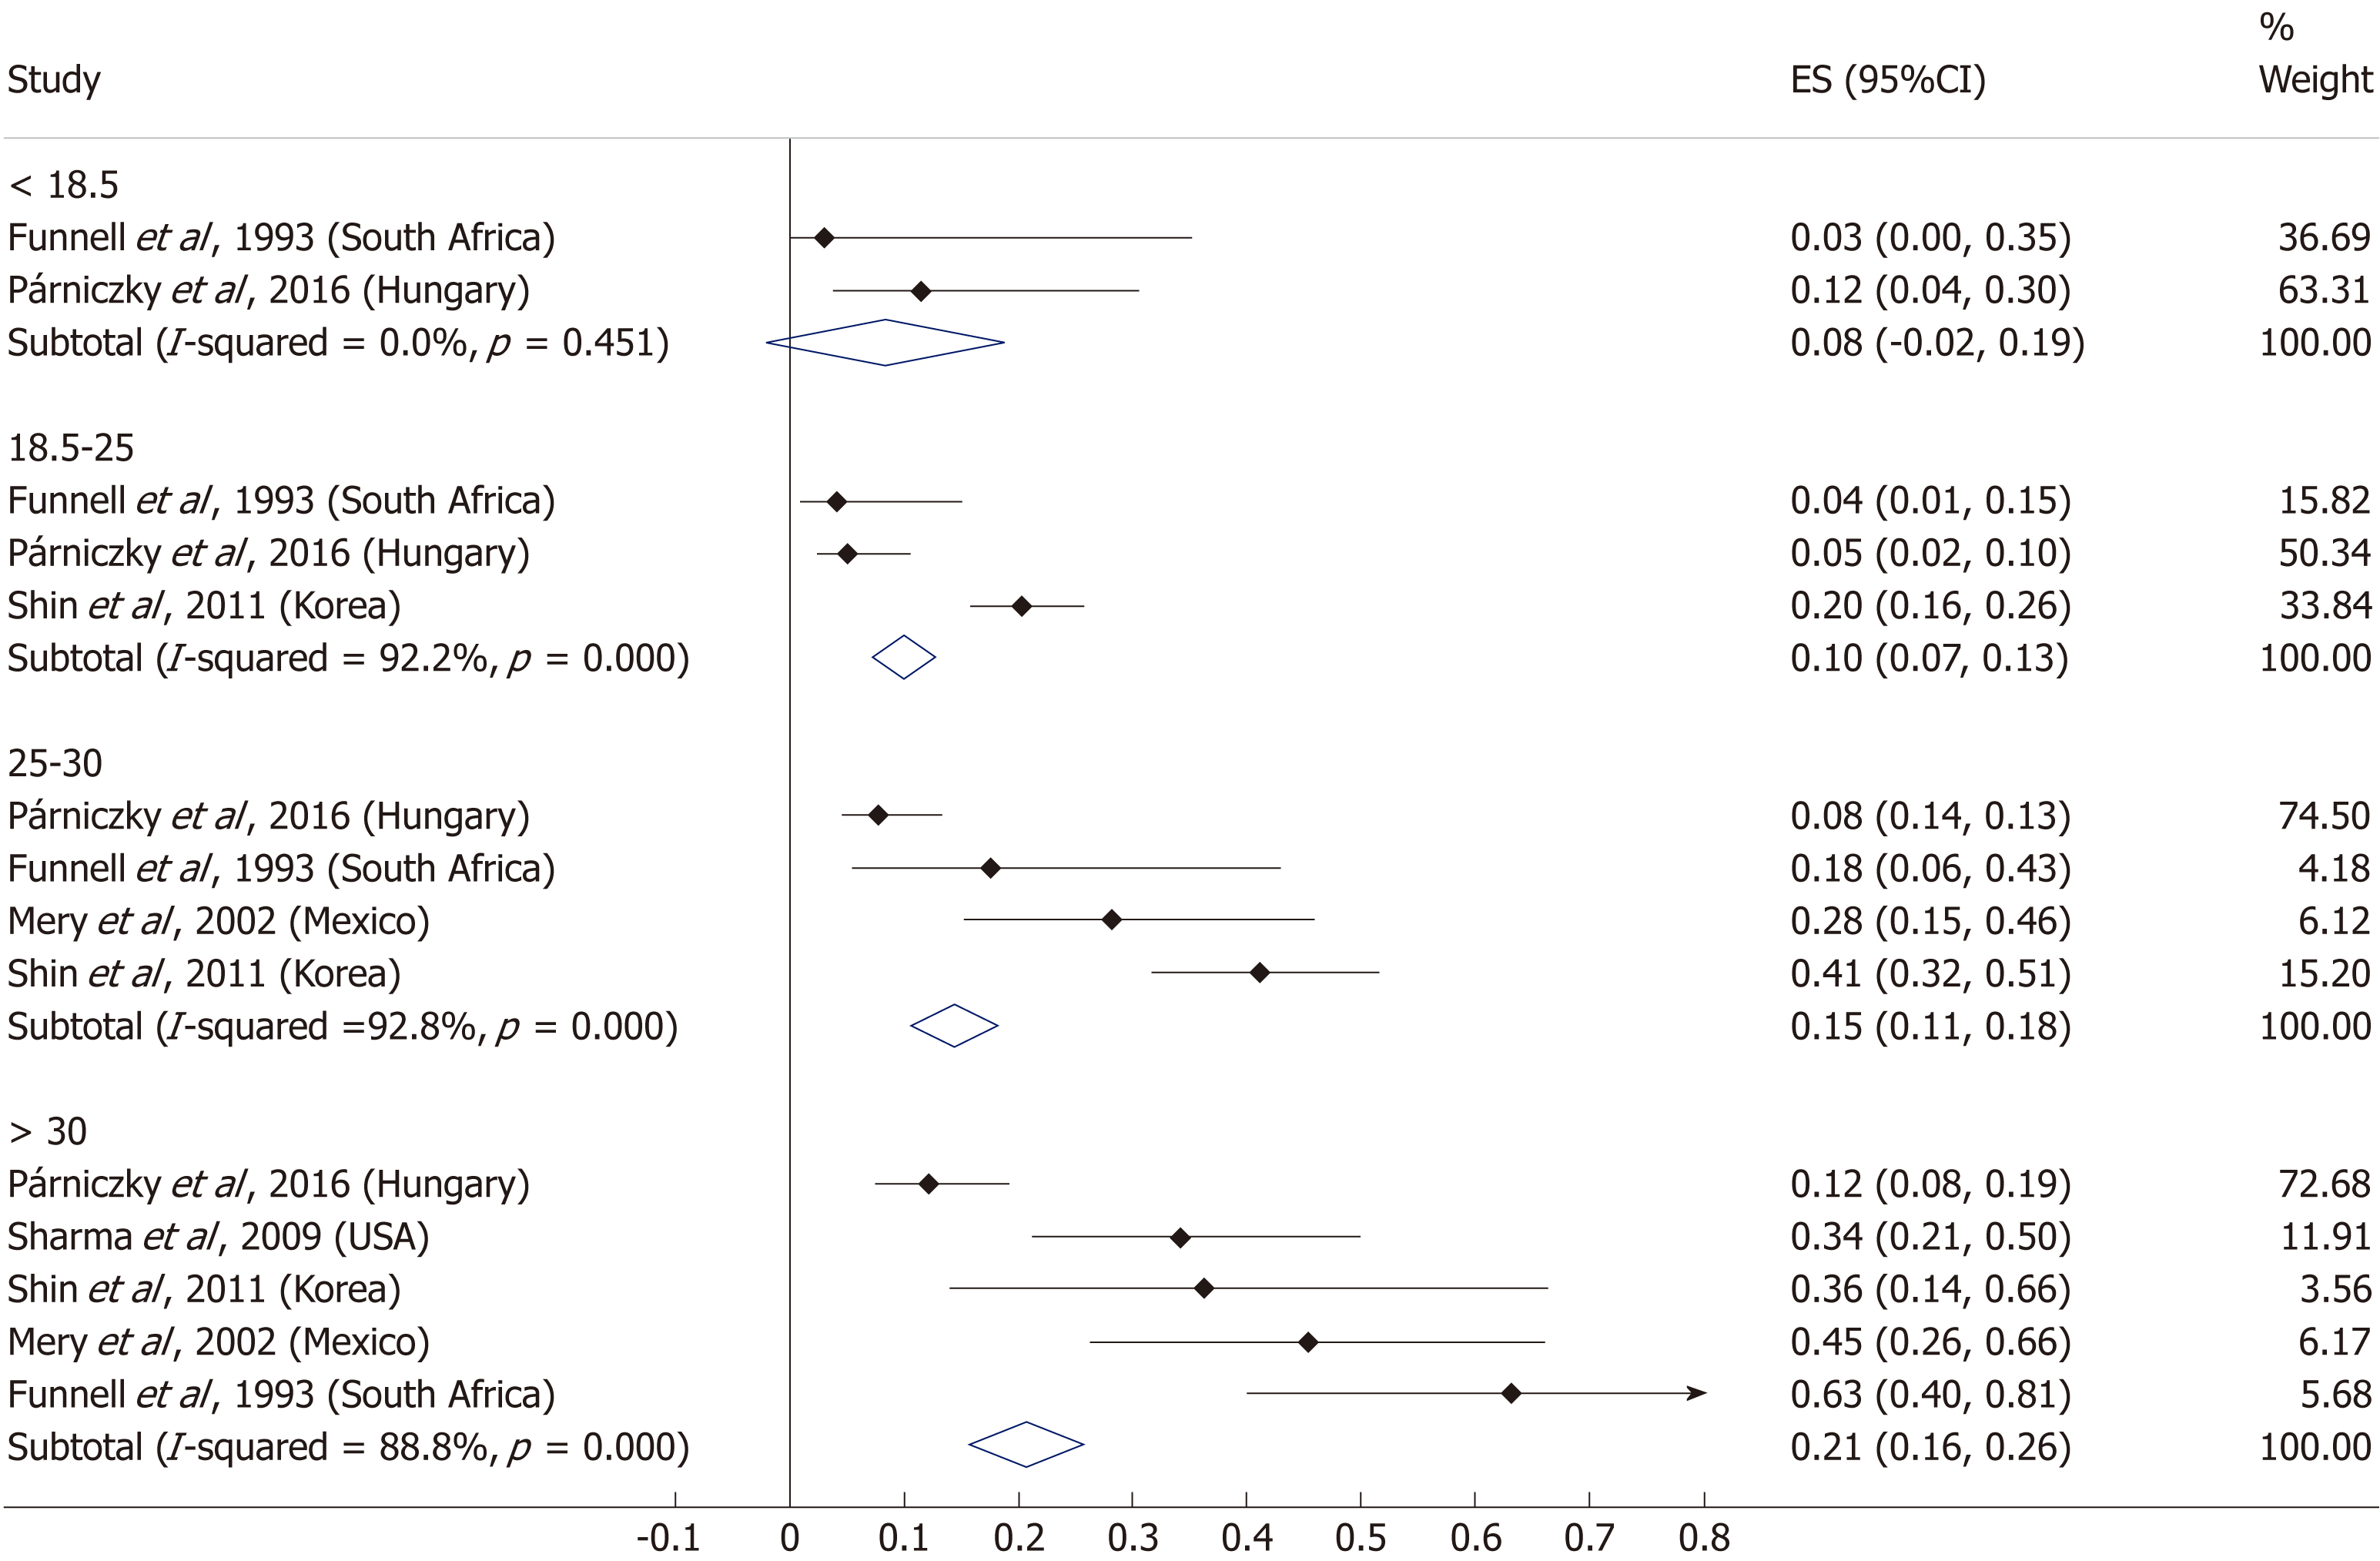
Figure 8 Subgroup analysis of body-mass index and acute pancreatitis severity displayed on forest plot.
Filled circles represent the odds ratio derived from the studies analyzed. Horizontal bars represent 95%CI. Empty rhombuses show the overall, combined effect (OR is the middle of the rhombus and CIs are the edges). CI: Confidence interval.
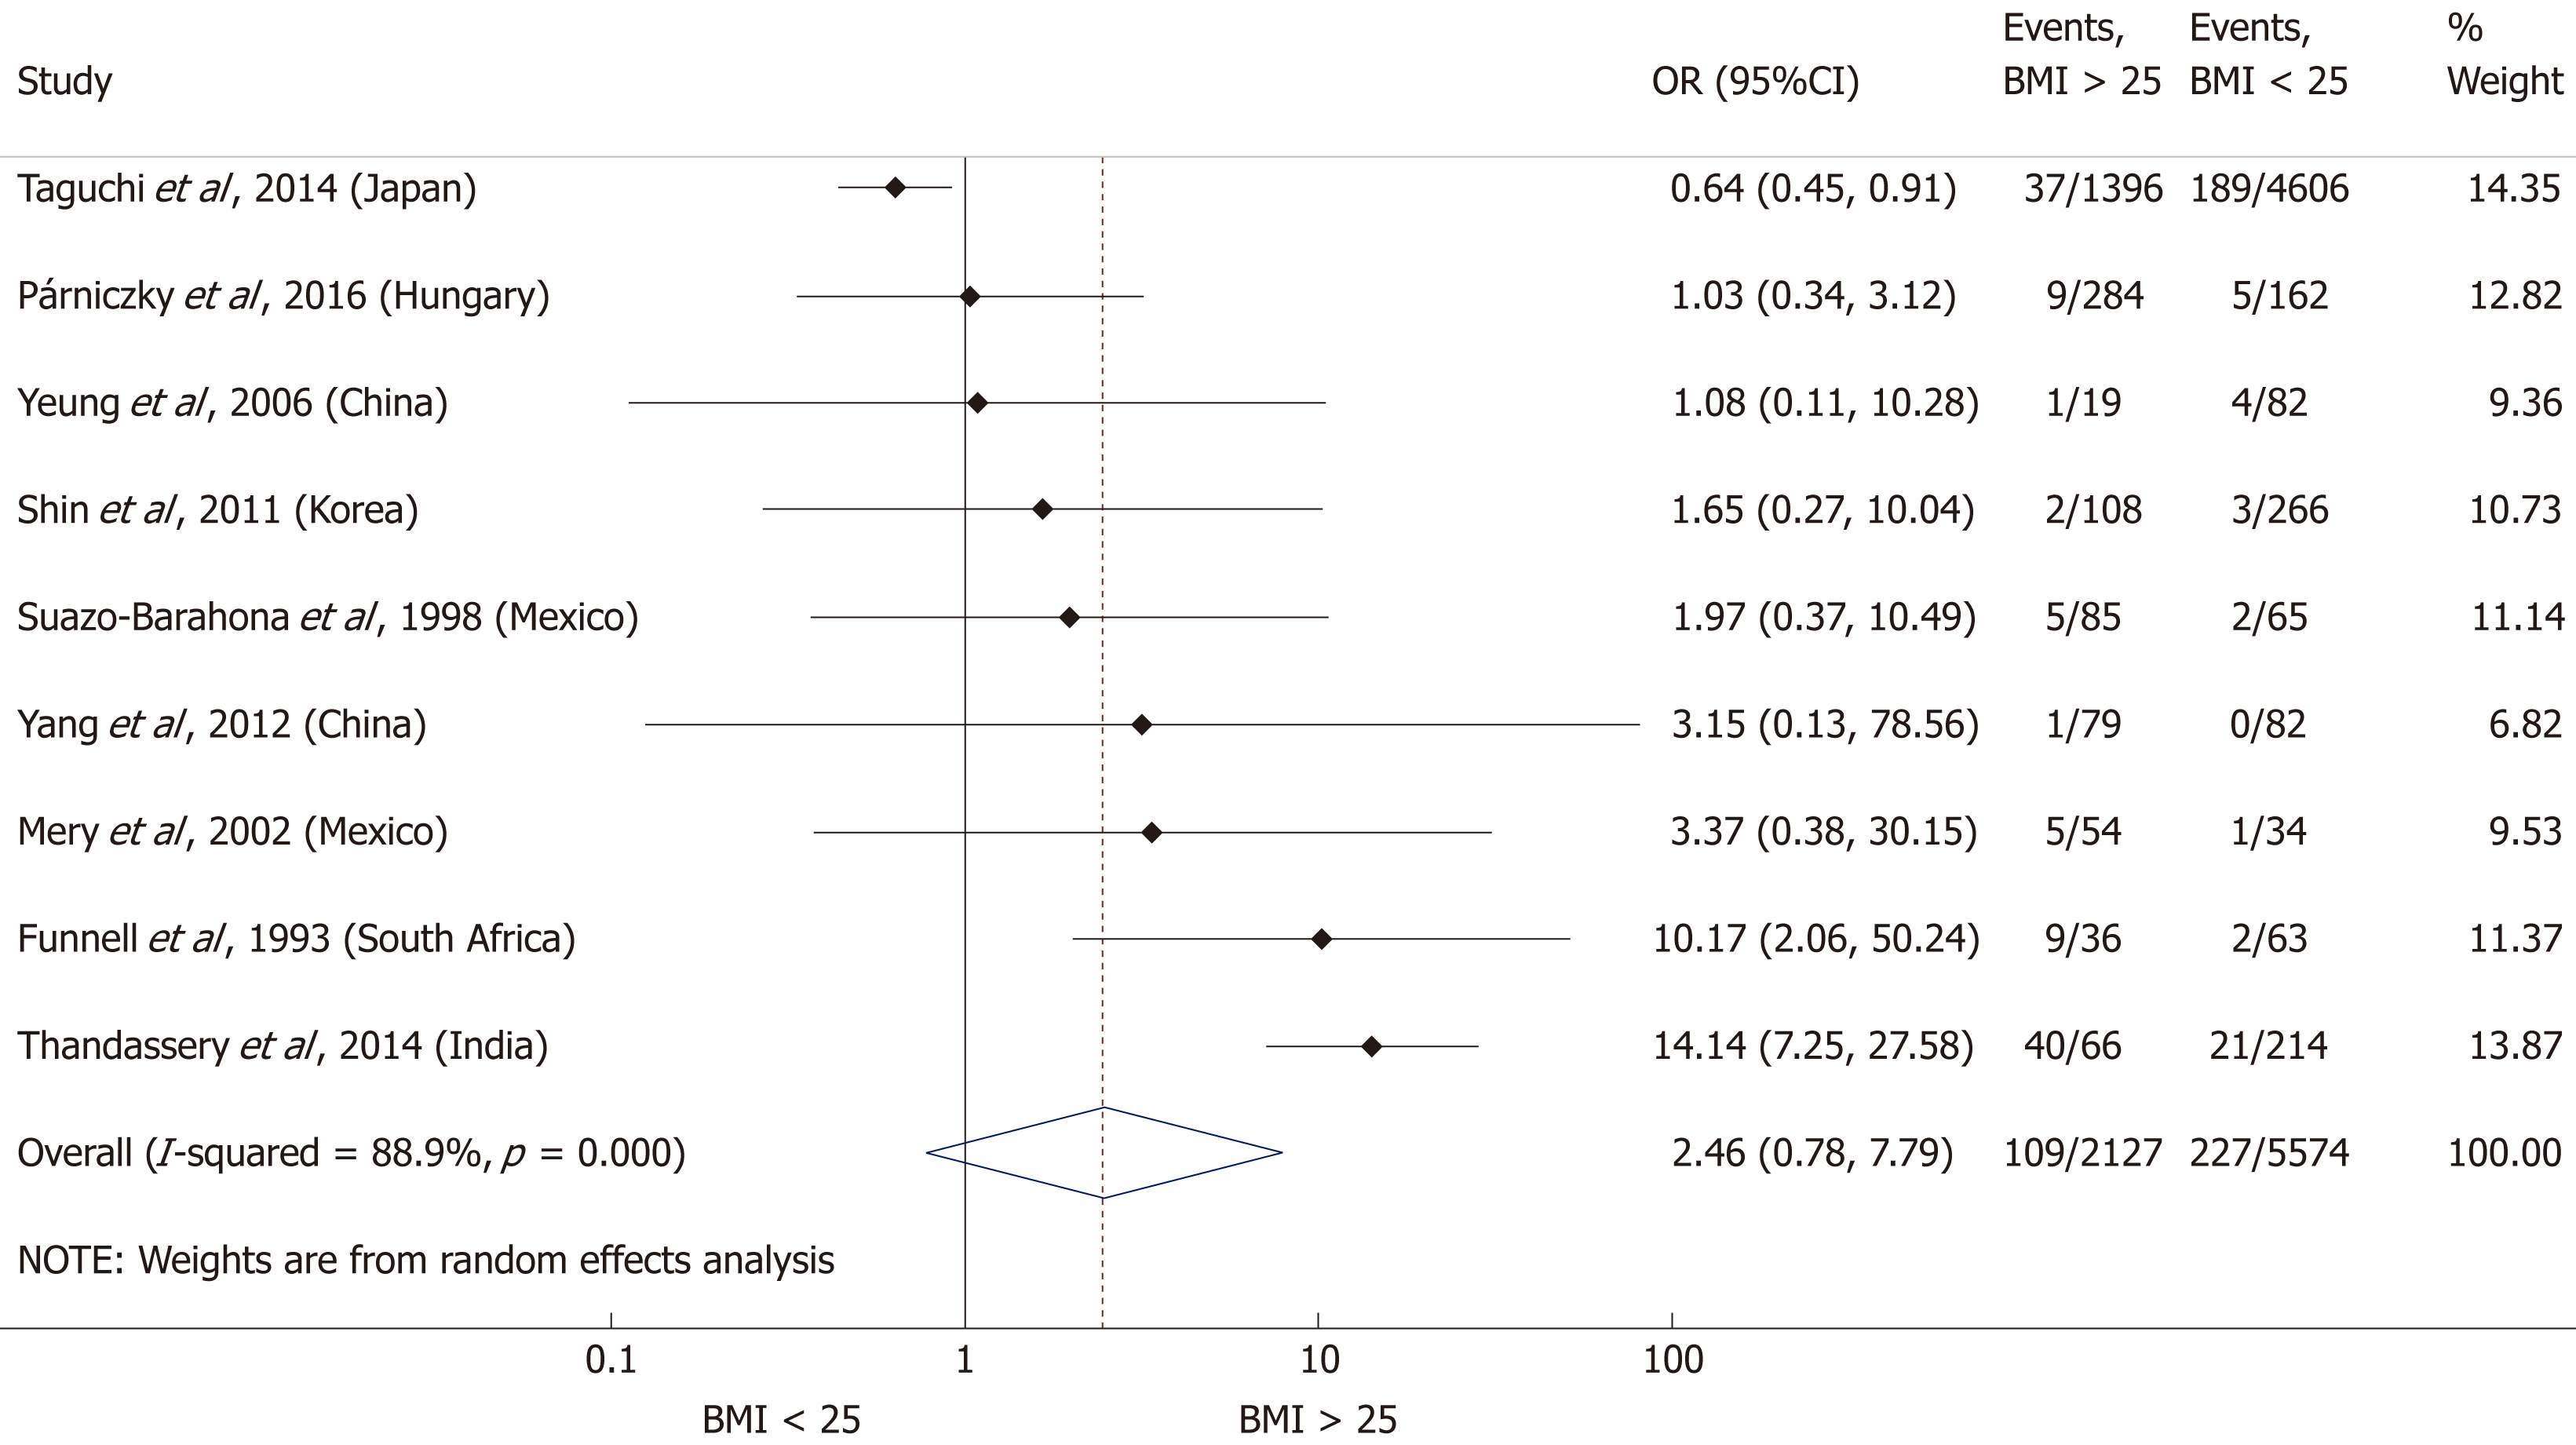
Figure 9 Forest plot of mortality comparing the body-mass index < 25 and body-mass index > 25 subgroups.
Filled circles represent the odds ratio derived from the studies analyzed. Horizontal bars represent 95% CI. Empty rhombuses show the overall, combined effect (OR is the middle of the rhombus and CIs are the edges). BMI: Body-mass index; CI: Confidence interval; OR: Odds ratio.
Figure 10 Forest plot of mortality comparing the body-mass index < 30 and body-mass index > 30 subgroups.
Filled circles represent the odds ratio derived from the studies analyzed. Horizontal bars represent 95%CI. Empty rhombuses show the overall, combined effect (OR is the middle of the rhombus and CIs are the edges). BMI: Body-mass index; CI: Confidence interval; OR: Odds ratio.
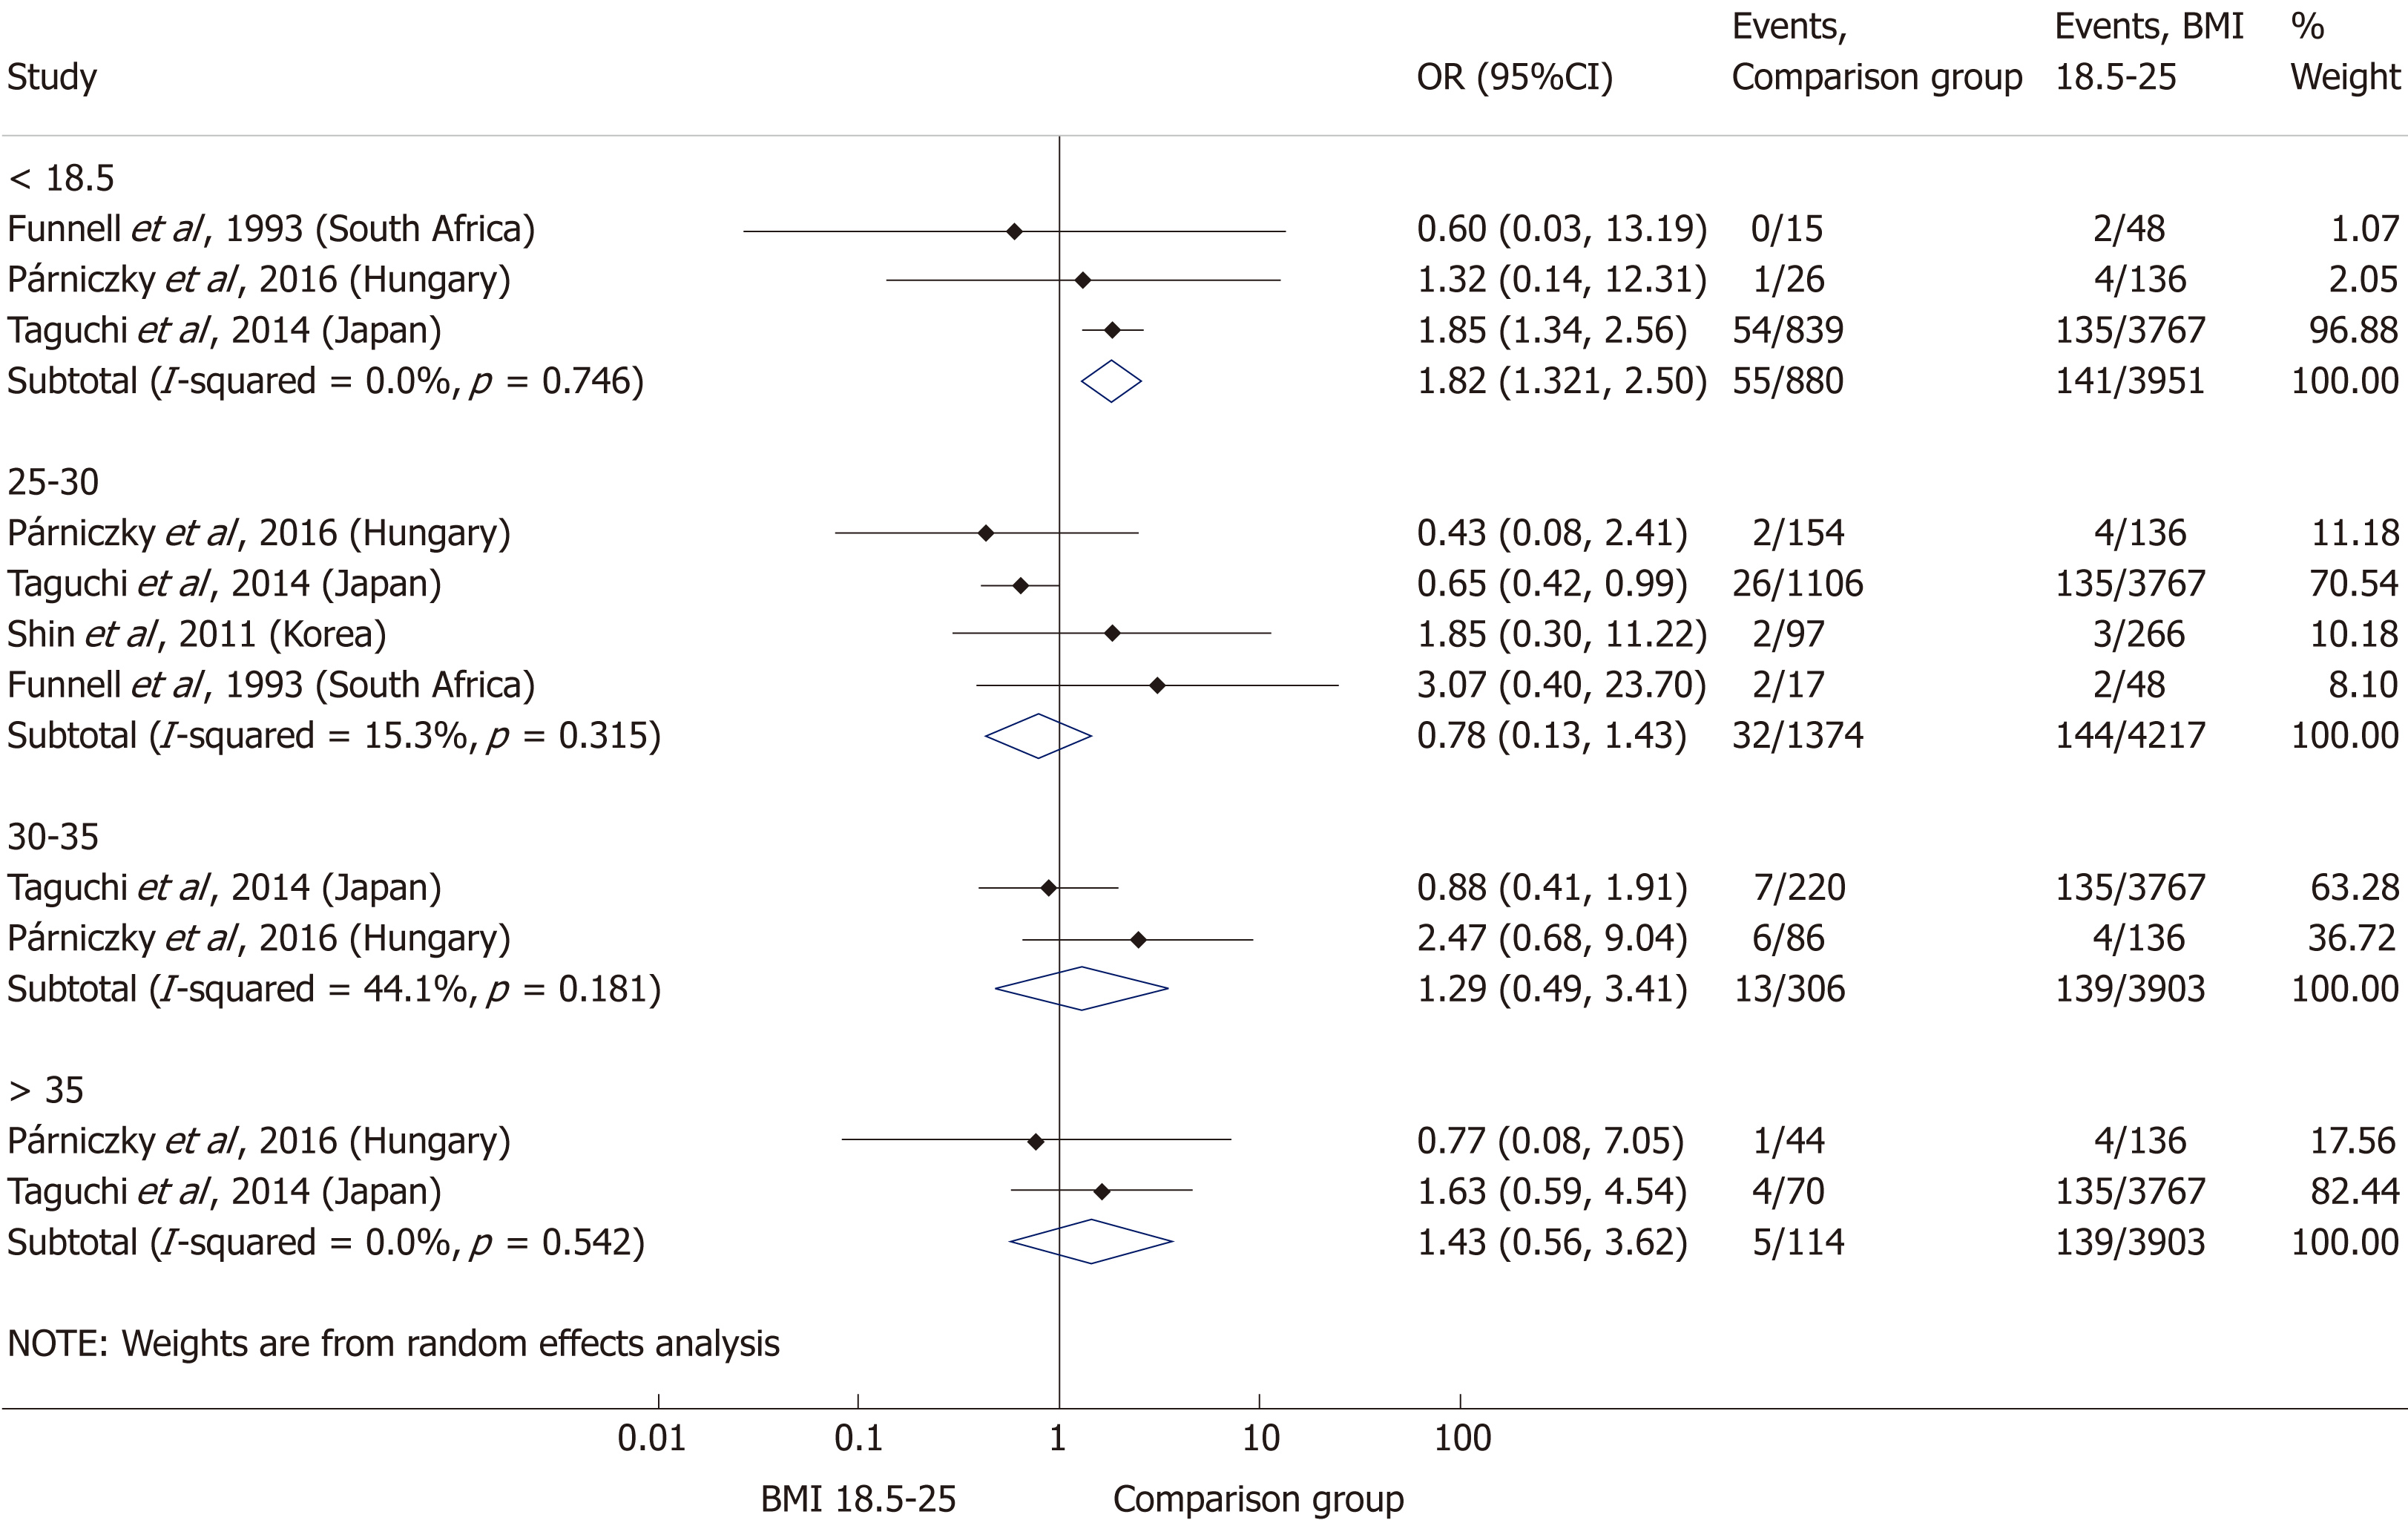
Figure 11 Forest plot of mortality comparing the normal body-mass index group (body-mass index 18.
5-25) to other body-mass index categories. Filled circles represent the odds ratio derived from the studies analyzed. Horizontal bars represent 95% CI. Empty rhombuses show the overall, combined effect (OR is the middle of the rhombus and CIs are the edges). BMI: Body-mass index; CI: Confidence interval; OR: Odds ratio.
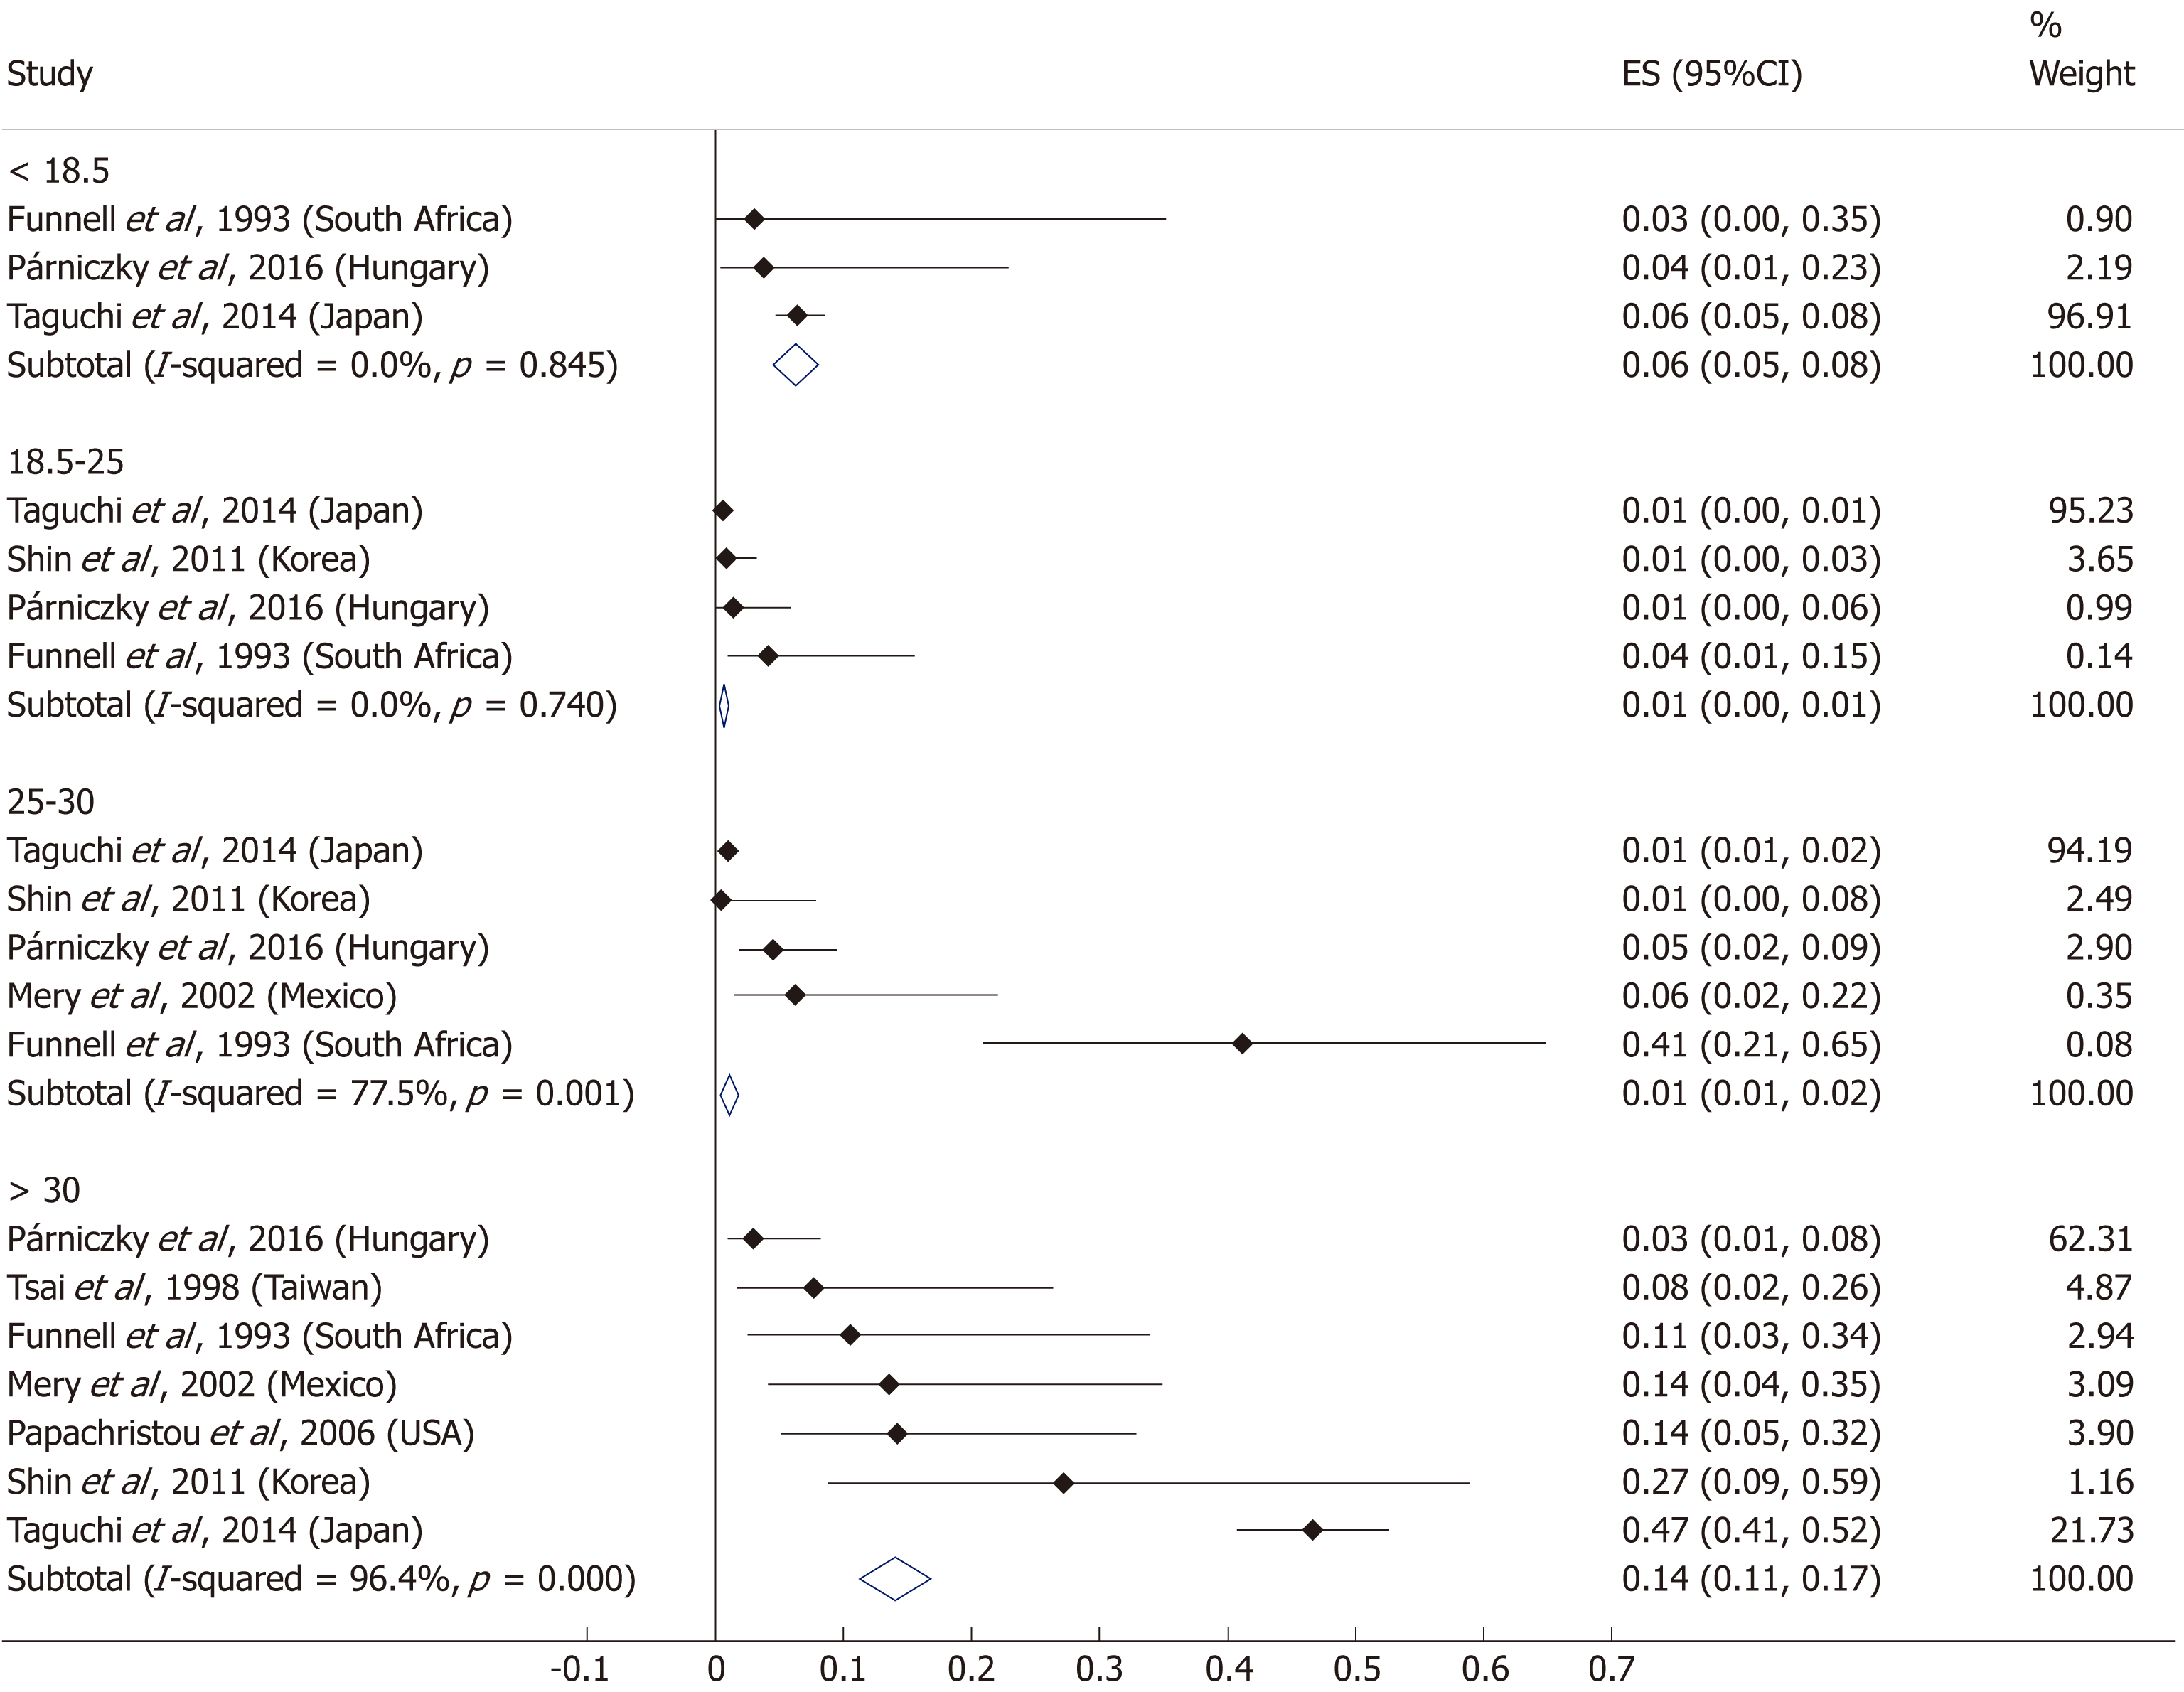
Figure 12 Subgroup analysis of body-mass index and acute pancreatitis mortality displayed on forest plot.
Filled circles represent the odds ratio derived from the studies analyzed. Horizontal bars represent 95%CI. Empty rhombuses show the overall, combined effect (OR is the middle of the rhombus and CIs are the edges). CI: Confidence interval.
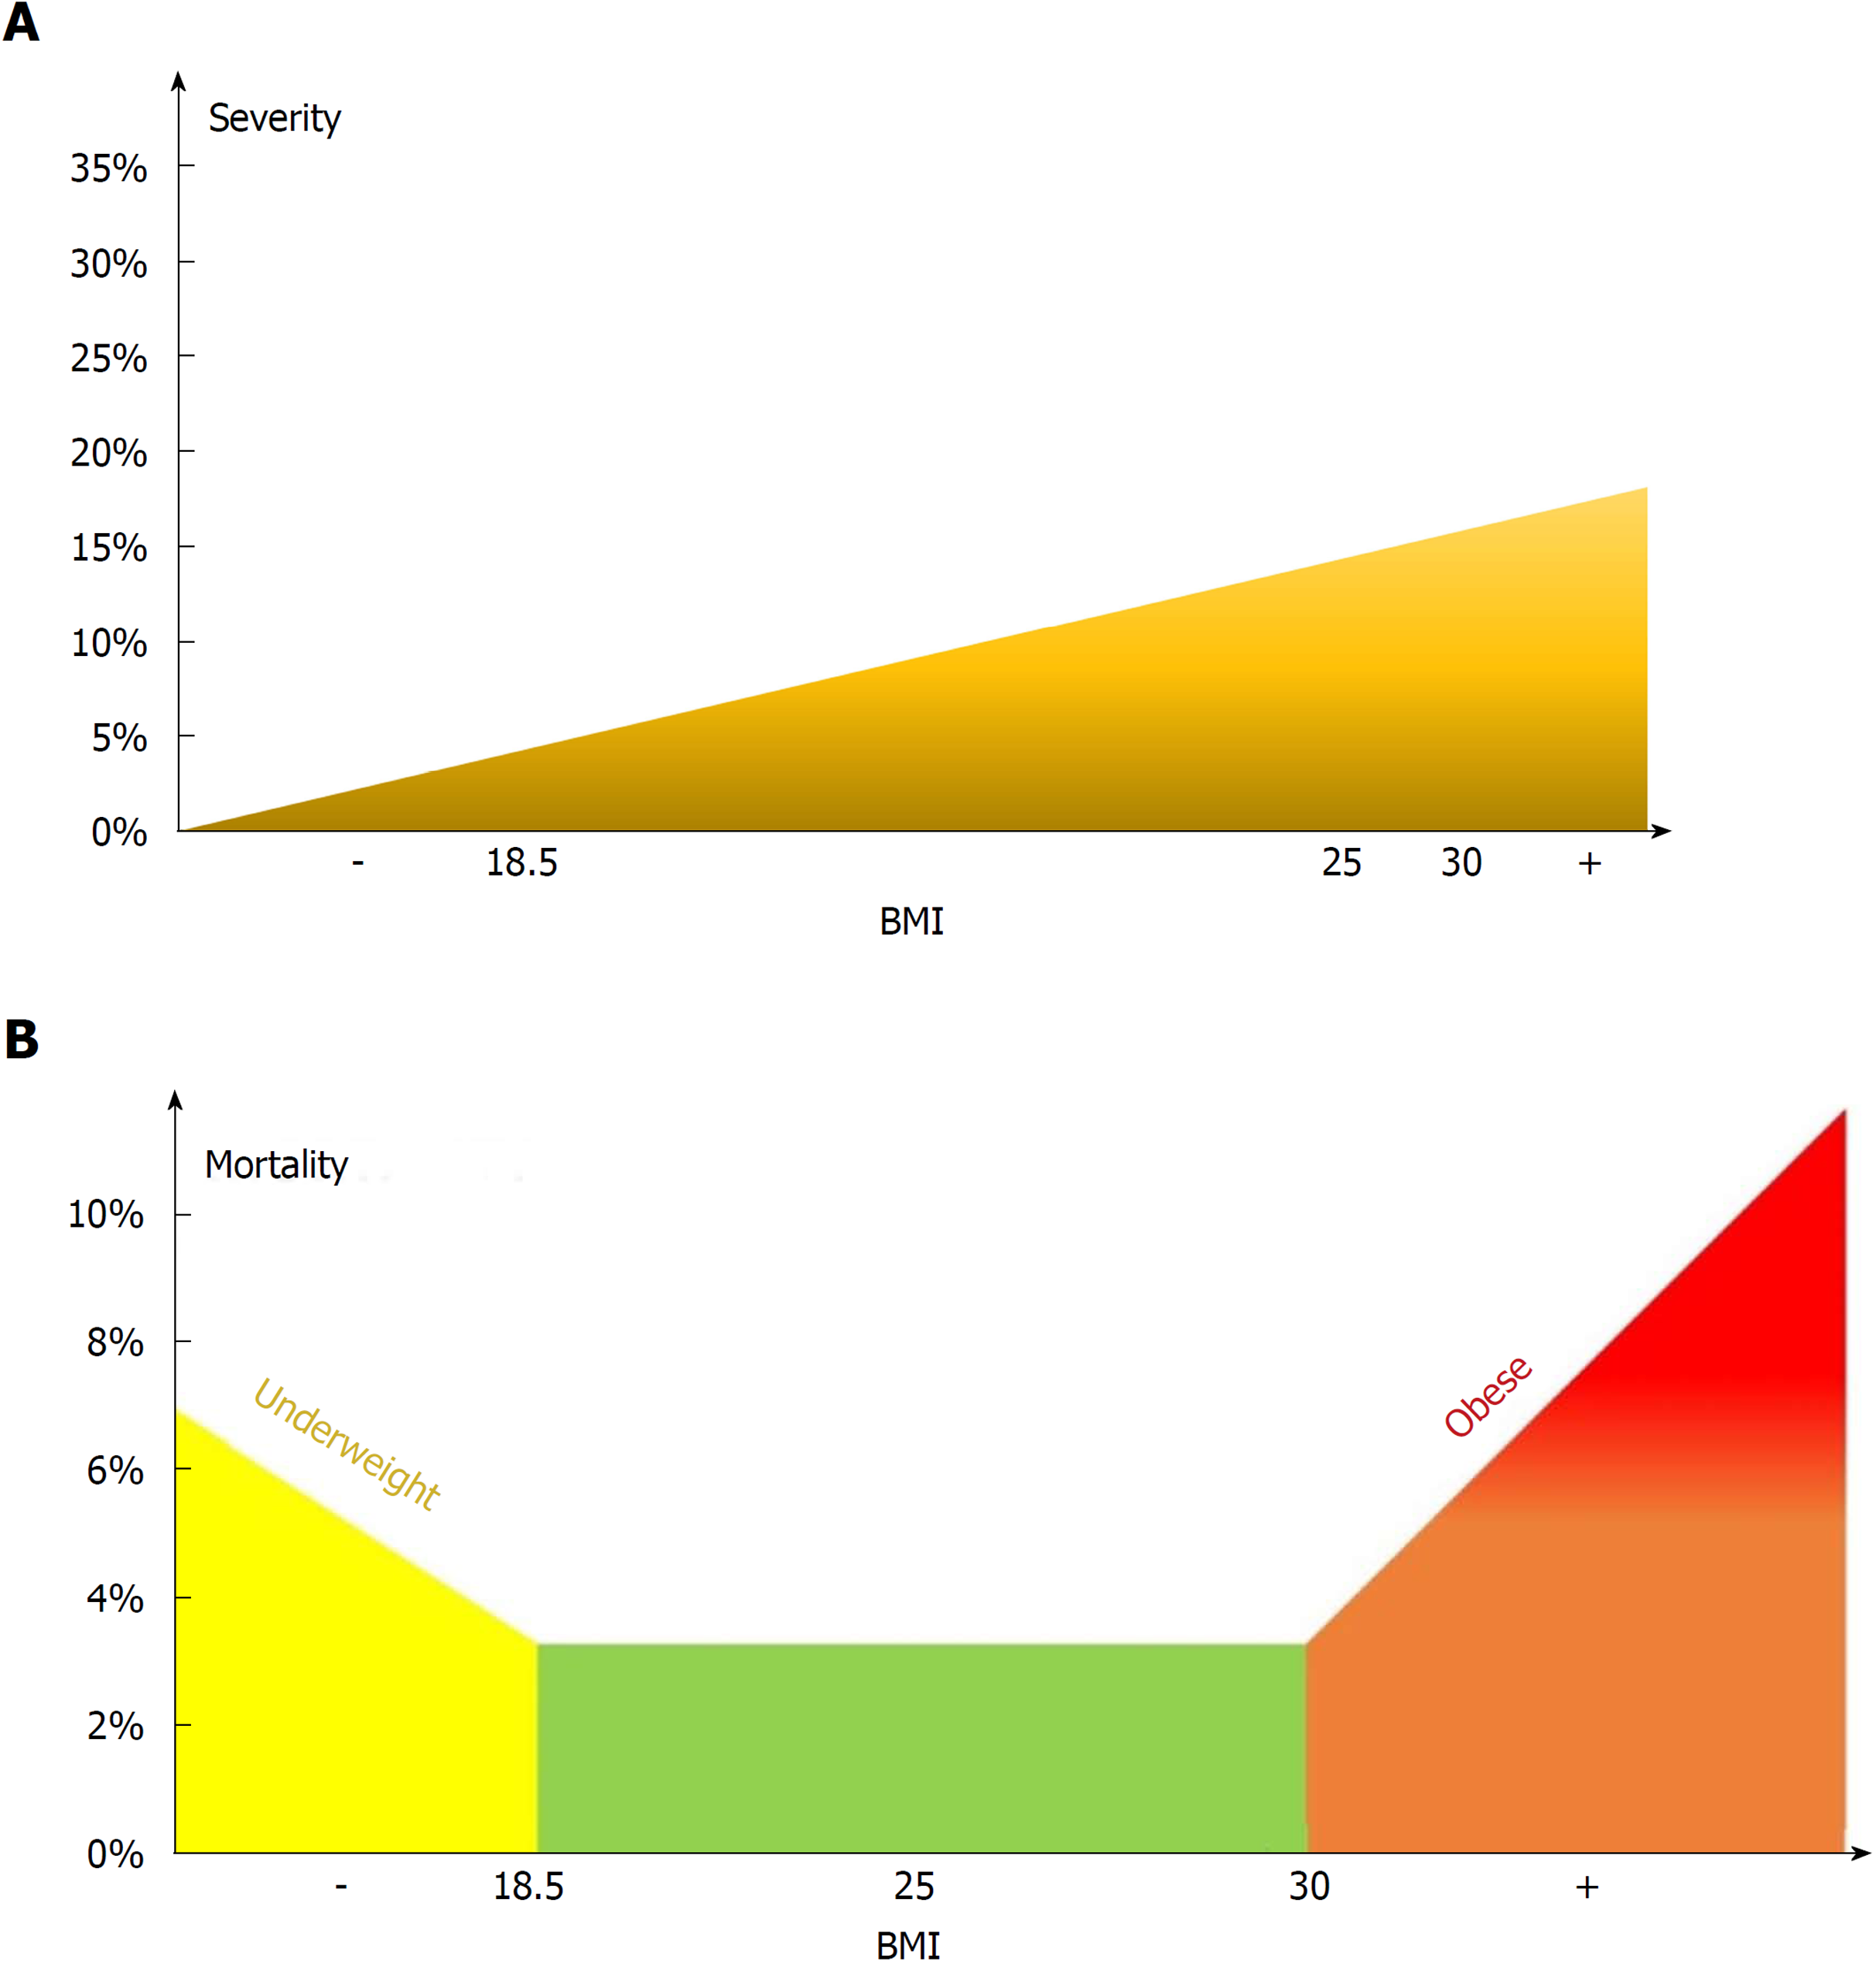
Figure 13 Model for the effect of body-mass index on severity (A) and mortality (B).
- Citation: Dobszai D, Mátrai P, Gyöngyi Z, Csupor D, Bajor J, Erőss B, Mikó A, Szakó L, Meczker Á, Hágendorn R, Márta K, Szentesi A, Hegyi P, on behalf of the Hungarian Pancreatic Study Group. Body-mass index correlates with severity and mortality in acute pancreatitis: A meta-analysis. World J Gastroenterol 2019; 25(6): 729-743
- URL: https://www.wjgnet.com/1007-9327/full/v25/i6/729.htm
- DOI: https://dx.doi.org/10.3748/wjg.v25.i6.729


