Copyright
©The Author(s) 2019.
World J Gastroenterol. Dec 14, 2019; 25(46): 6728-6742
Published online Dec 14, 2019. doi: 10.3748/wjg.v25.i46.6728
Published online Dec 14, 2019. doi: 10.3748/wjg.v25.i46.6728
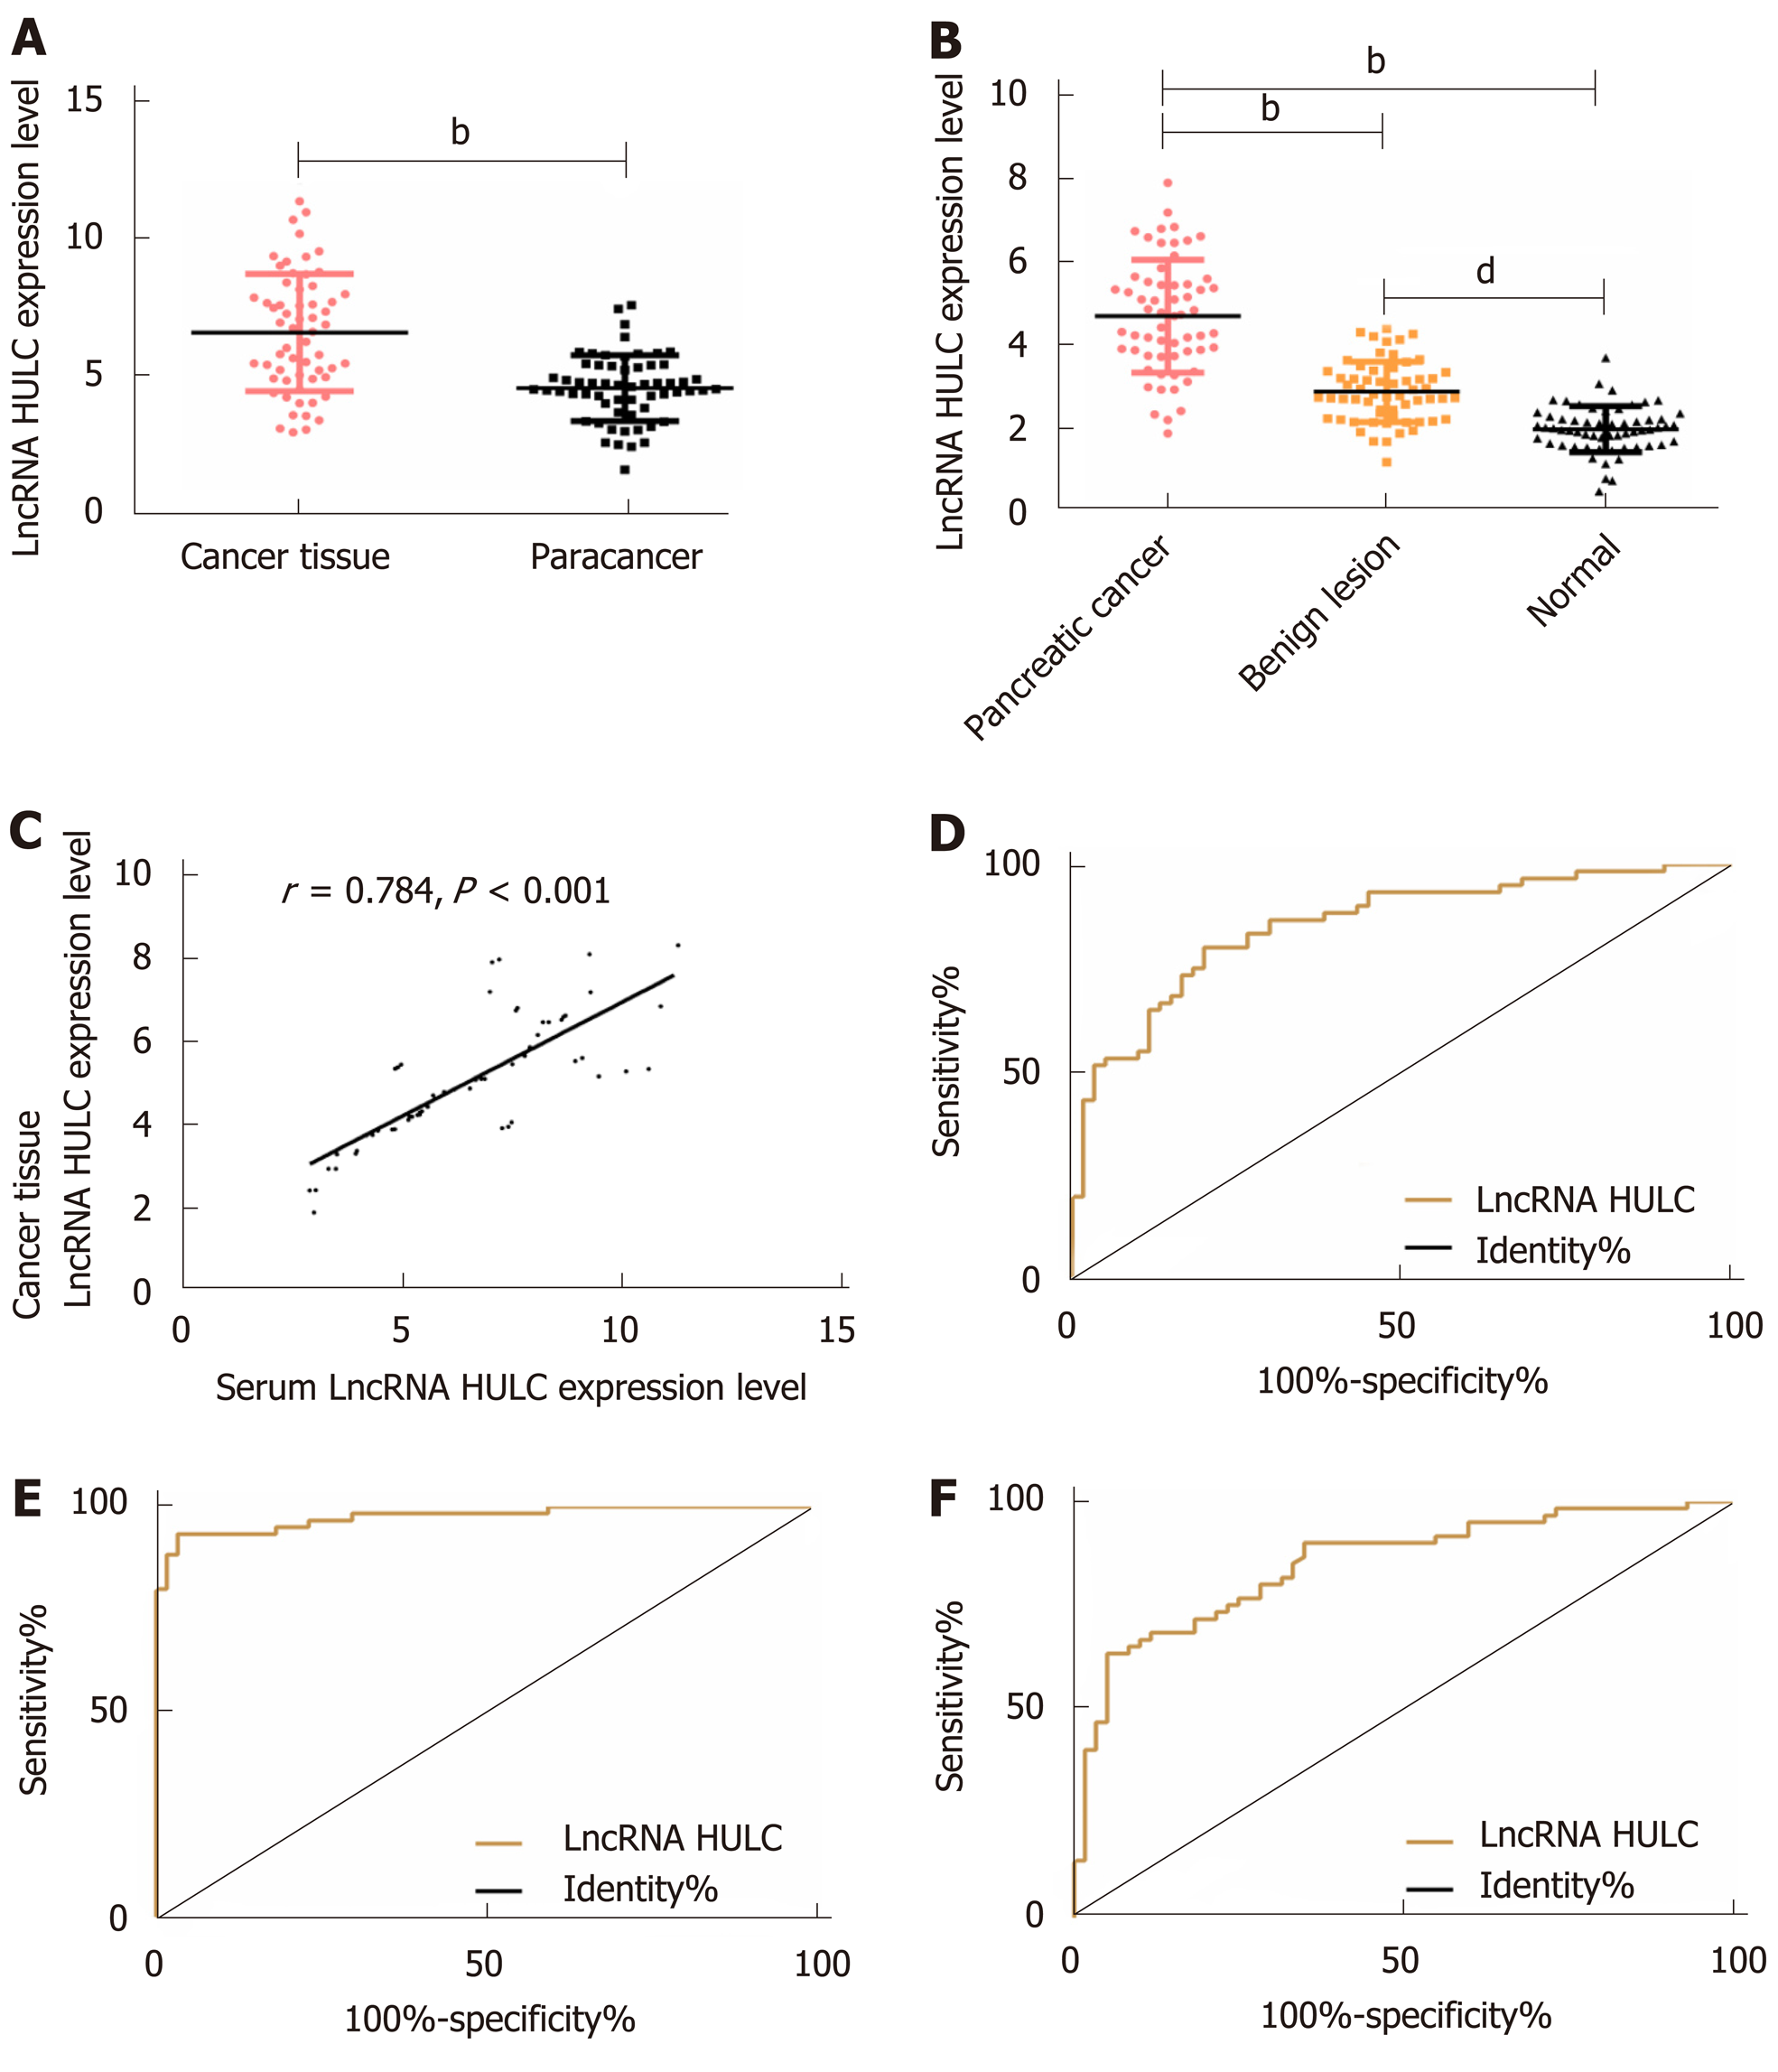
Figure 1 Distinguishing between patients with pancreatic cancer, patients with benign diseases and healthy subjects using HULC.
A: Expression of HULC in pancreatic cancer tissues and tumor-adjacent tissues; B: Expression of serum HULC in the 3 groups; C: Correlation between pancreatic cancer tissues and expression of serum HULC; D: ROC curve of serum HULC for distinguishing patients with pancreatic cancer from those with benign diseases; E: ROC curve of serum HULC for distinguishing patients with pancreatic cancer from healthy subjects; F: ROC curve of serum HULC for distinguishing patients with benign diseases from healthy subjects. bP < 0.01, dP < 0.01 for between-group comparisons. ROC: Receiver operating characteristic.
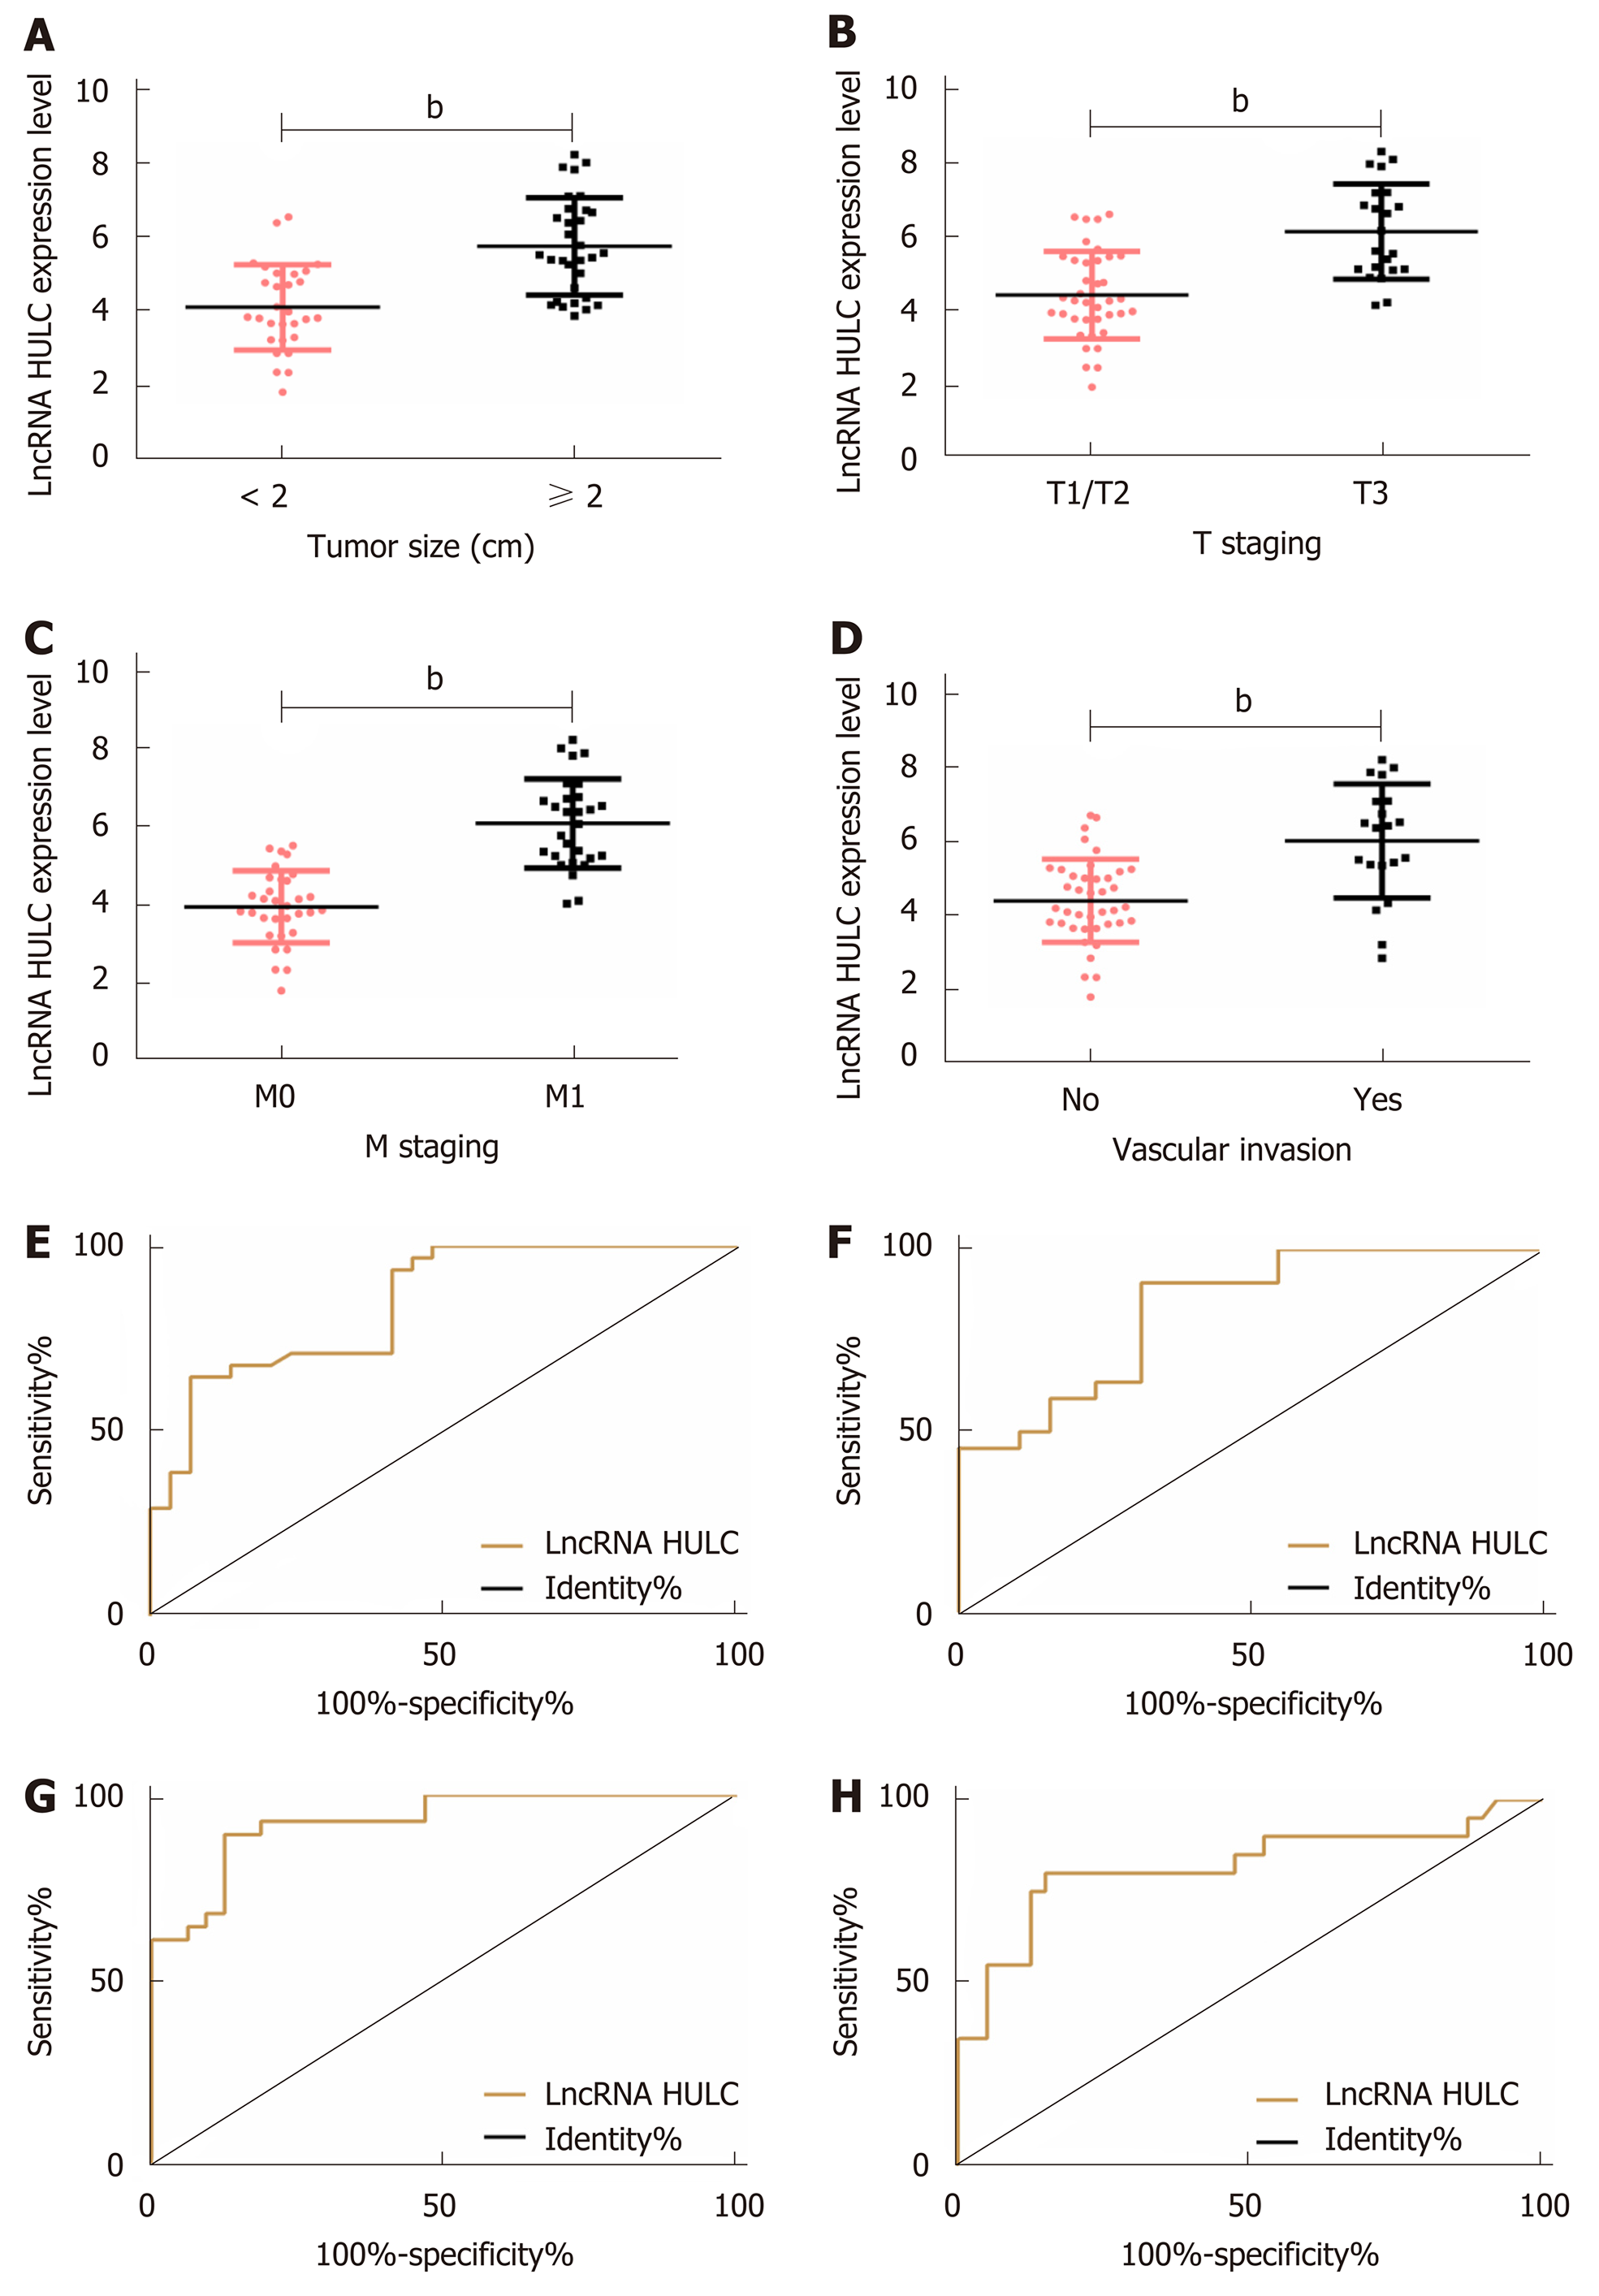
Figure 2 Relationship between HULC and clinical pathological parameters.
A: The expression of HULC in pancreatic cancer patients with different tumor sizes; B: The expression of HULC in different pancreatic cancer patients at T staging; C: The expression of HULC in different pancreatic cancer patients at M staging; D: The expression of HULC in pancreatic cancer patients without vascular invasion; E: ROC curve of HULC for diagnosing tumor size; F: ROC curve of HULC for diagnosing T staging; G: ROC curve of HULC for diagnosing M staging; H: ROC curve of HULC for diagnosing vascular invasion. bP < 0.01 for between-group comparisons. ROC: Receiver operating characteristic.
Figure 3 Relationship between HULC and prognosis and survival of pancreatic cancer.
A: Relationship between high and low expression of HULC and 3-year OS of patients with pancreatic cancer; B: 5-year OS of patients with pancreatic cancer; C: Relationship between high and low expression of HULC and 5-year OS of patients with pancreatic cancer. OS: Overall survival.
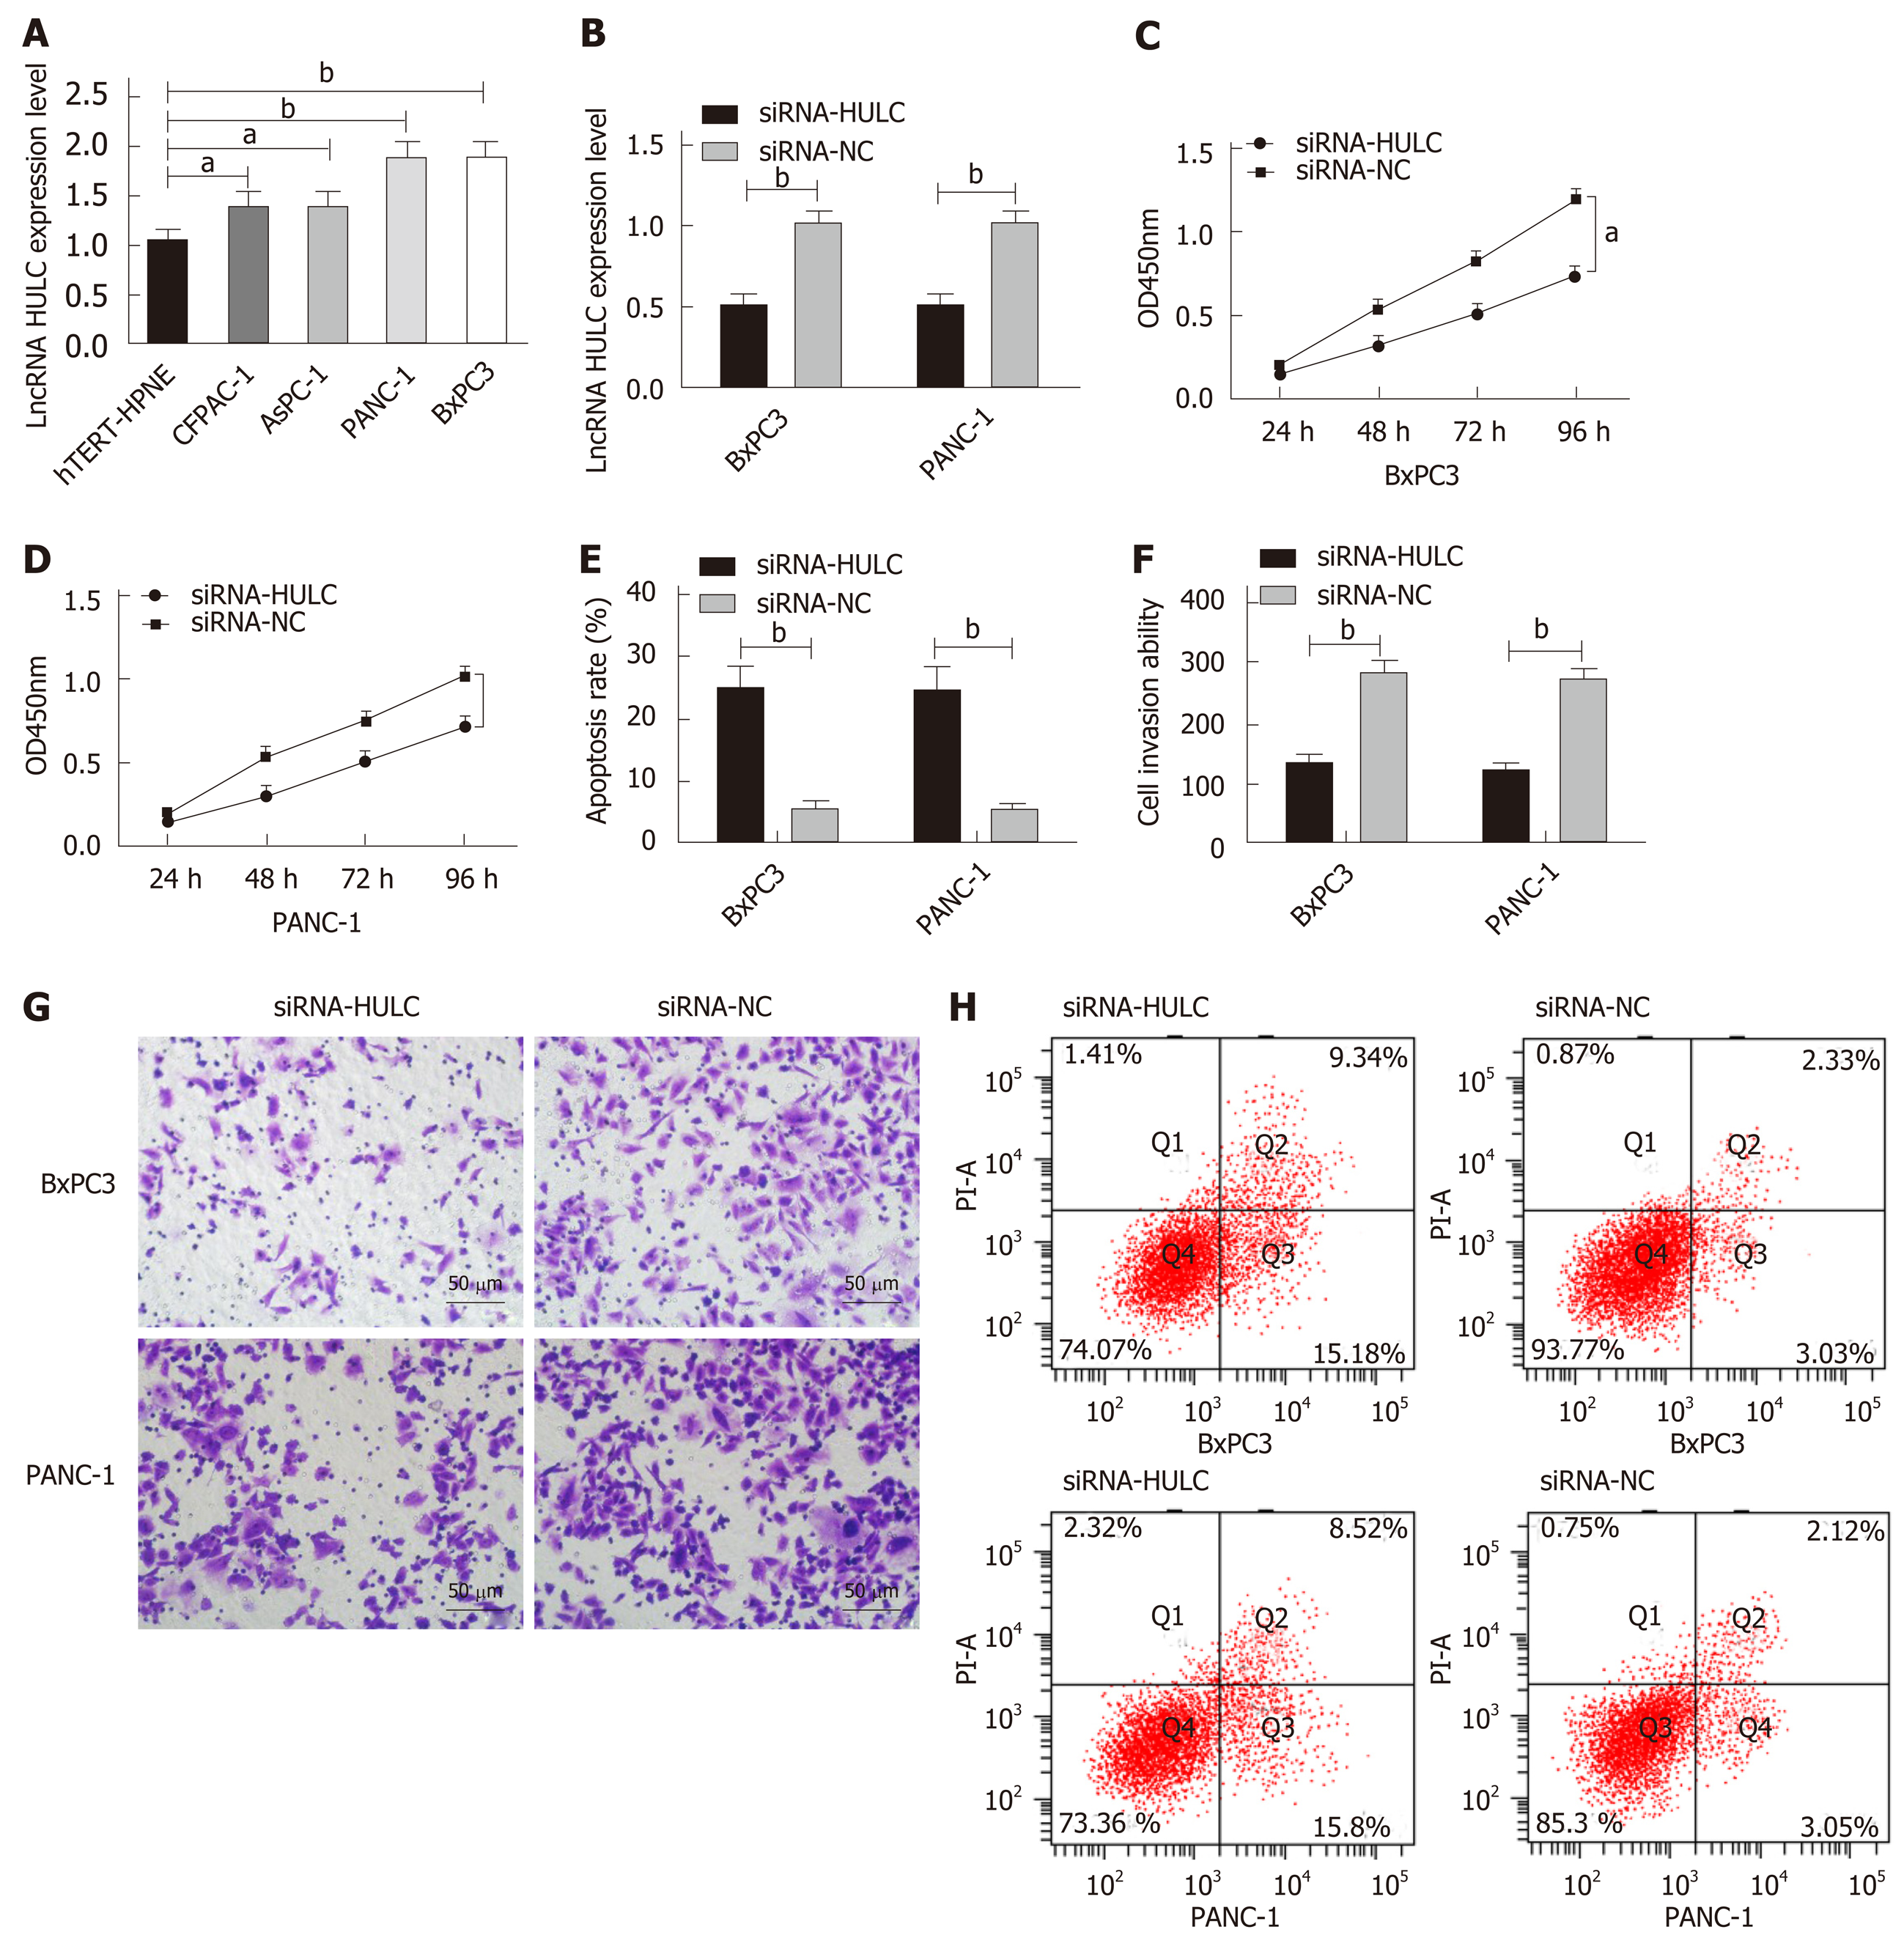
Figure 4 Expression of HULC in cells and its effects on the biological function of cells.
A: The expression of HULC in cell lines; B: The expression of HULC in BxPC3 and PANC-1 cells after transfection; C. Proliferation of BxPC3 cells after transfection; D: Proliferation of PANC-1 cells after transfection; E: Apoptosis of BxPC3 and PANC-1 cells after transfection; F: Invasion of BxPC3 and PANC-1 cells after transfection; G: Cell invasion; H: Cell apoptosis. aP < 0.05, bP < 0.01 for between-group comparisons.
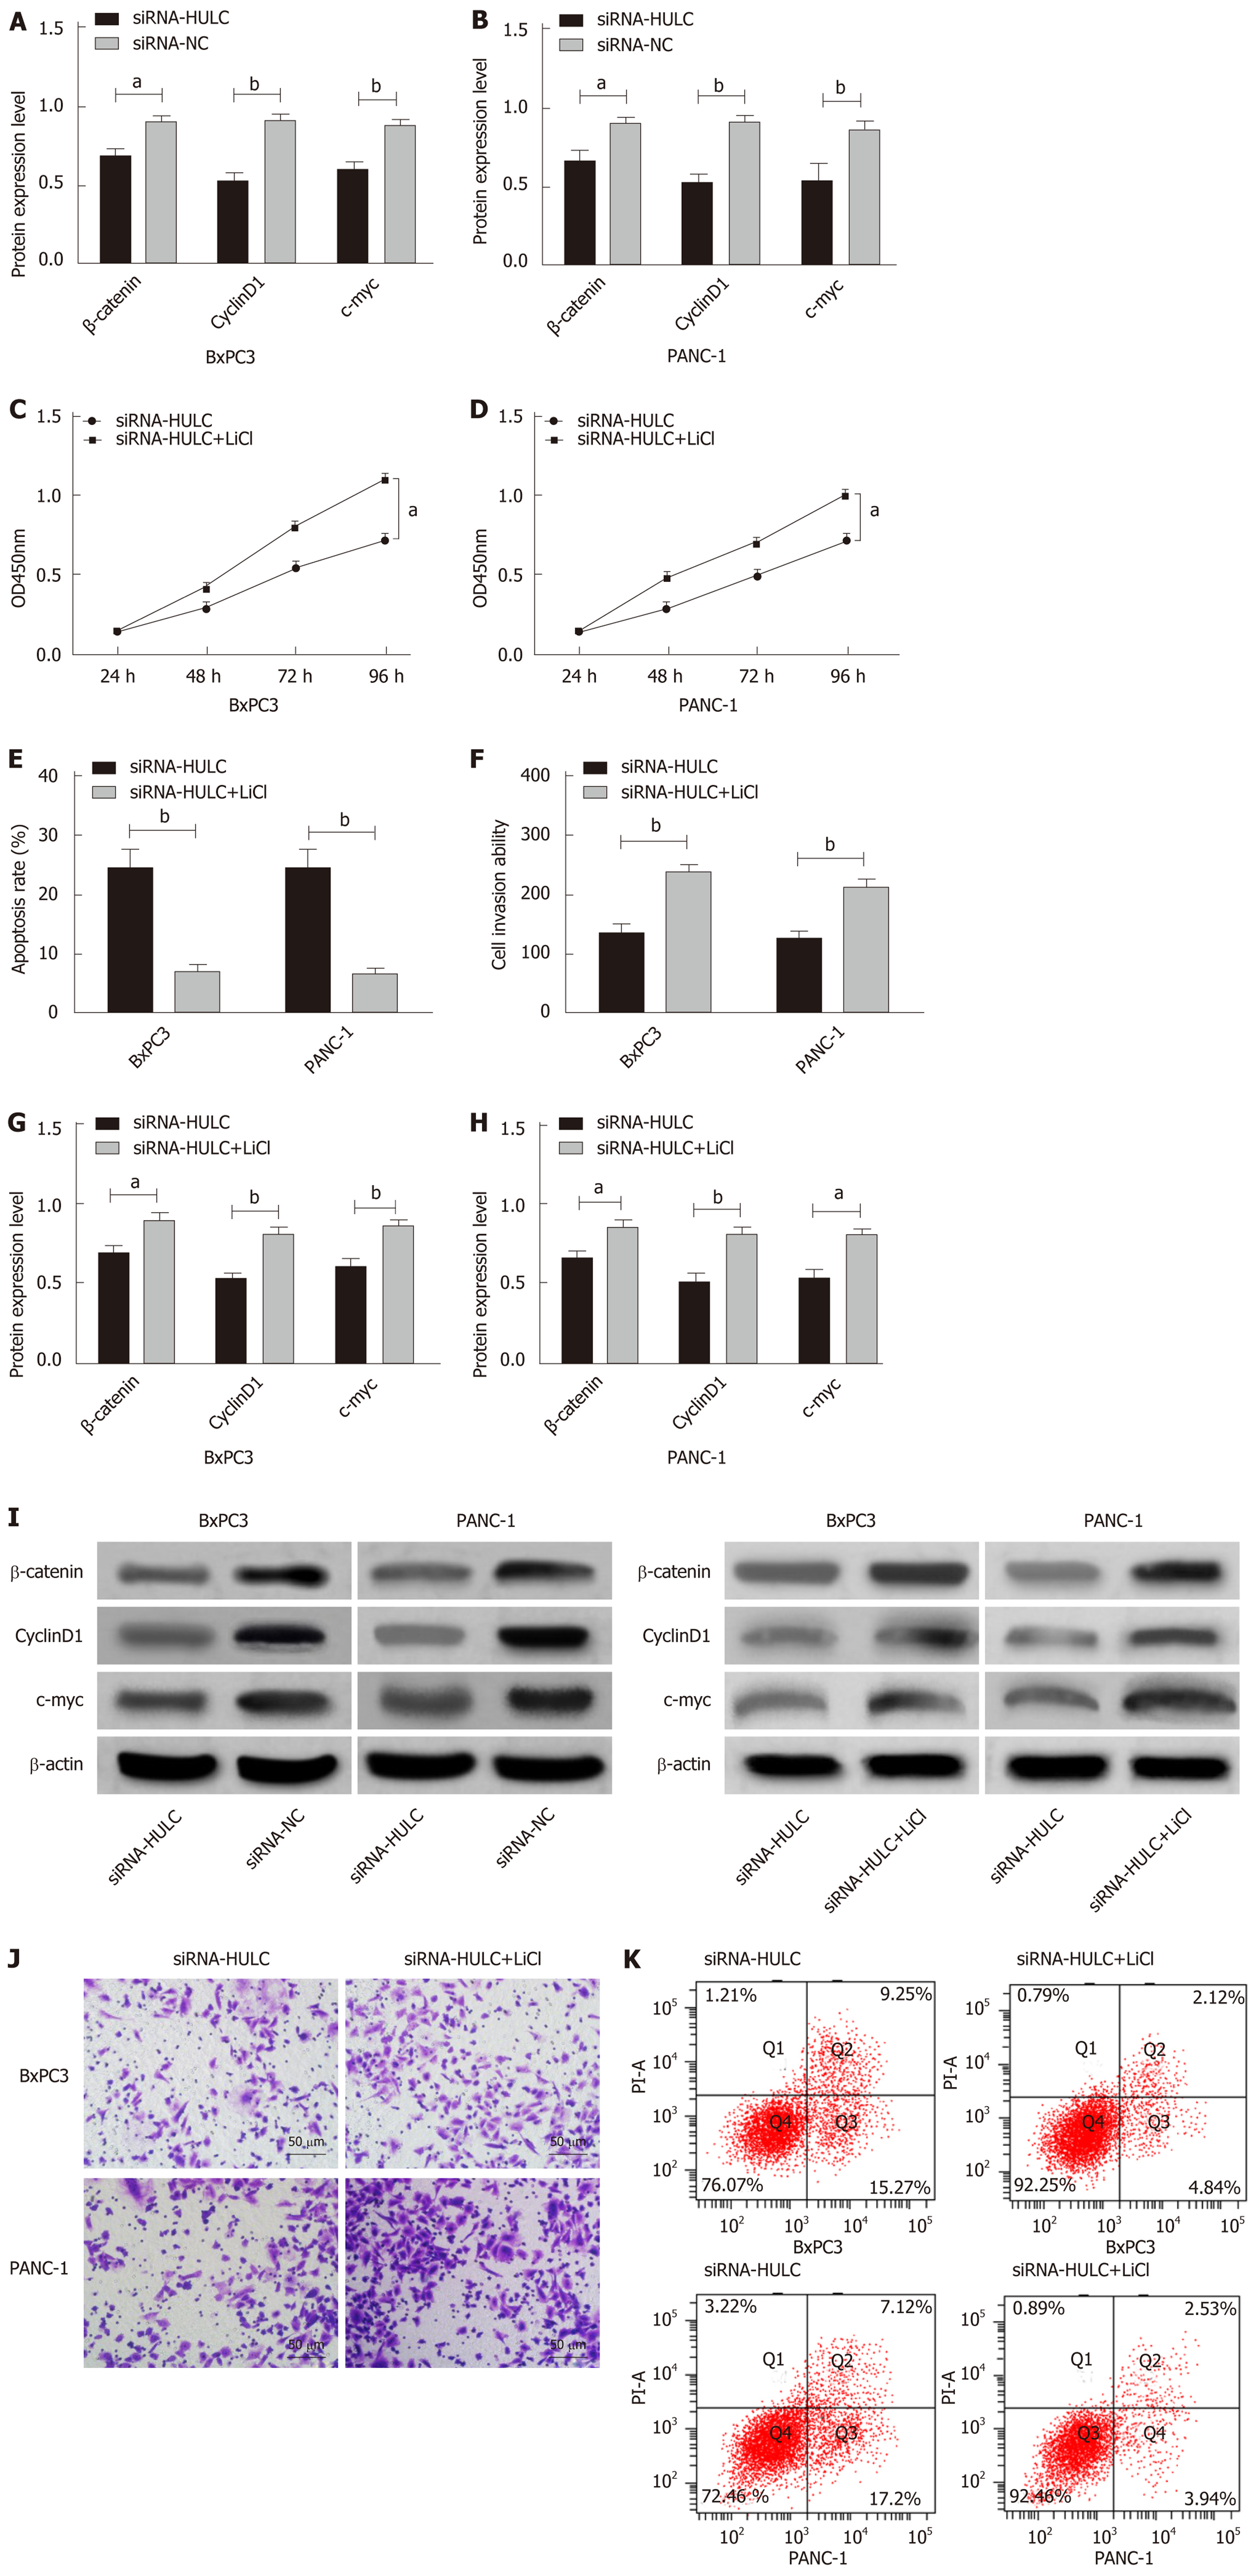
Figure 5 Effects of inhibiting the expression of HULC on the Wnt/β-catenin signaling pathway.
A: The expression of β-catenin, c-myc, and cyclin D1 proteins in BxPC3 cells after transfection; B: The expression of β-catenin, c-myc, and cyclin D1 proteins in PANC-1 cells after transfection; C: Proliferation of BxPC3 cells with HULC expression inhibited by LiCl; D: Proliferation of PANC-1 cells with HULC expression inhibited by LiCl; E: Apoptosis of BxPC3 and PANC-1 cells with HULC expression inhibited by LiCl; F: Invasion of BxPC3 and PANC-1 cells with HULC expression inhibited by LiCl; G: The expression of β-catenin, c-myc, and cyclin D1 proteins in BxPC3 cells with HULC expression inhibited by LiCl; H: The expression of β-catenin, c-myc, and cyclin D1 proteins in PANC-1 cells with HULC expression inhibited by LiCl; I: Protein band; J: Cell invasion; K: Cell apoptosis. aP < 0.05, bP < 0.01 for between-group comparisons.
- Citation: Ou ZL, Luo Z, Lu YB. Long non-coding RNA HULC as a diagnostic and prognostic marker of pancreatic cancer. World J Gastroenterol 2019; 25(46): 6728-6742
- URL: https://www.wjgnet.com/1007-9327/full/v25/i46/6728.htm
- DOI: https://dx.doi.org/10.3748/wjg.v25.i46.6728


