Copyright
©The Author(s) 2019.
World J Gastroenterol. Nov 21, 2019; 25(43): 6465-6482
Published online Nov 21, 2019. doi: 10.3748/wjg.v25.i43.6465
Published online Nov 21, 2019. doi: 10.3748/wjg.v25.i43.6465
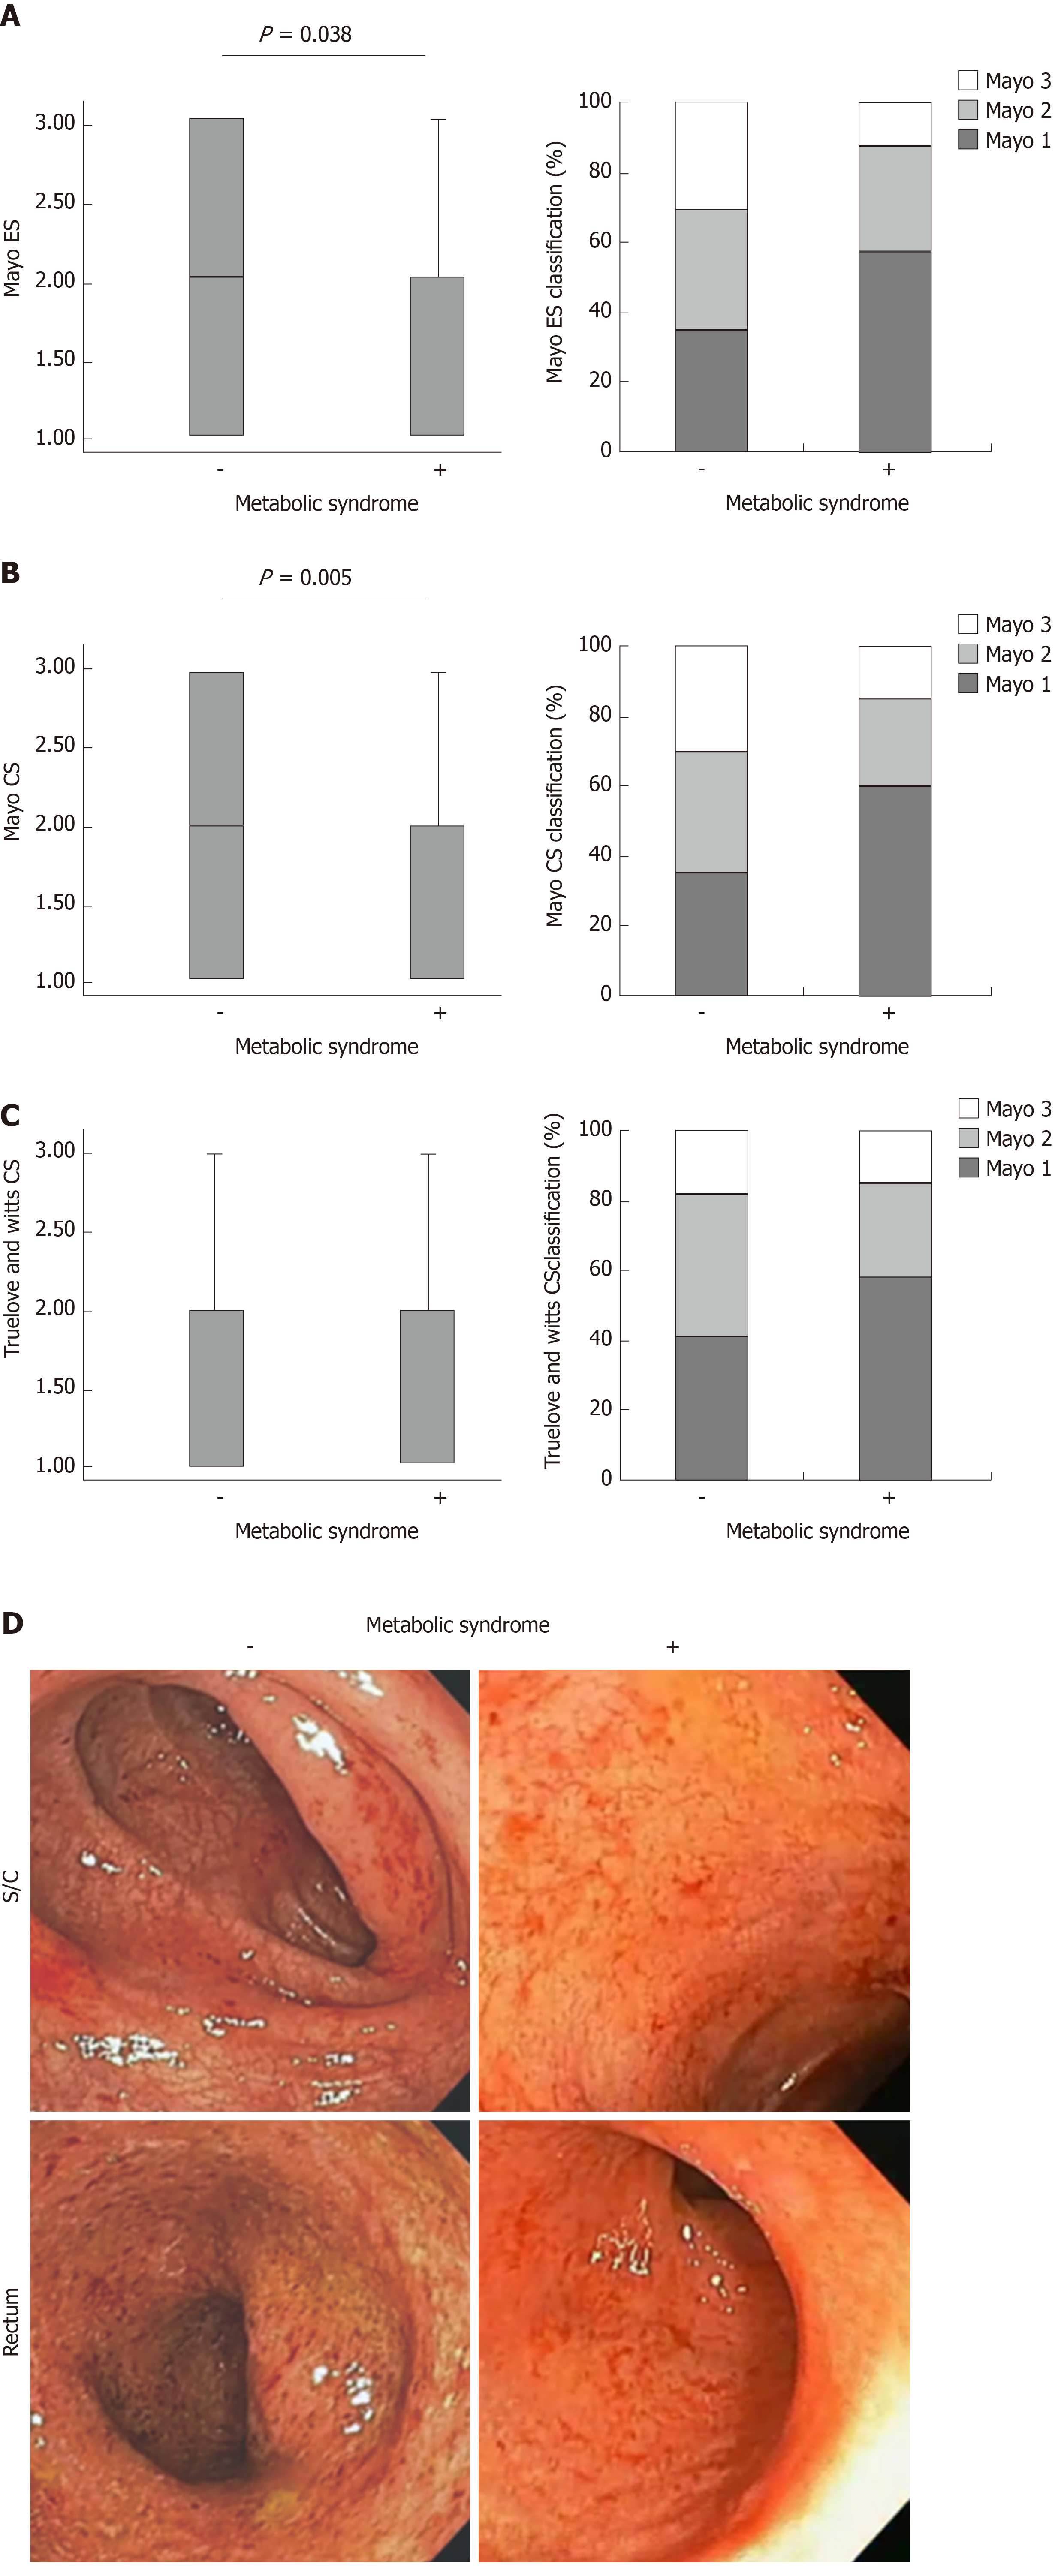
Figure 1 Clinical feature of ulcerative colitis in patients with metabolic syndrome.
A: Comparison of Mayo endoscopic subscore between ulcerative colitis (UC) patients without and with metabolic syndrome (MetS) was performed by the Chi-squared test or Kruskal-Wallis test and P values are presented above the box plots. B: Mayo clinical scores (CS) between UC patients without and with MetS was performed by the Chi-squared test or Kruskal-Wallis test and P values are presented above the box plots. C: Truelove and Witts CS between UC patients without and with MetS was performed by the Chi-squared test or Kruskal-Wallis test and P values are presented above the box plots. D: Representative images was presented. ES: Sndoscopic subscore; CS: Clinical scores.
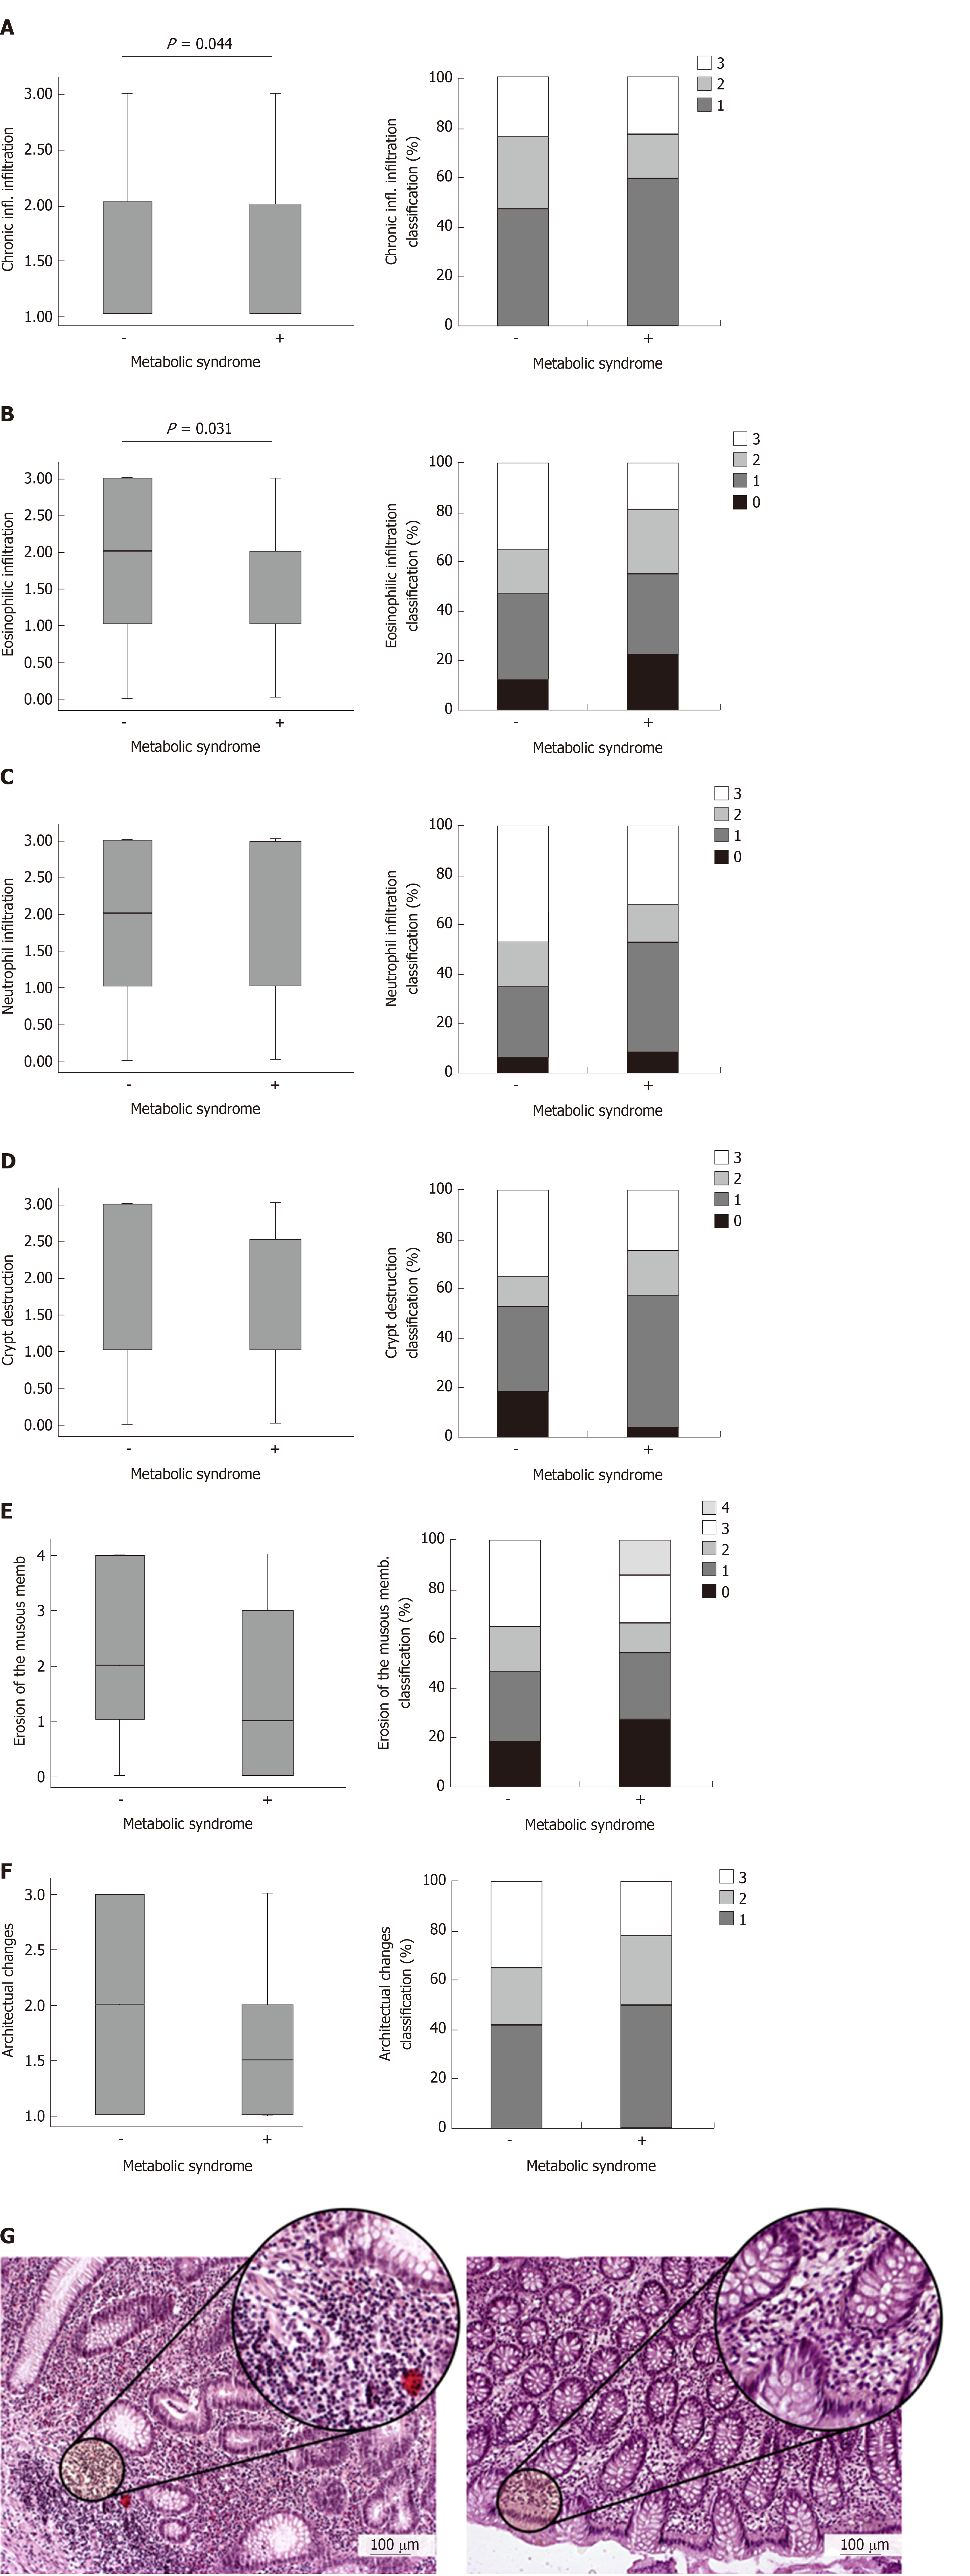
Figure 2 Pathohistological parameters of ulcerative colitis in patients with metabolic syndrome.
A-G: Histological score was analyzed for chronic inflammatory infiltration, eosinophilic infiltration, neutrophilic infiltration, crypt destruction, erosion of the mucous membranes and architectural changes. Ulcerative colitis patients without metabolic syndrome (MetS) confirmed the presence of chronic inflammatory infiltration and eosinophilic infiltration in the injured colons (down left panel, 200 x). On the contrary, damage of colon tissue in patients with MetS was manifested by resolution of inflammation, less chronic inflammatory infiltration and eosinophilic infiltration in the colon (down right panel, 200 x).
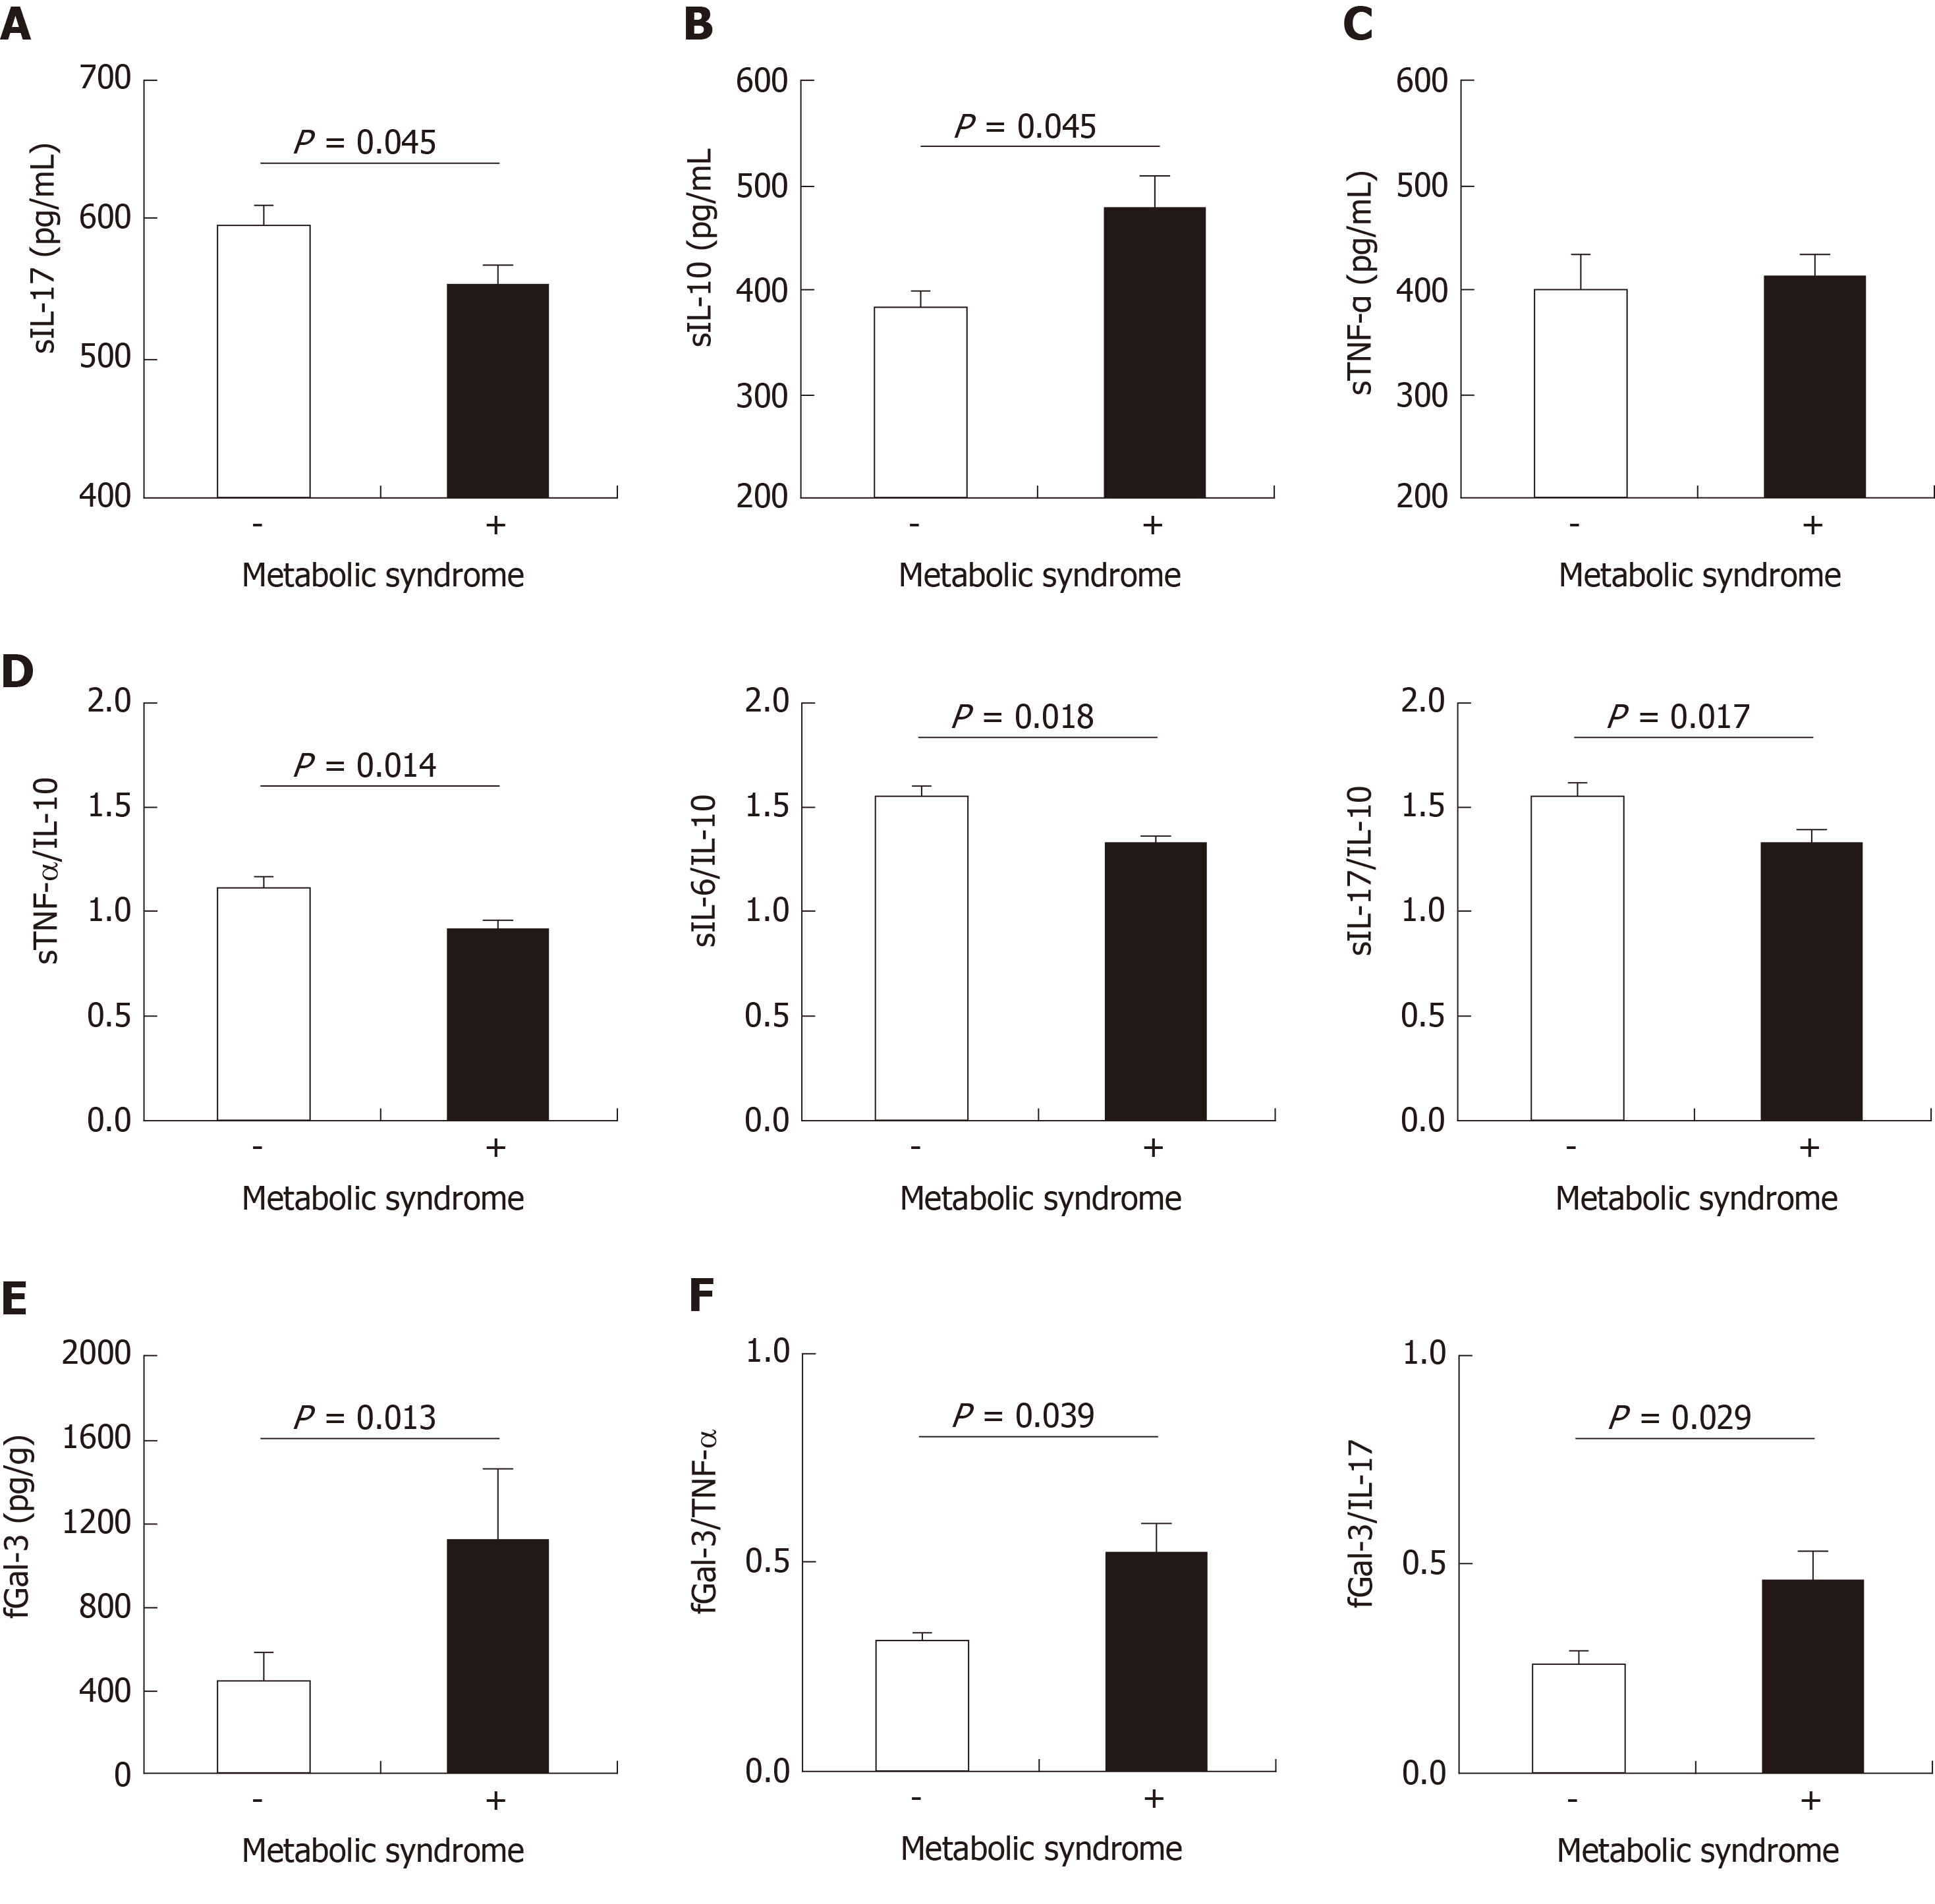
Figure 3 Systemic and local cytokine profile of ulcerative colitis patients according to metabolic syndrome.
A: Interleukin-17 (IL-17) were measured by ELISA in the sera of ulcerative colitis (UC) patients without and with metabolic syndrome (MetS). B: Interleukin-10 (IL-10) were measured by ELISA in the sera of UC patients without and with MetS. C: Tumor necrosis factor α (TNF-α) were measured by ELISA in the sera of UC patients without and with MetS. D: sTNF-α/IL-10, sIL-6/IL-10 and sIL-17/IL-10 ratios were evaluated for each patient, separately. E: Concentration of fecal Galectin-3 (Gal-3) was determined in UC patients without and with MetS. F: Ratio of fGal-3/TNF-α and fGal-3/IL-17 in UC patients according to MetS was evaluated for each patient, separately. Patients with UC were divided into two groups: without and with metabolic syndrome (negative "-" or positive "+"). The Student’s t or Mann-Whitney U test was applied as appropriate to evaluate statistical significant differences. TNF-α: Tumor necrosis factor α; IL-17: Interleukin-17; IL-10: Interleukin-10; Gal-3: Galectin-3.
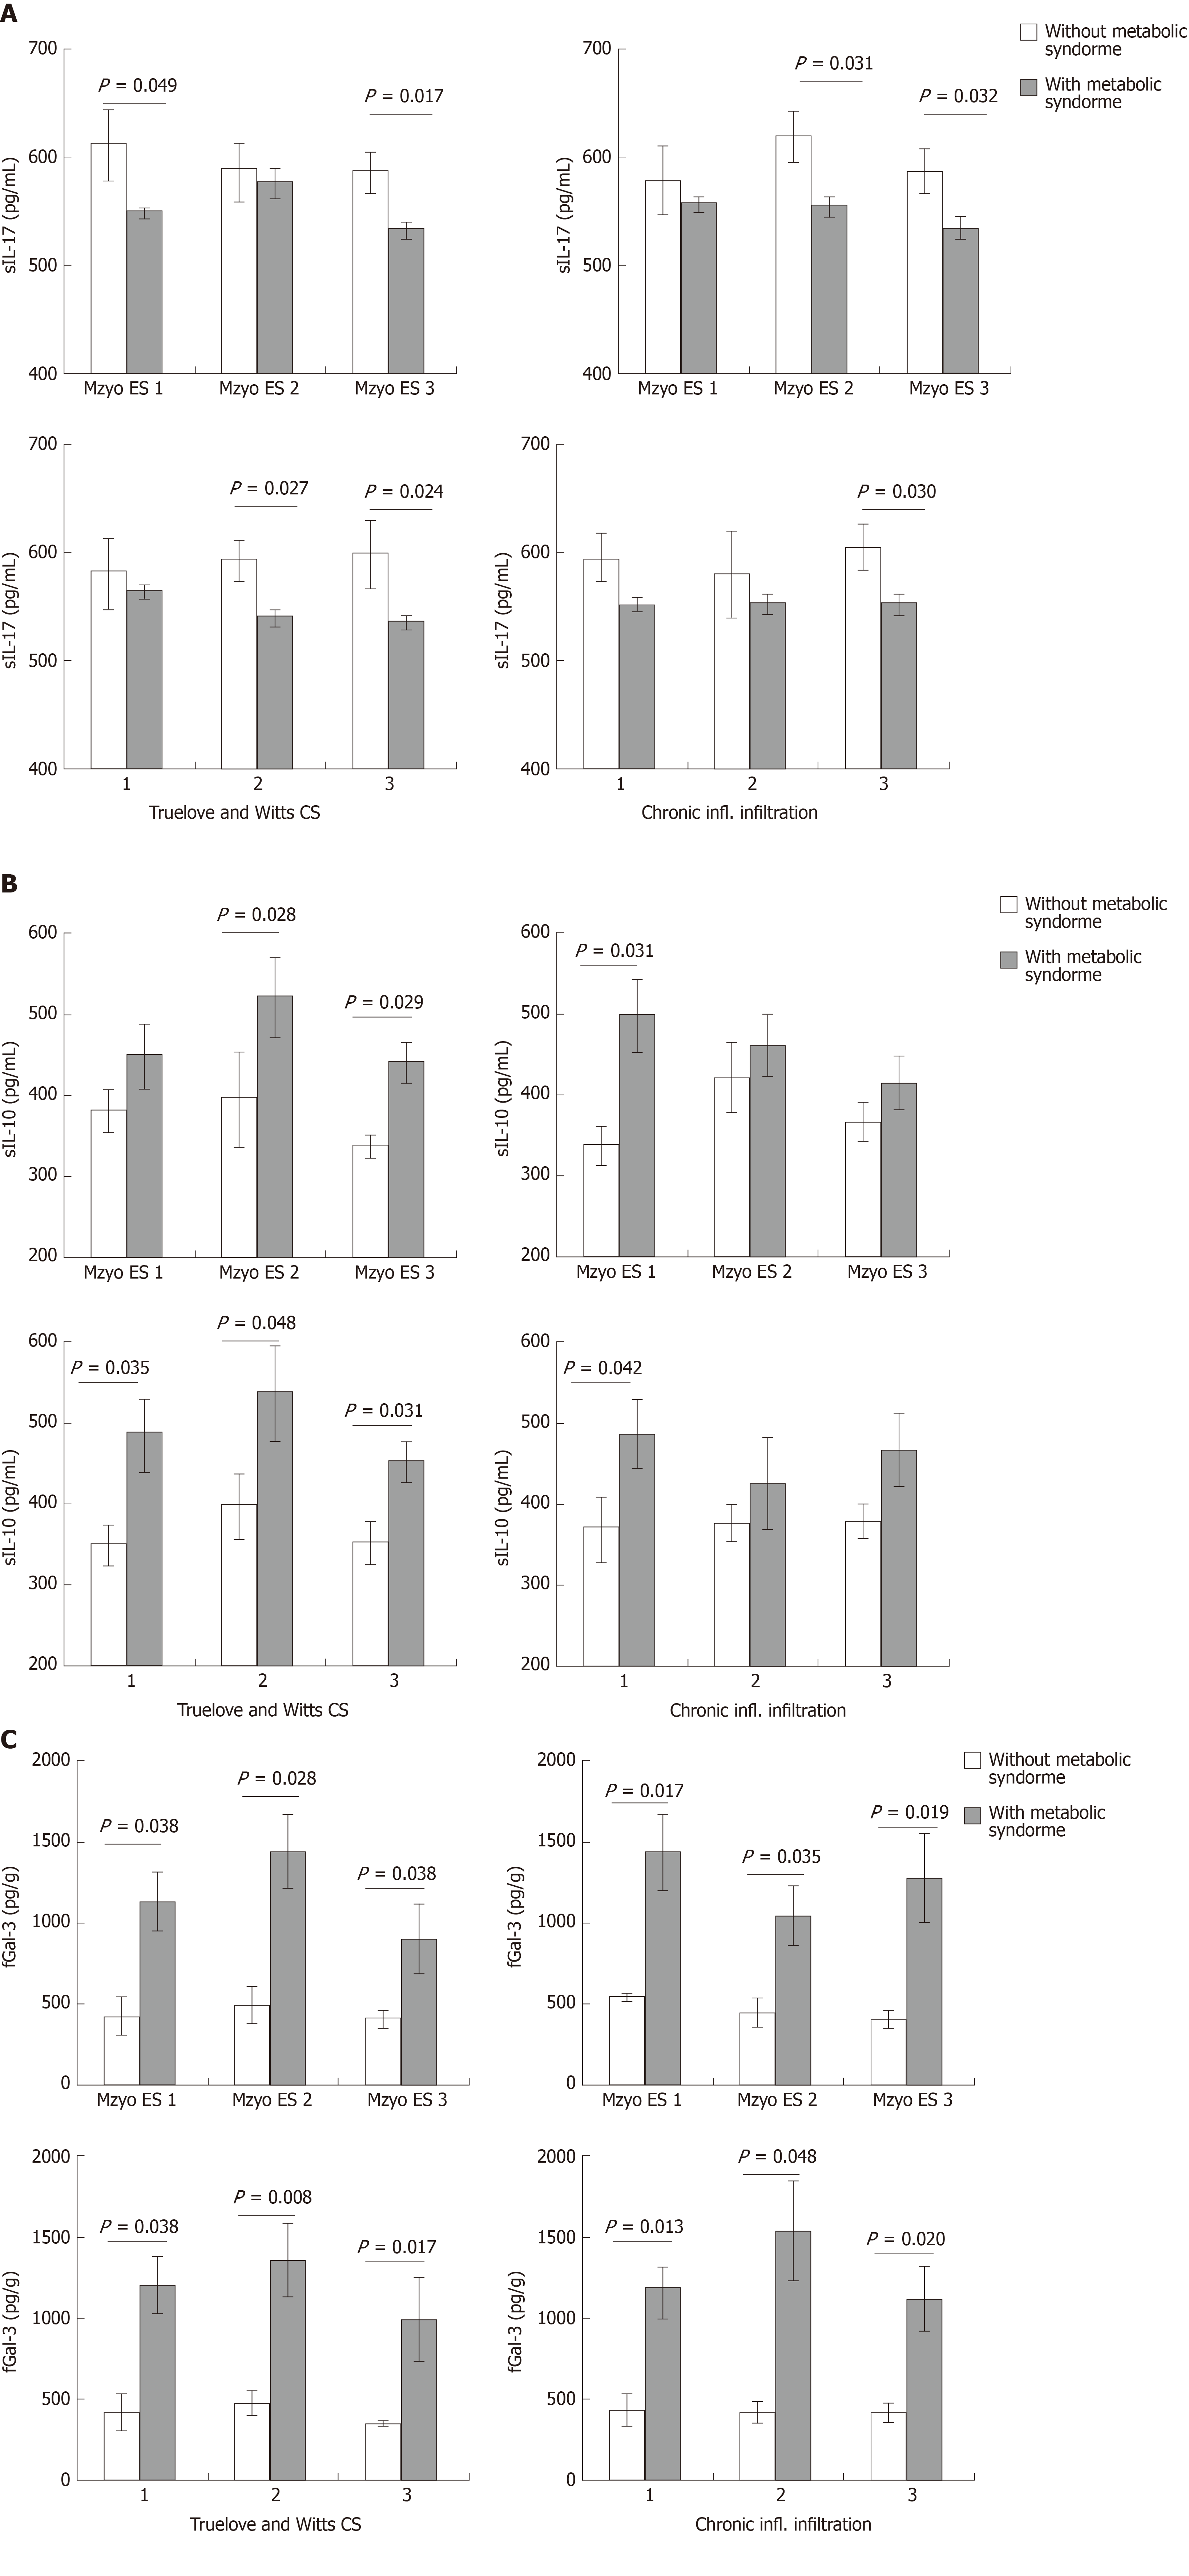
Figure 4 Systemic and local cytokine profile of patients with especially same clinical, endoscopic and histopathological stage of ulcerative colitis, according to metabolic syndrome.
Patients with ulcerative colitis (UC) were divided into groups according to clinical, endoscopic and histopathological stage of UC, respectively. A: Interleukin-17 were measured by ELISA in the sera of UC patients without and with metabolic syndrome (MetS). B: Interleukin-10 were measured by ELISA in the sera of UC patients without and with MetS. C: Galectin-3 were measured by ELISA in the sera of UC patients without and with MetS. The Student’s t or Mann-Whitney U test was applied as appropriate to evaluate statistical significant differences. IL-17: Interleukin-17; IL-10: Interleukin-10; Gal-3: Galectin-3.
Figure 5 Functional phenotype of immune cells in colonic mucosa.
A: The graph and representative FACS plots displaying the percentage of CD8+ T cells derived from colonic mucosa of ulcerative colitis (UC) patients without and with metabolic syndrome (MetS). B: The graph and representative FACS plots displaying the percentage of T regulatory cells (CD4+Fox3+) derived from colonic mucosa of UC patients without and with MetS. C: The graph and representative FACS plots displaying the percentage of Galectin-3+ (Gal-3+) NKT (CD3+CD56+) cells derived from colonic mucosa of UC patients without and with MetS. D: The graph and representative FACS plots displaying the percentage of CD8+Foxp3+ cells derived from colonic mucosa of UC patients without and with MetS. E and F: The graph and representative FACS plots displaying the percentage of Interleukin-10 producing CD56+ and CD4+ cells derived from colonic mucosa of UC patients without and with MetS. Cellular make up of colon-infiltrating immune cells were examined by flow cytometry. The Student’s t or Mann-Whitney U test was applied to evaluate statistical significant differences among the two groups. IL-10: Interleukin-10; Gal-3: Galectin-3.
- Citation: Jovanovic M, Simovic Markovic B, Gajovic N, Jurisevic M, Djukic A, Jovanovic I, Arsenijevic N, Lukic A, Zdravkovic N. Metabolic syndrome attenuates ulcerative colitis: Correlation with interleukin-10 and galectin-3 expression. World J Gastroenterol 2019; 25(43): 6465-6482
- URL: https://www.wjgnet.com/1007-9327/full/v25/i43/6465.htm
- DOI: https://dx.doi.org/10.3748/wjg.v25.i43.6465


