Copyright
©The Author(s) 2019.
World J Gastroenterol. Oct 28, 2019; 25(40): 6129-6144
Published online Oct 28, 2019. doi: 10.3748/wjg.v25.i40.6129
Published online Oct 28, 2019. doi: 10.3748/wjg.v25.i40.6129
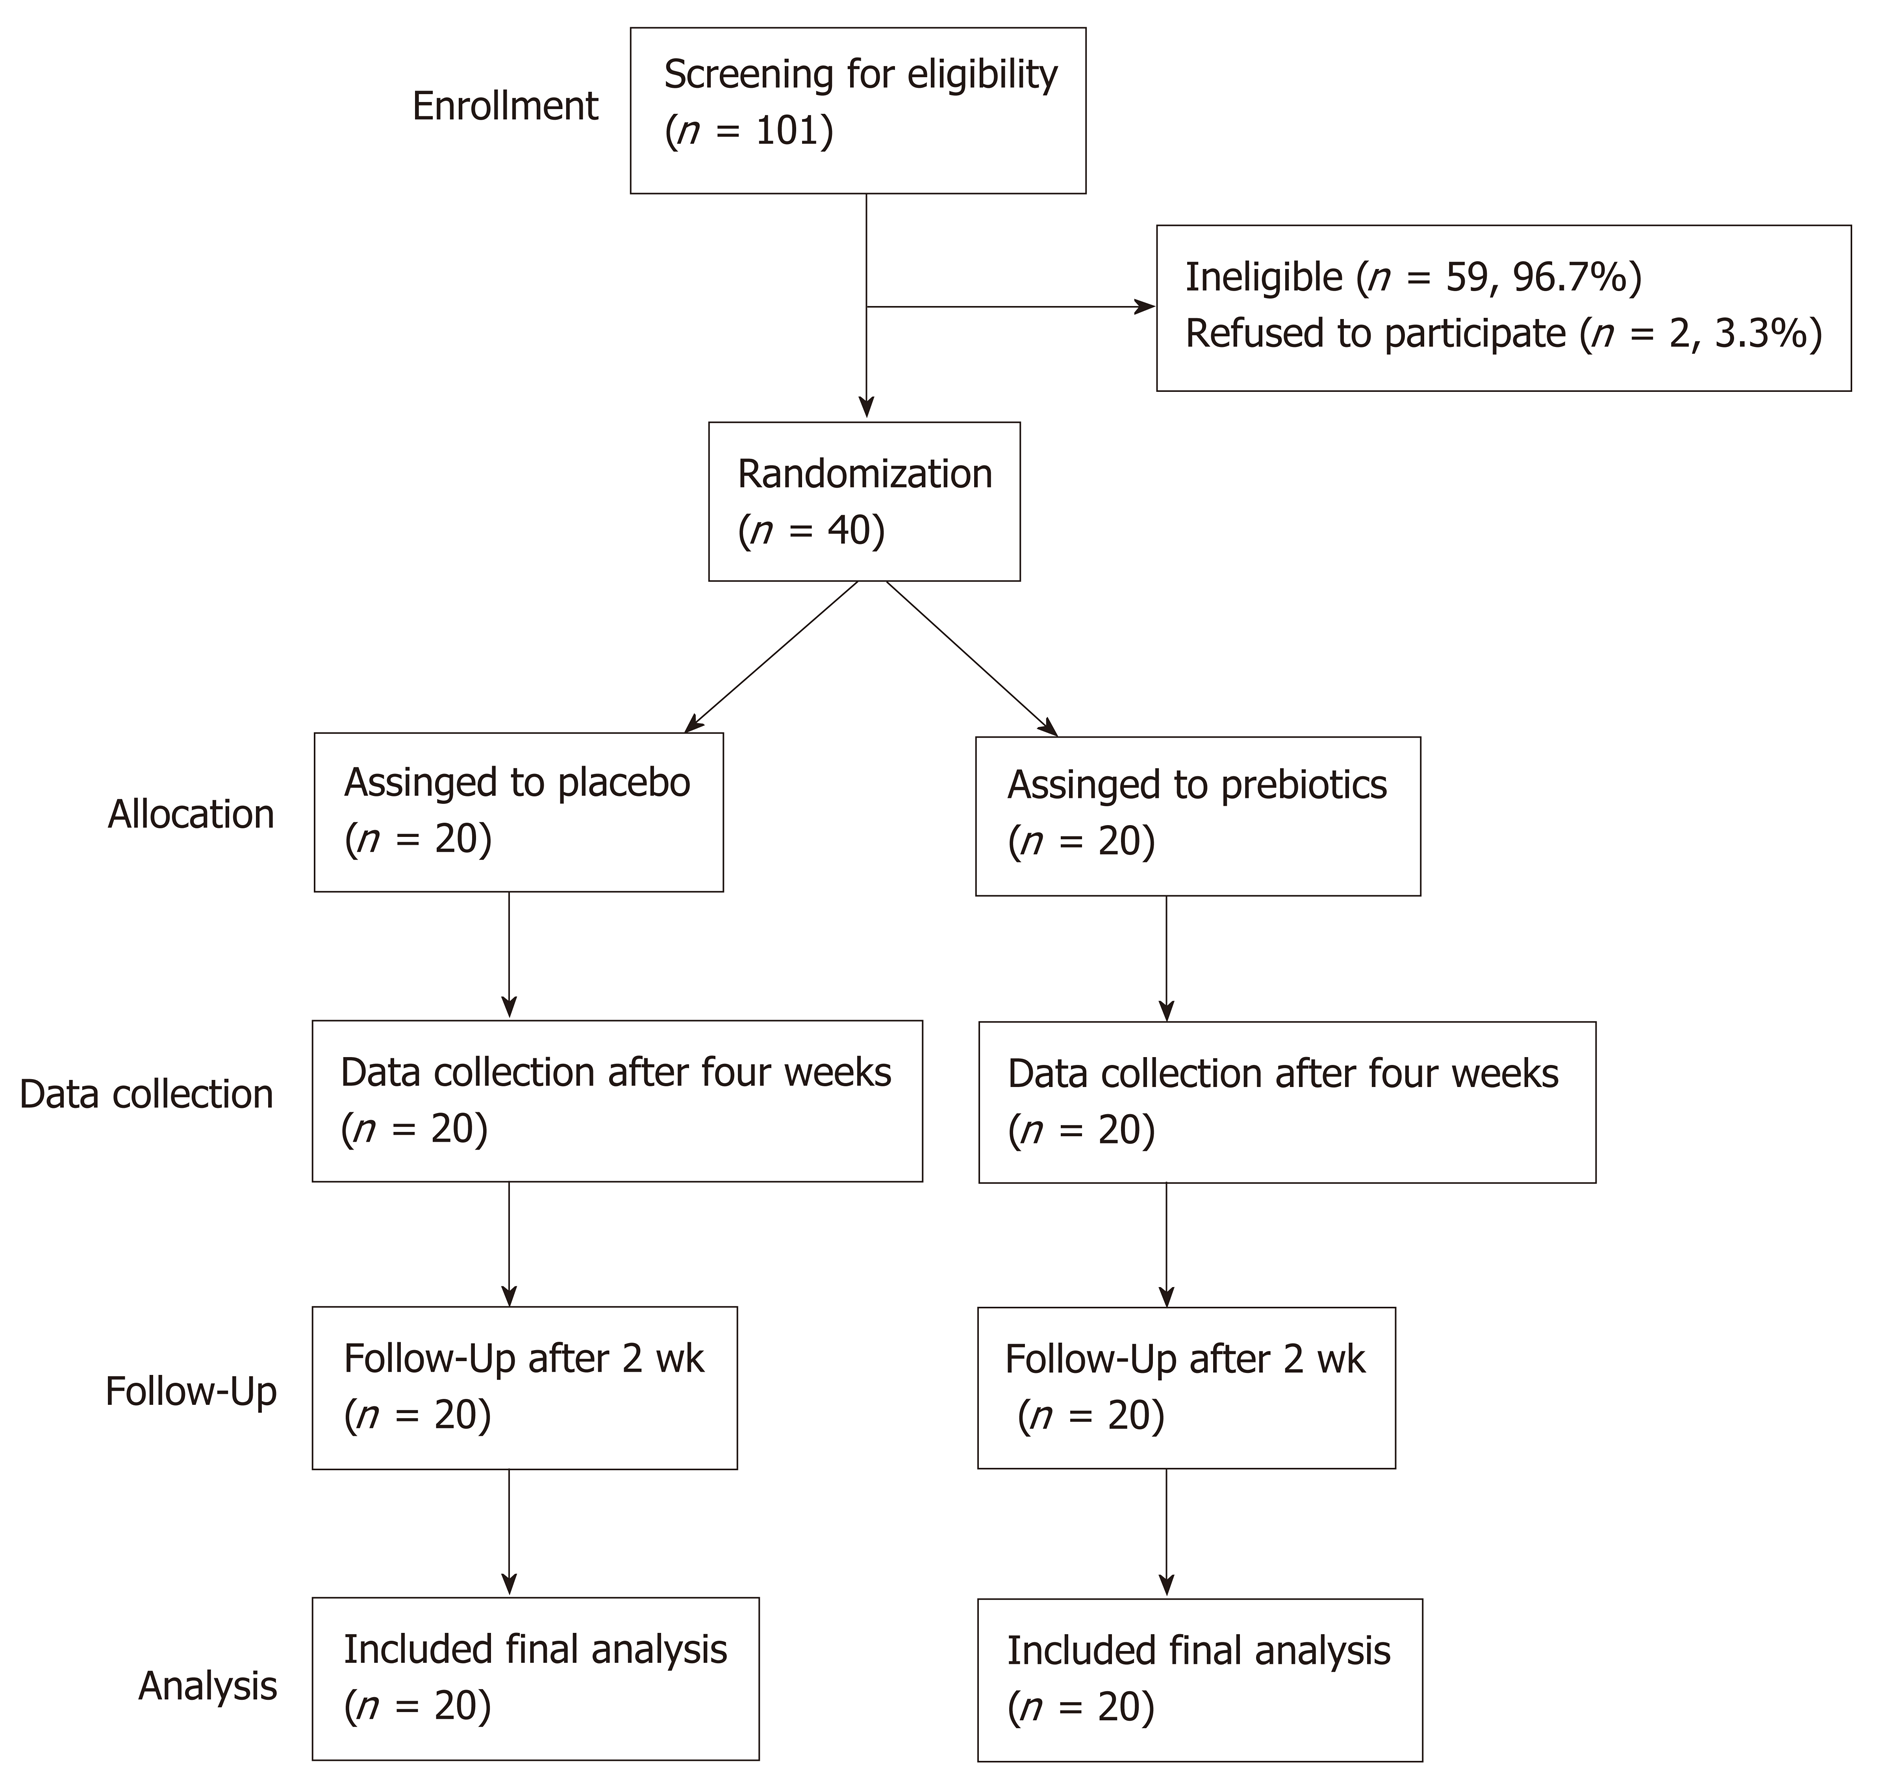
Figure 1 CONSORT diagram illustrating participant recruitment, follow-up, and analysis.
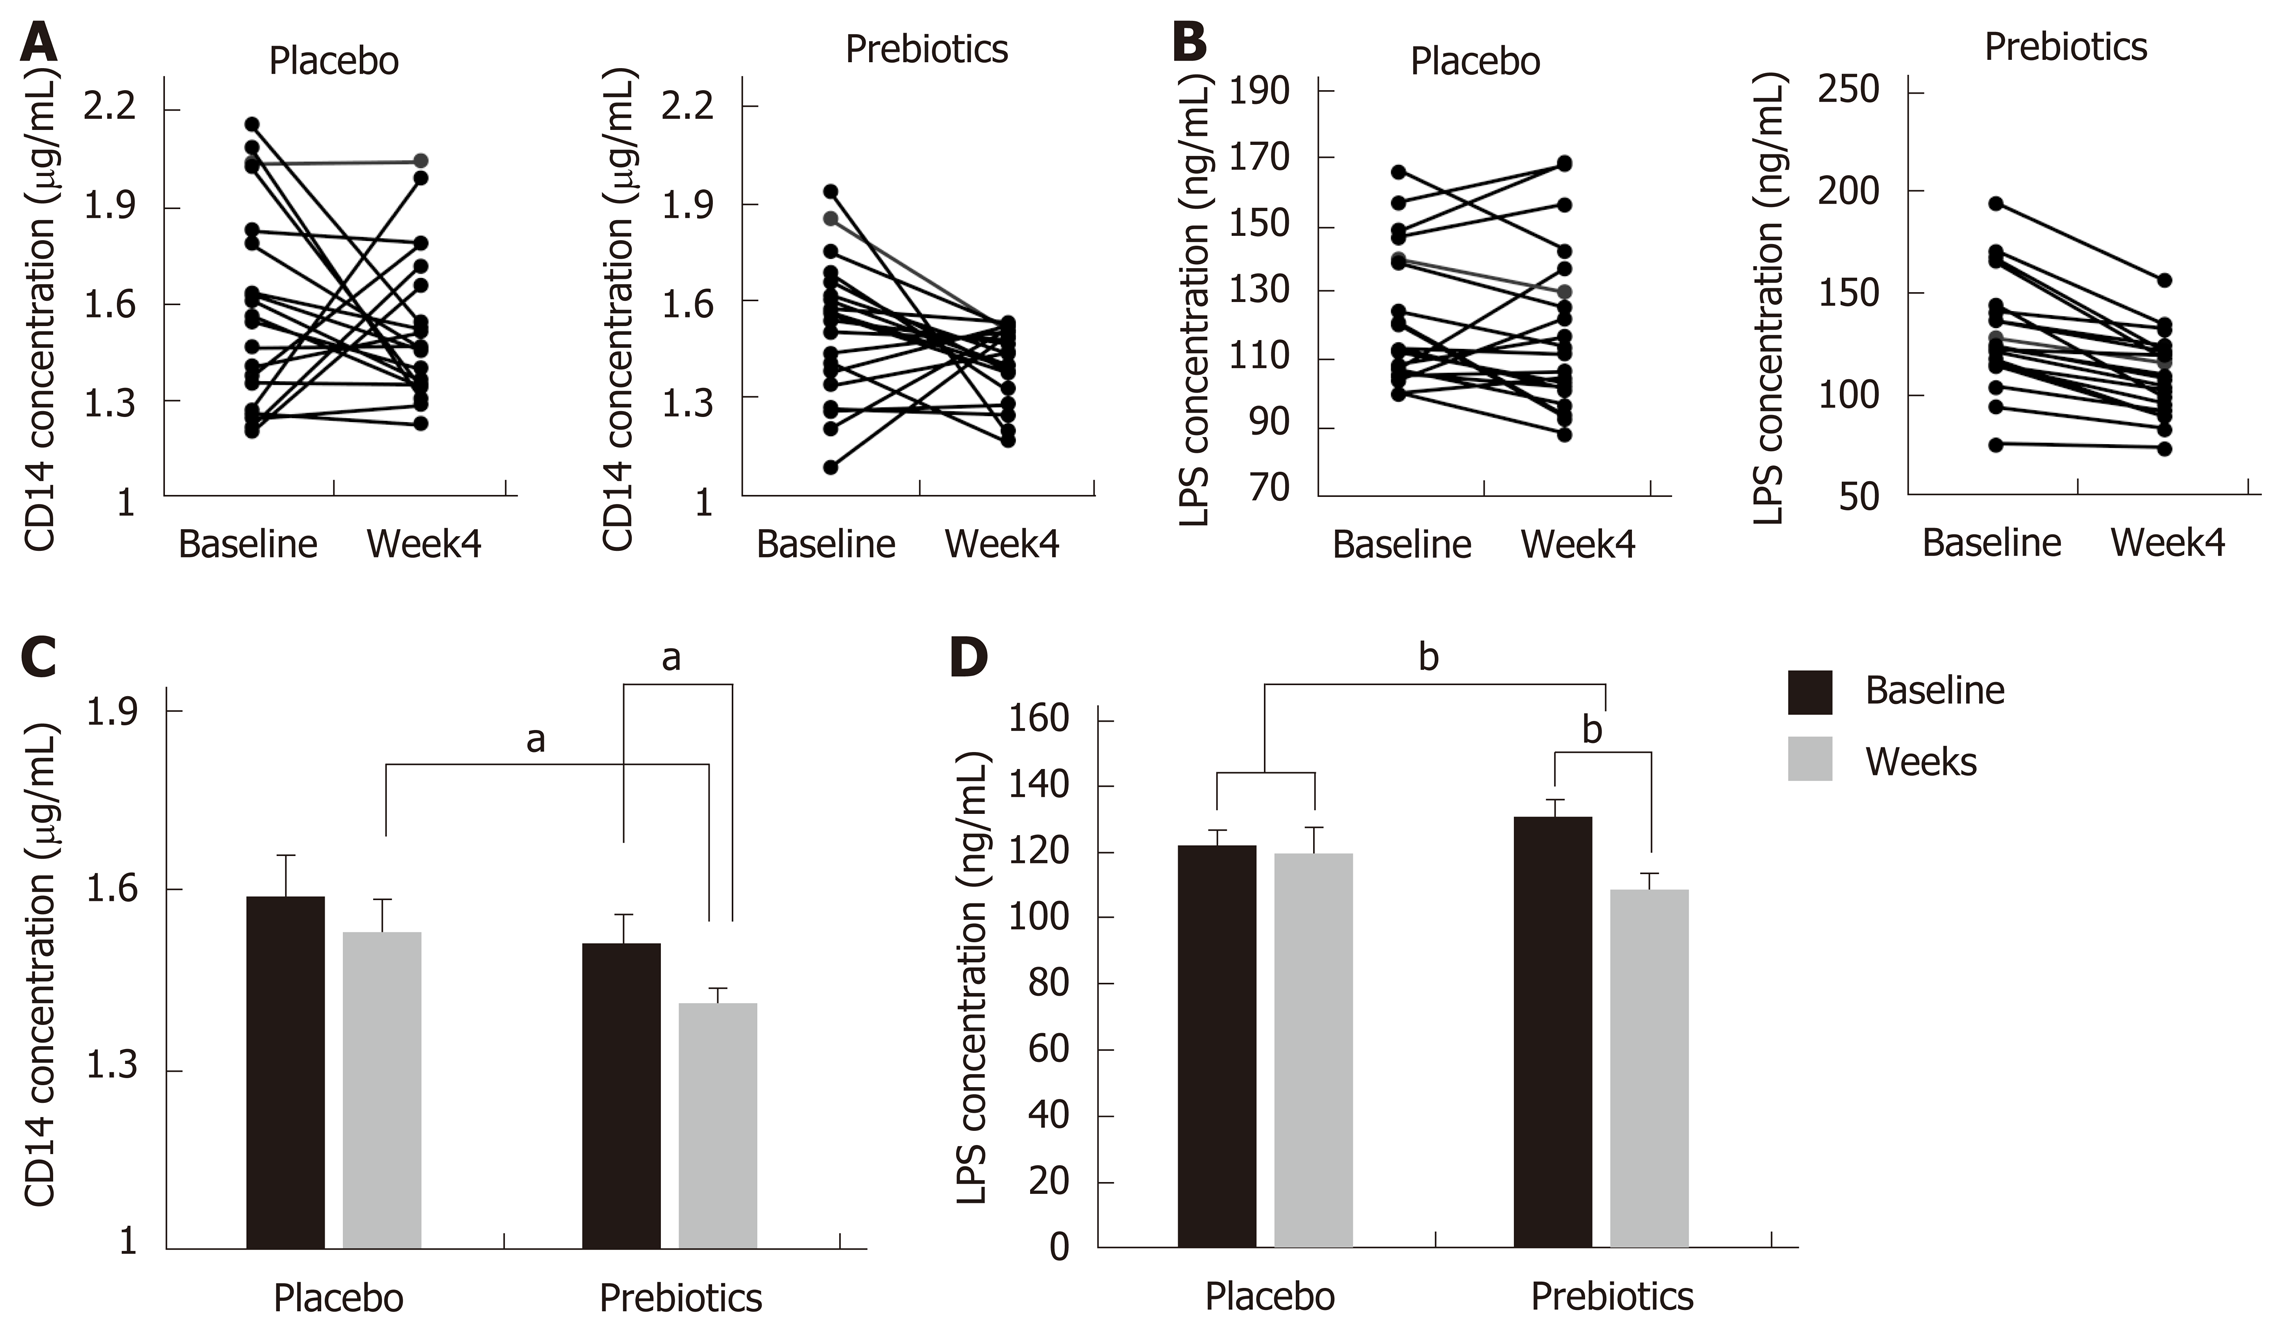
Figure 2 Changes in the serum cluster of differentiation 14 and lipopolysaccharide concentrations after 4 wk of intervention.
A and C: Changes in the serum cluster of differentiation (CD) 14 after 4 wk of intervention; B and D: Changes in the serum cluster of lipopolysaccharide (LPS) concentrations after 4 wk of intervention. After 4 wk of intervention, the concentrations of serum CD 14 and LPS were significantly reduced in the prebiotics group. Bar charts show the mean ± standard error of the mean. aP < 0.05; bP < 0.001. Significantly different from the values at placebo or baseline, using the Student’s t-test or paired t-test. CD: Cluster of differentiation; LPS: Lipopolysaccharide.
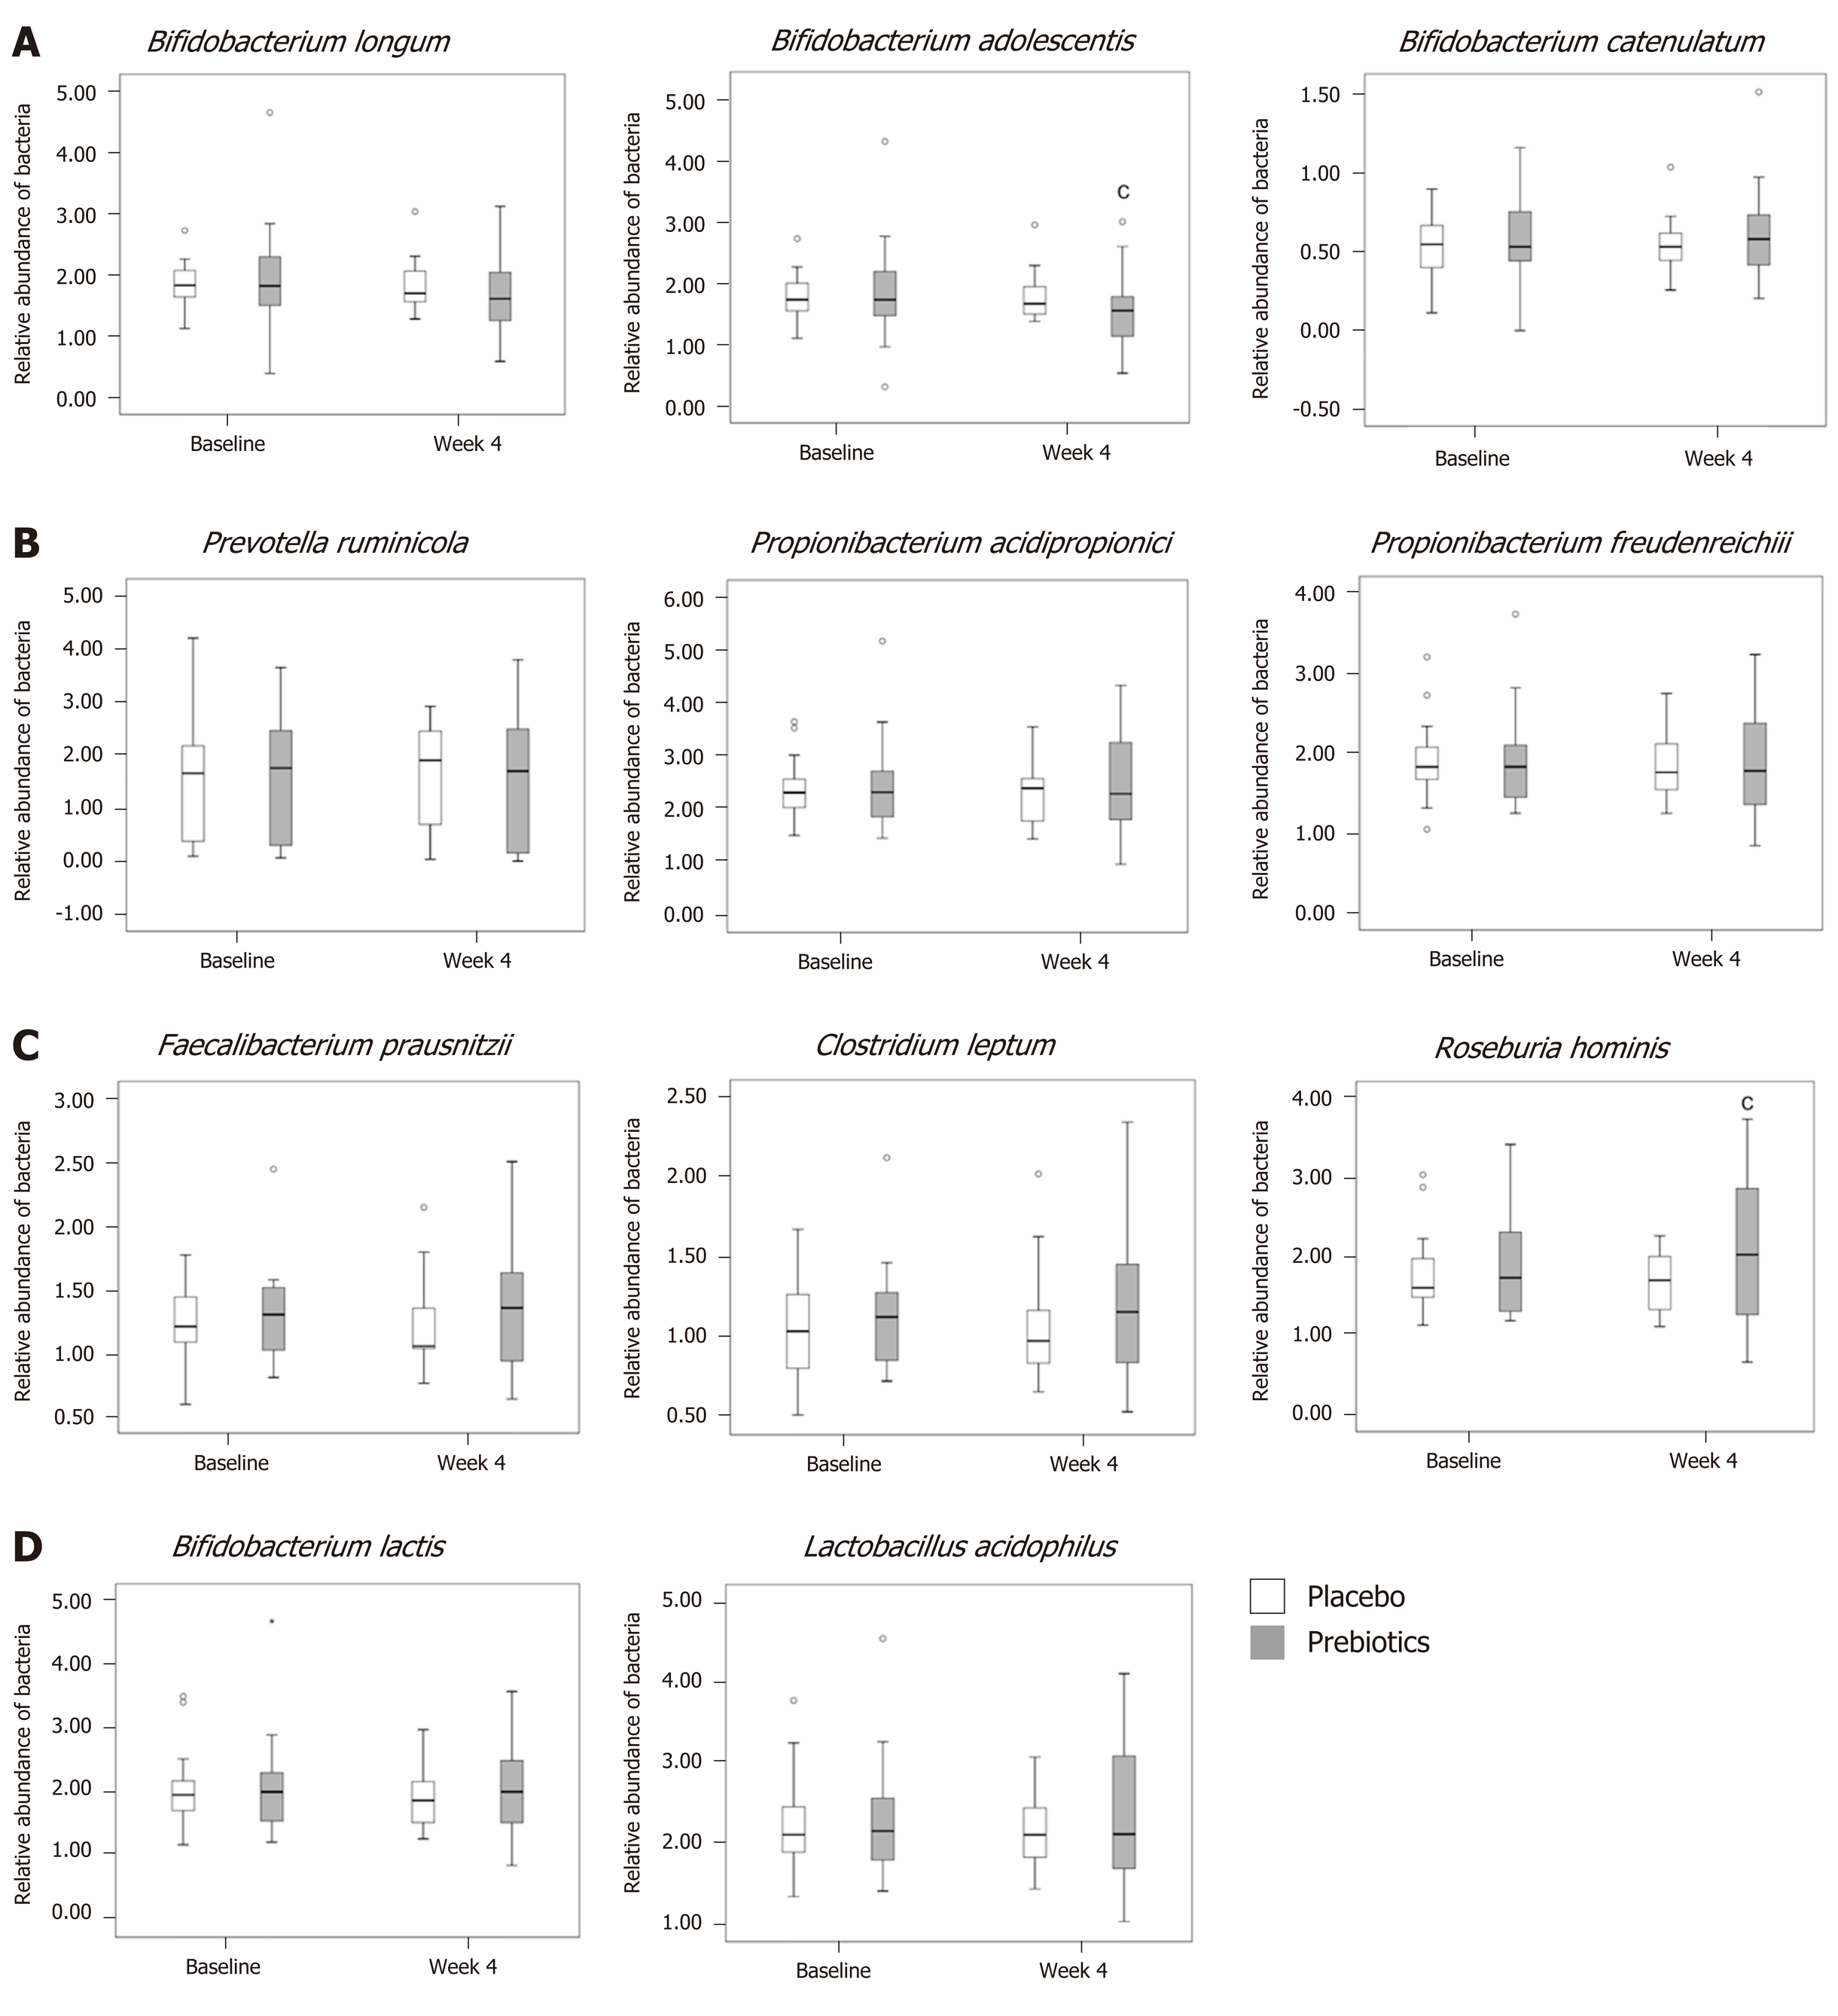
Figure 3 Analysis of Relative abundance.
A: Relative abundance of acetate-producing bacteria; B: Propionate-producing bacteria; C: Butyrate-producing bacteria; D: Prebiotic-sensitive bacteria. In the prebiotics group, the relative abundance of Bifidobacterium adolescentis was decreased and that of Roseburia hominis was increased after 4 wk of intervention. Box plots show the 25th and 75th percentiles, median, and range. Outliers are expressed as a small circle. cP < 0.05. Significantly different from the values at baseline, using the Student’s t-test.
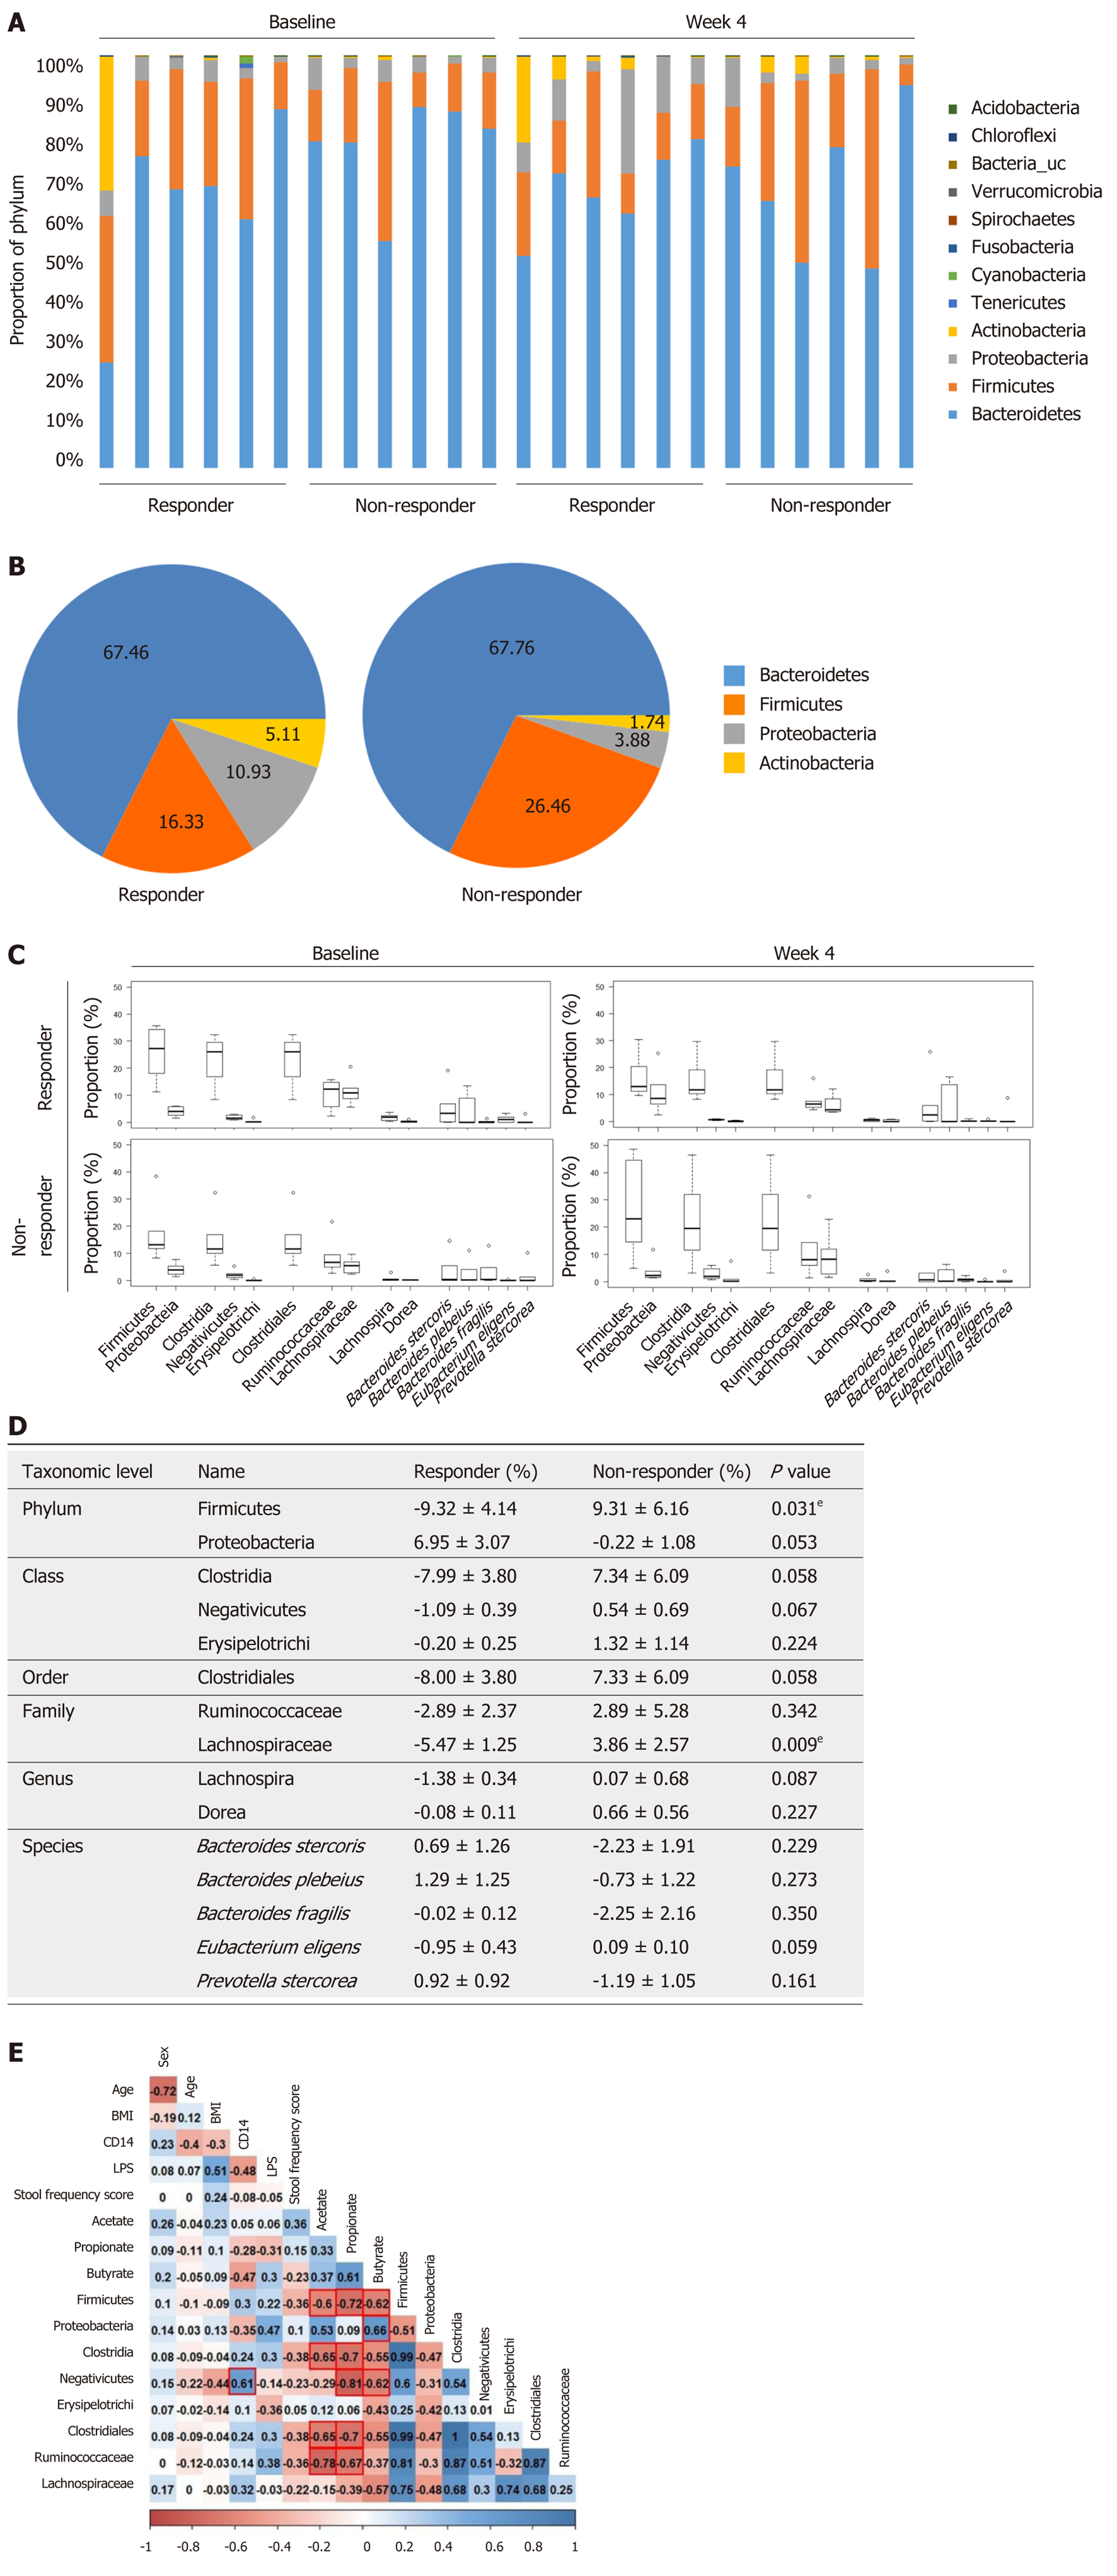
Figure 4 Microbial community analysis between responders and non-responders treated with prebiotics.
A: Gut microbiome phylum profile of the responder and non-responder groups at baseline and week 4; B: Major microbiome phylum profile at week 4; C and D: Changes in the relative abundance of subordinate taxa (from baseline to week 4); E: Correlations of gut microbiota with serum endotoxemia markers and fecal short chain fatty acids. The abundances of the phylum Firmicutes, the class Clostridia, and the order Clostridiales were reduced in the responders after 4 wk of intervention representing the inverse associations with several fecal short chain fatty acids. Box plots show the 25th and 75th percentiles, median, and range. Outliers are expressed as a small circle (C). eP < 0.05. Significantly different from the values at responders, using the Student’s t-test (D). The number in each box indicates coefficient of correlation. The blue color implies a positive correlation, while the red color indicates a negative correlation. Statistically significant correlation is highlighted with a red line (E). CD: Cluster of differentiation; LPS: Lipopolysaccharide; BMI: Body mass index.
- Citation: Chu JR, Kang SY, Kim SE, Lee SJ, Lee YC, Sung MK. Prebiotic UG1601 mitigates constipation-related events in association with gut microbiota: A randomized placebo-controlled intervention study. World J Gastroenterol 2019; 25(40): 6129-6144
- URL: https://www.wjgnet.com/1007-9327/full/v25/i40/6129.htm
- DOI: https://dx.doi.org/10.3748/wjg.v25.i40.6129


