Copyright
©The Author(s) 2019.
World J Gastroenterol. Oct 28, 2019; 25(40): 6094-6106
Published online Oct 28, 2019. doi: 10.3748/wjg.v25.i40.6094
Published online Oct 28, 2019. doi: 10.3748/wjg.v25.i40.6094
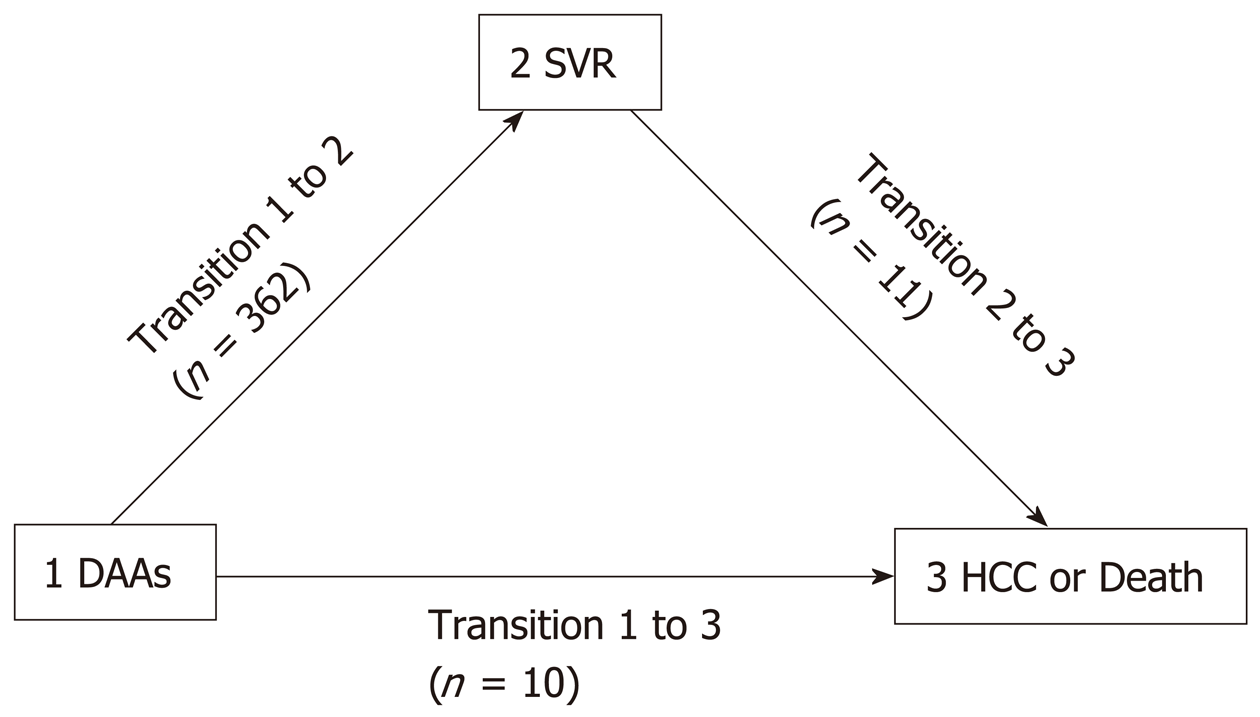
Figure 1 Multi-state transition model.
DAAs: Direct-acting antiviral agents; SVR: Sustained virologic response; HCC: Hepatocellular carcinoma.
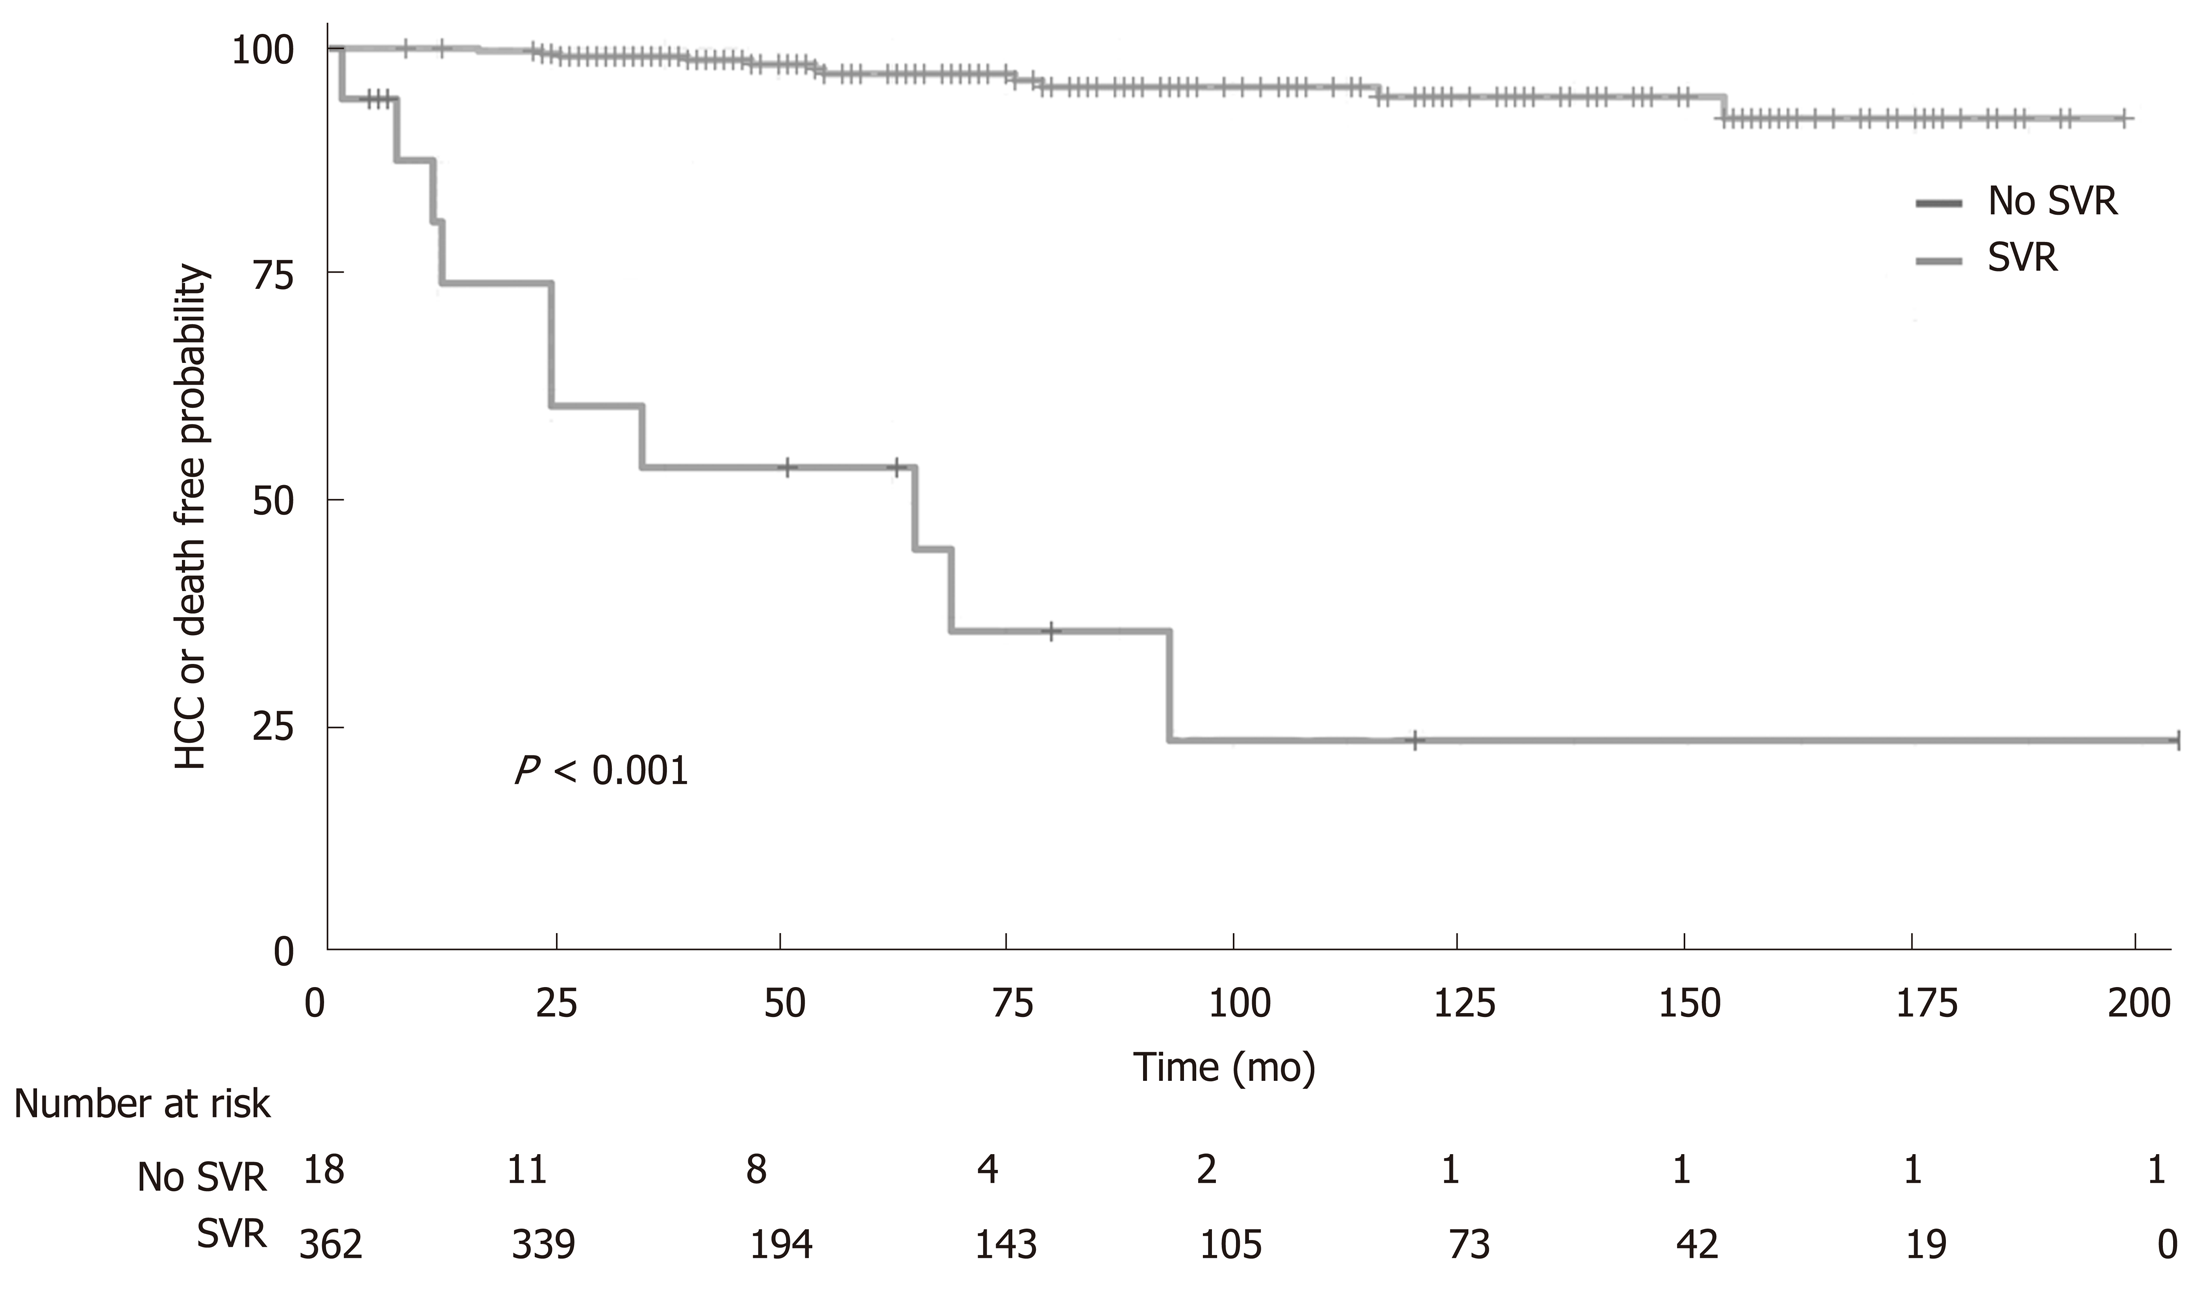
Figure 2 Kaplan-Meier curves and risk table representing survival free of hepatocellular carcinoma or death from any cause according to sustained virologic response to hepatitis C virus direct-acting antiviral agents.
Plain areas represent the 95% confidence interval. P value by the nonparametric log-rank test. SVR: Sustained virologic response; HCC: Hepatocellular carcinoma.
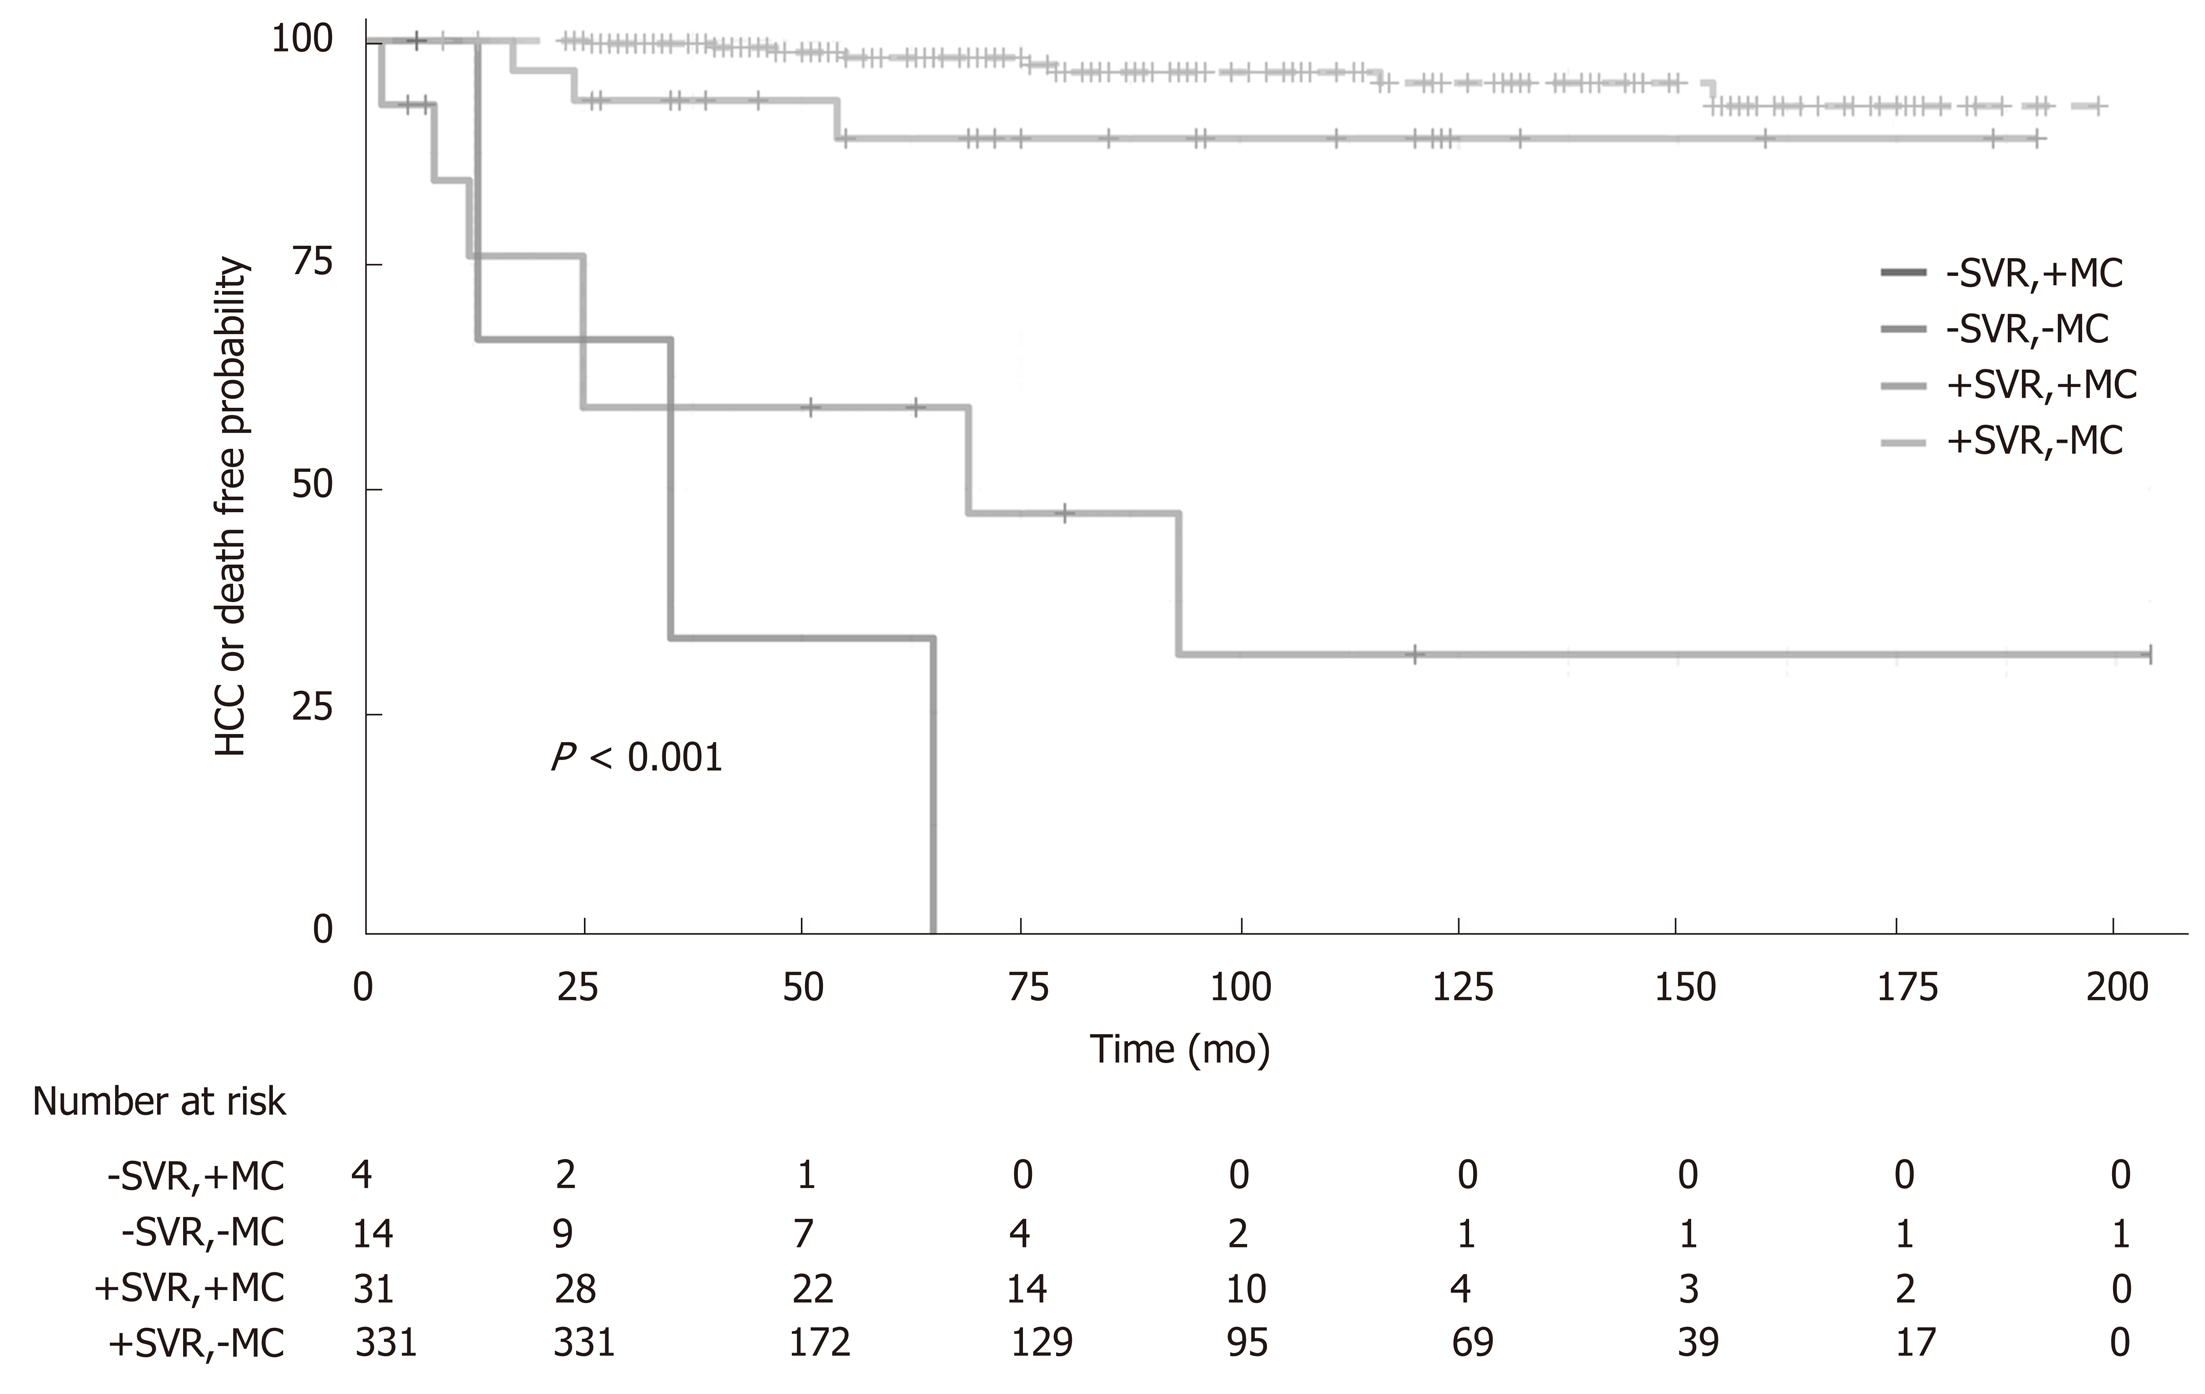
Figure 3 Kaplan-Meier curves and risk table representing survival free of hepatocellular carcinoma or death from any cause according to the presence of mixed cryoglobulinemia and sustained virologic response to hepatitis C virus direct-acting antiviral agents.
P value by nonparametric log-rank test. +: with; -: without; MC: Mixed cryoglobulinemia; SVR: Sustained virologic response; HCC: Hepatocellular carcinoma.
- Citation: Colussi G, Donnini D, Brizzi RF, Maier S, Valenti L, Catena C, Cavarape A, Sechi LA, Soardo G. Sustained virologic response to direct-acting antiviral agents predicts better outcomes in hepatitis C virus-infected patients: A retrospective study. World J Gastroenterol 2019; 25(40): 6094-6106
- URL: https://www.wjgnet.com/1007-9327/full/v25/i40/6094.htm
- DOI: https://dx.doi.org/10.3748/wjg.v25.i40.6094


