Copyright
©The Author(s) 2019.
World J Gastroenterol. Oct 28, 2019; 25(40): 6063-6076
Published online Oct 28, 2019. doi: 10.3748/wjg.v25.i40.6063
Published online Oct 28, 2019. doi: 10.3748/wjg.v25.i40.6063
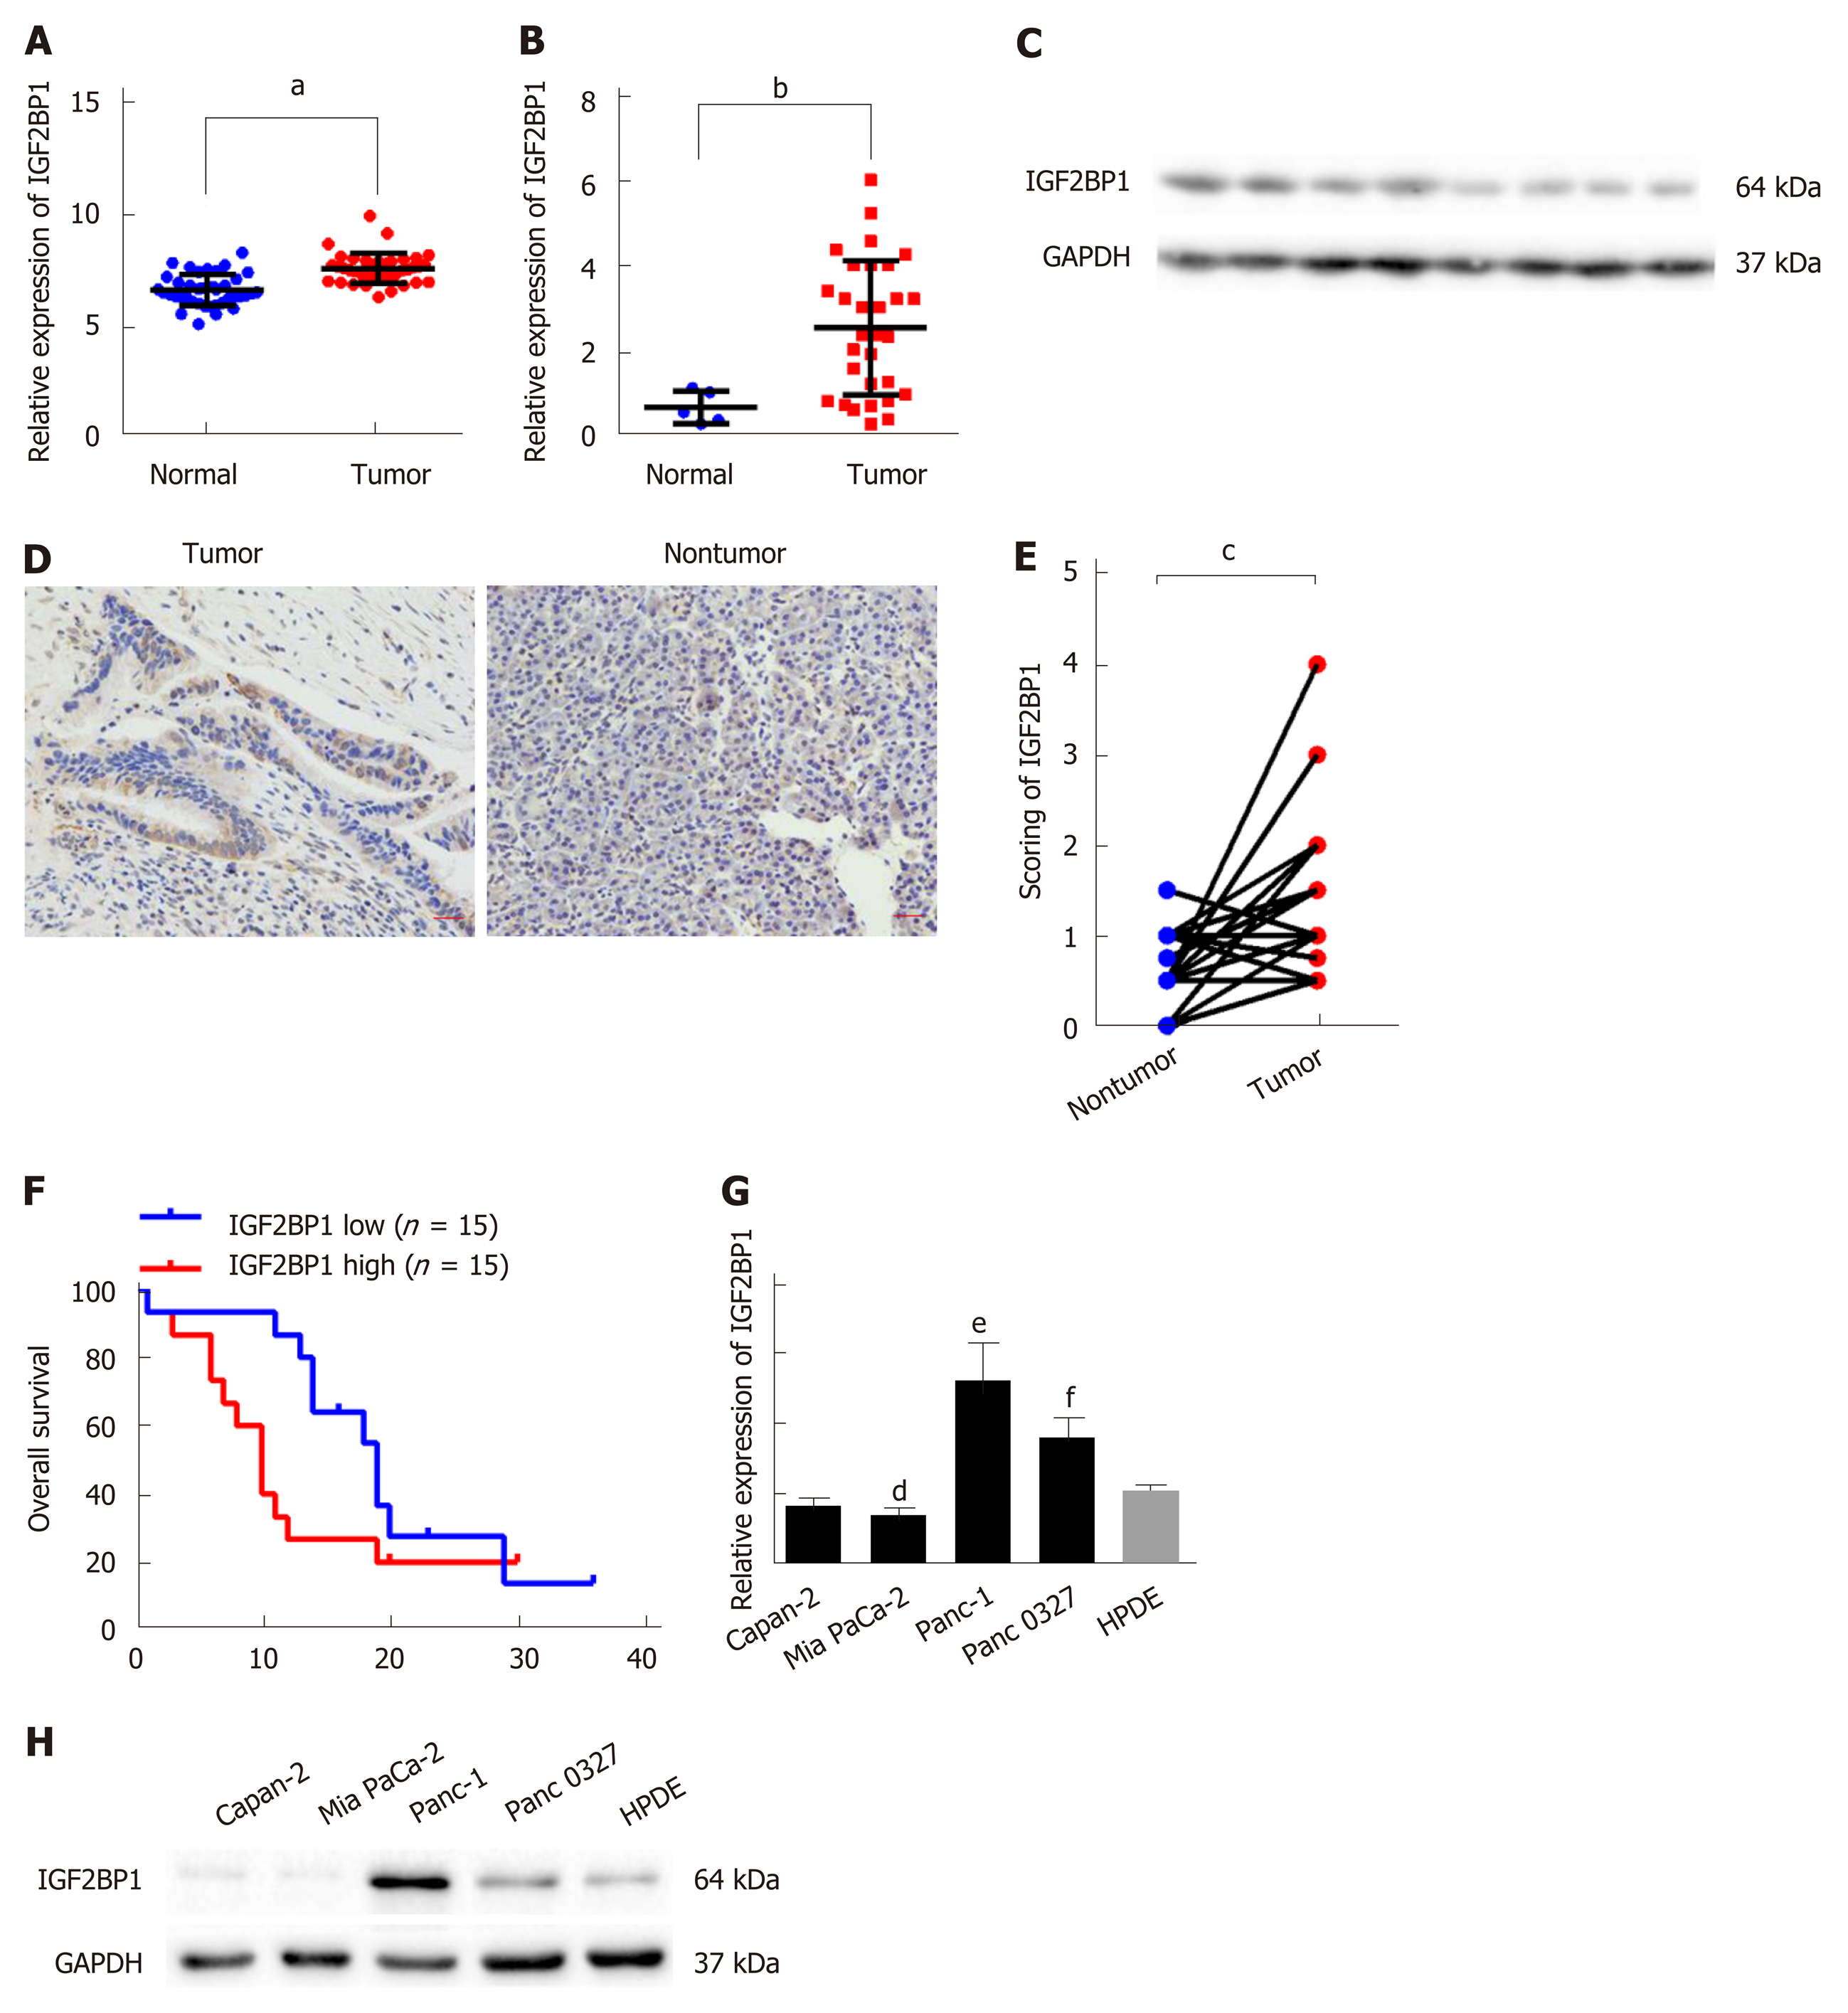
Figure 1 Insulin-like growth factor 2 mRNA-binding protein 1 overexpression correlates with a poor prognosis in pancreatic cancer.
A: The mRNA level of insulin-like growth factor 2 mRNA-binding protein 1 (IGF2BP1) was analyzed in the GSE15471 pancreatic cancer dataset; B: The mRNA level of IGF2BP1 was determined by reverse transcription real-time quantitative polymerase chain reaction in 30 cancerous tissues and five normal pancreatic tissues from patients at The Affiliated Cancer Hospital of Zhengzhou University. GAPDH served as the internal reference; C: The protein level of IGF2BP1 was determined by immunoblotting in five cancerous tissues and three normal pancreatic tissues; D: Representative images of IGF2BP1 in pancreatic cancer tissues and their corresponding nontumor tissues by immunohistochemistry. Scale bar = 25 μm (red line); E: Quantitative analysis of the IGF2BP1 expression score in pancreatic cancer tissues and adjacent nontumor tissues; F: Kaplan-Meier analysis of overall survival of patients with pancreatic cancer according to the expression level of IGF2BP1; G-H: The mRNA and protein expression levels of IGF2BP1 in four pancreatic cancer cell lines compared with the expression levels in immortalized human pancreatic ductal epithelial cells (HPDE). GAPDH served as the loading control. All data are expressed as the mean ± standard deviation from three independent experiments at least and P < 0.05 was considered statistically significant. aP < 0.001 vs normal group; bP < 0.05 vs normal group; cP < 0.001 vs nontumor group; dP < 0.05 vs HPDE, eP < 0.05 vs HPDE, fP < 0.05 vs HPDE. HPDE: Human pancreatic ductal epithelial cells; IGF2BP1: Insulin-like growth factor 2 mRNA-binding protein 1.
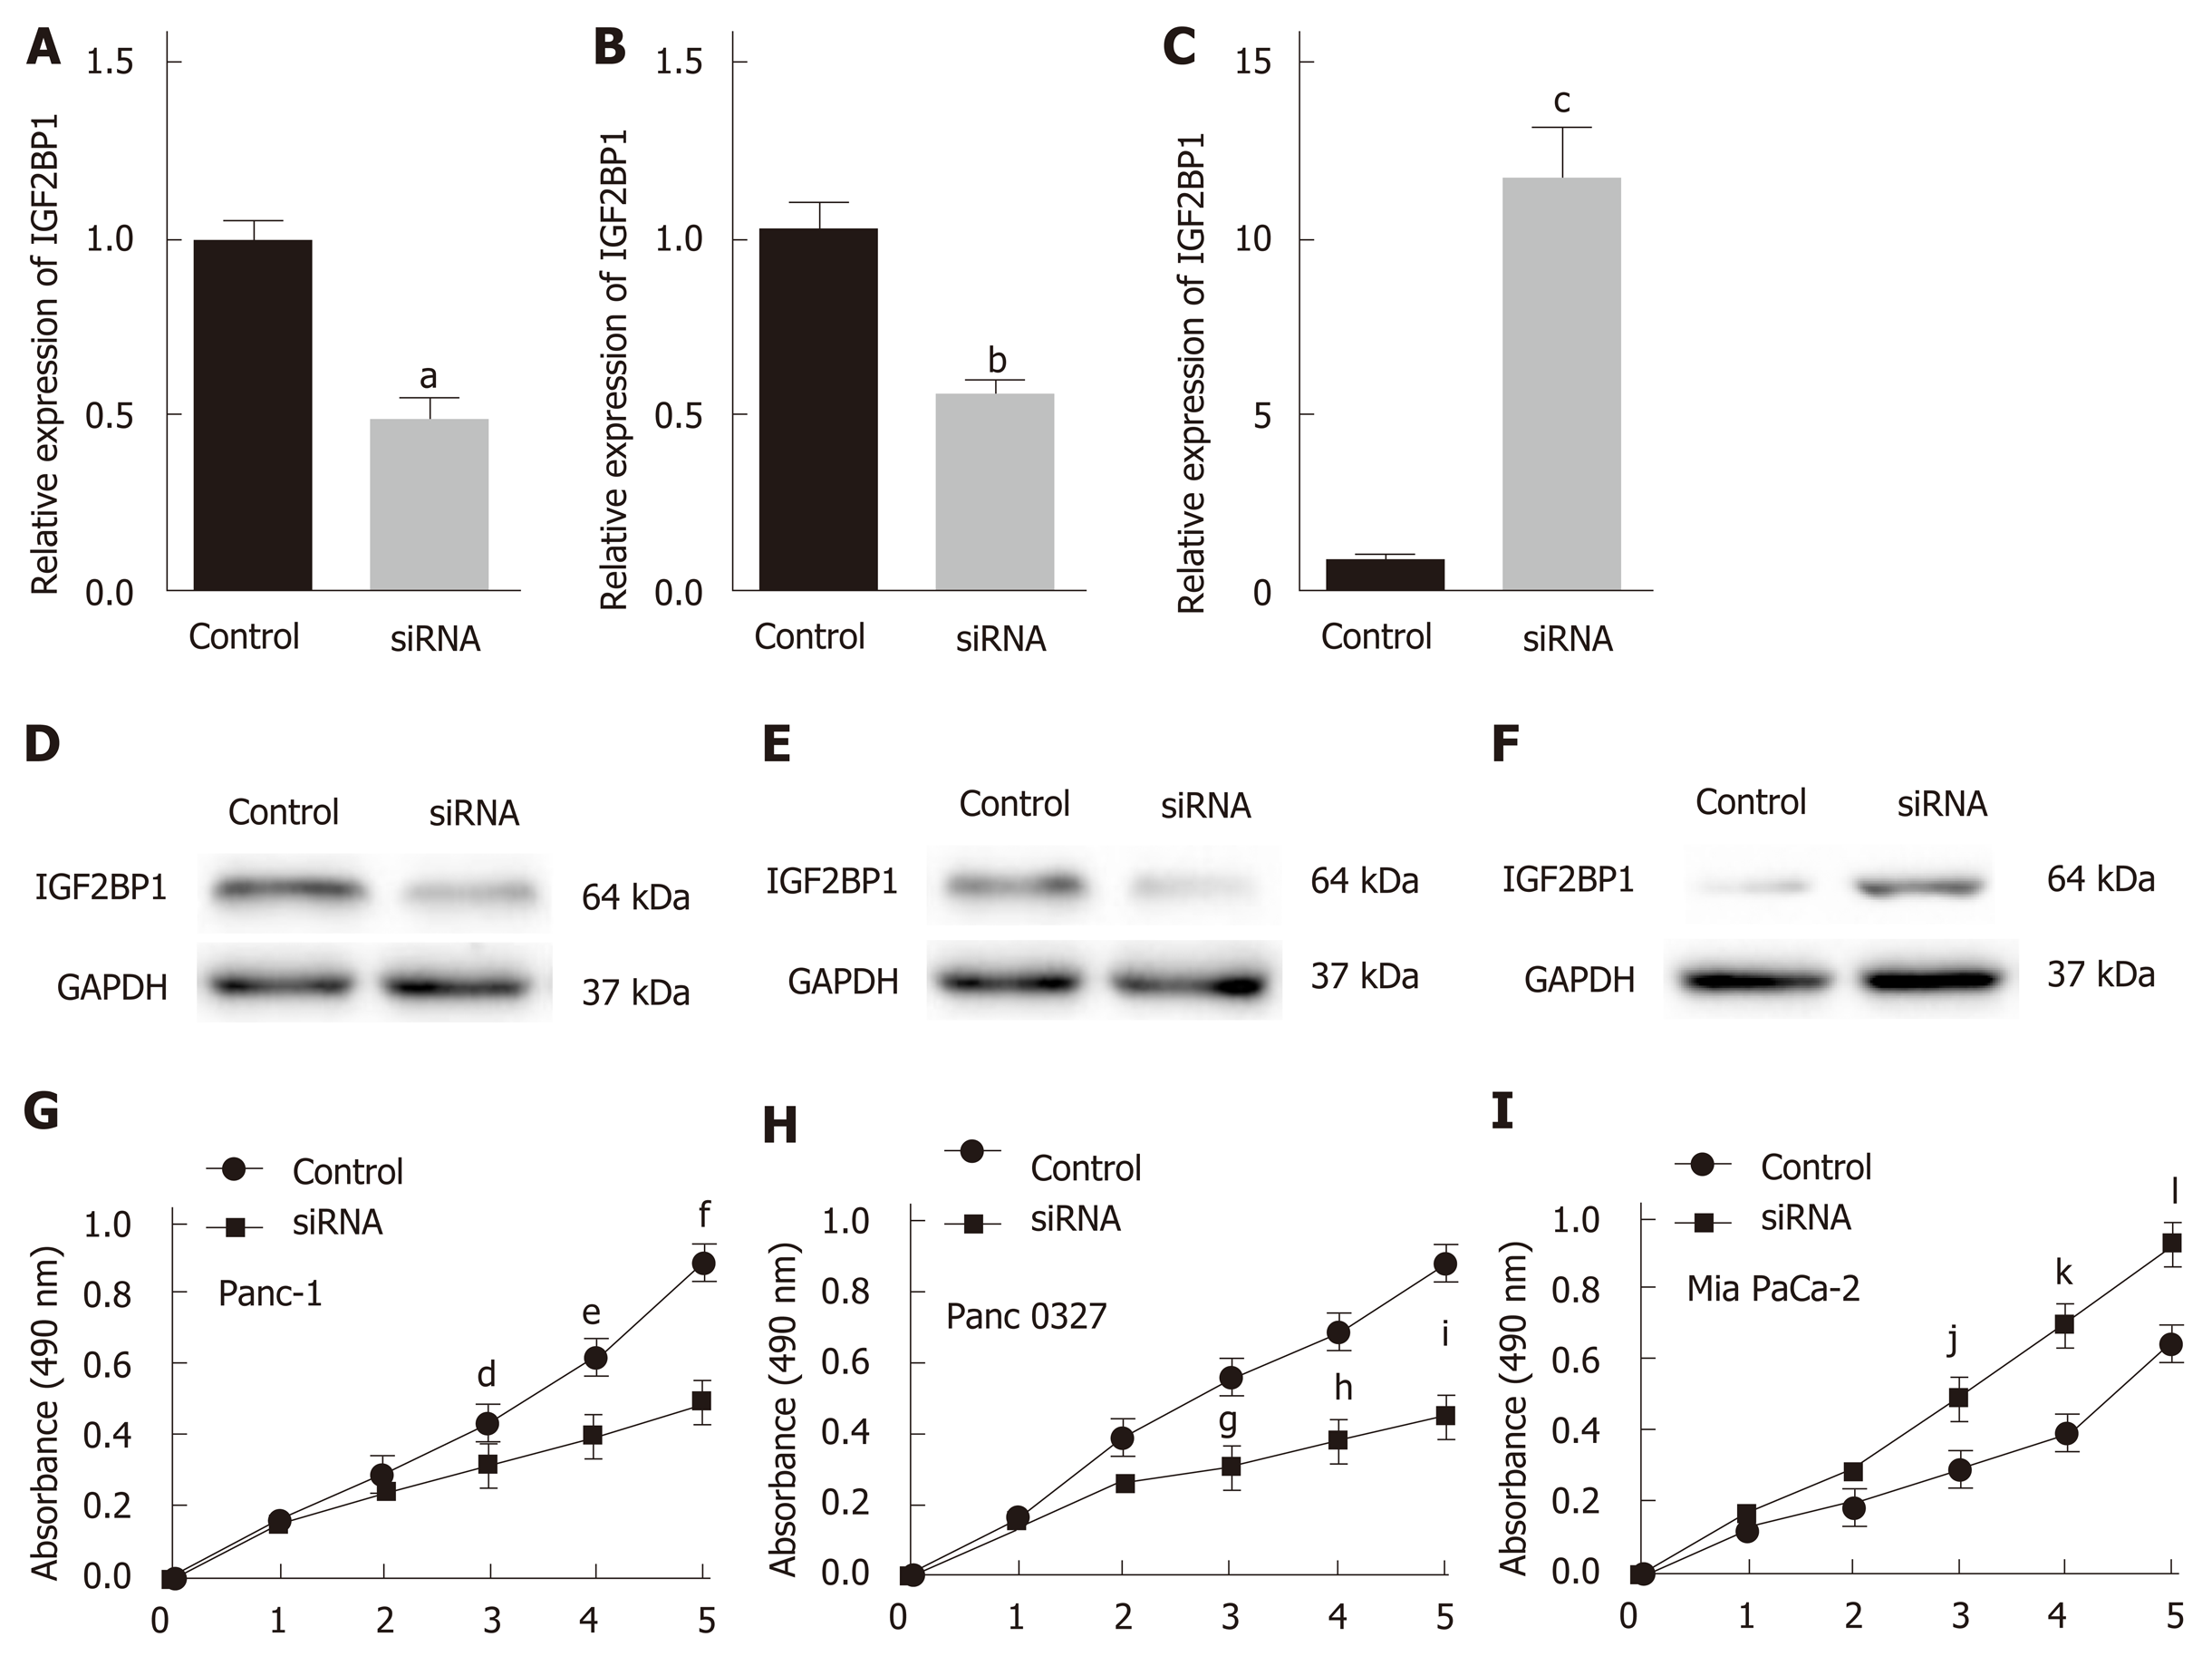
Figure 2 Knockdown of insulin-like growth factor 2 mRNA-binding protein 1 inhibits pancreatic cancer cell proliferation in vitro.
A-C: Insulin-like growth factor 2 mRNA-binding protein 1 (IGF2BP1) levels were determined by quantitative reverse transcription polymerase chain reaction analysis 48 h after transfection; D-F: IGF2BP1 levels were determined by Western blot analysis 48 h after transfection; G-I: CCK-8 assays were performed to compare the proliferation of IGF2BP1 knockdown or overexpressing cells vs the control cells. GAPDH served as the loading control. All data are expressed as the mean ± standard deviation from three independent experiments at least and P < 0.05 was considered statistically significant. aP < 0.05 vs siRNA group; bP < 0.05 vs normal group; cP < 0.01 vs IGF2BP1-OE group; dP < 0.05 vs siRNA at day 3; eP < 0.01 vs siRNA at day 4; fP < 0.01 vs siRNA at day 5; gP < 0.01 vs siRNA at day 3; hP < 0.01 vs siRNA at day 4; iP < 0.01 vs siRNA at day 5; jP < 0.05 vs siRNA at day 3; kP < 0.01 vs siRNA at day 4; lP < 0.01 vs siRNA at day 5. IGF2BP1: Insulin-like growth factor 2 mRNA-binding protein 1.
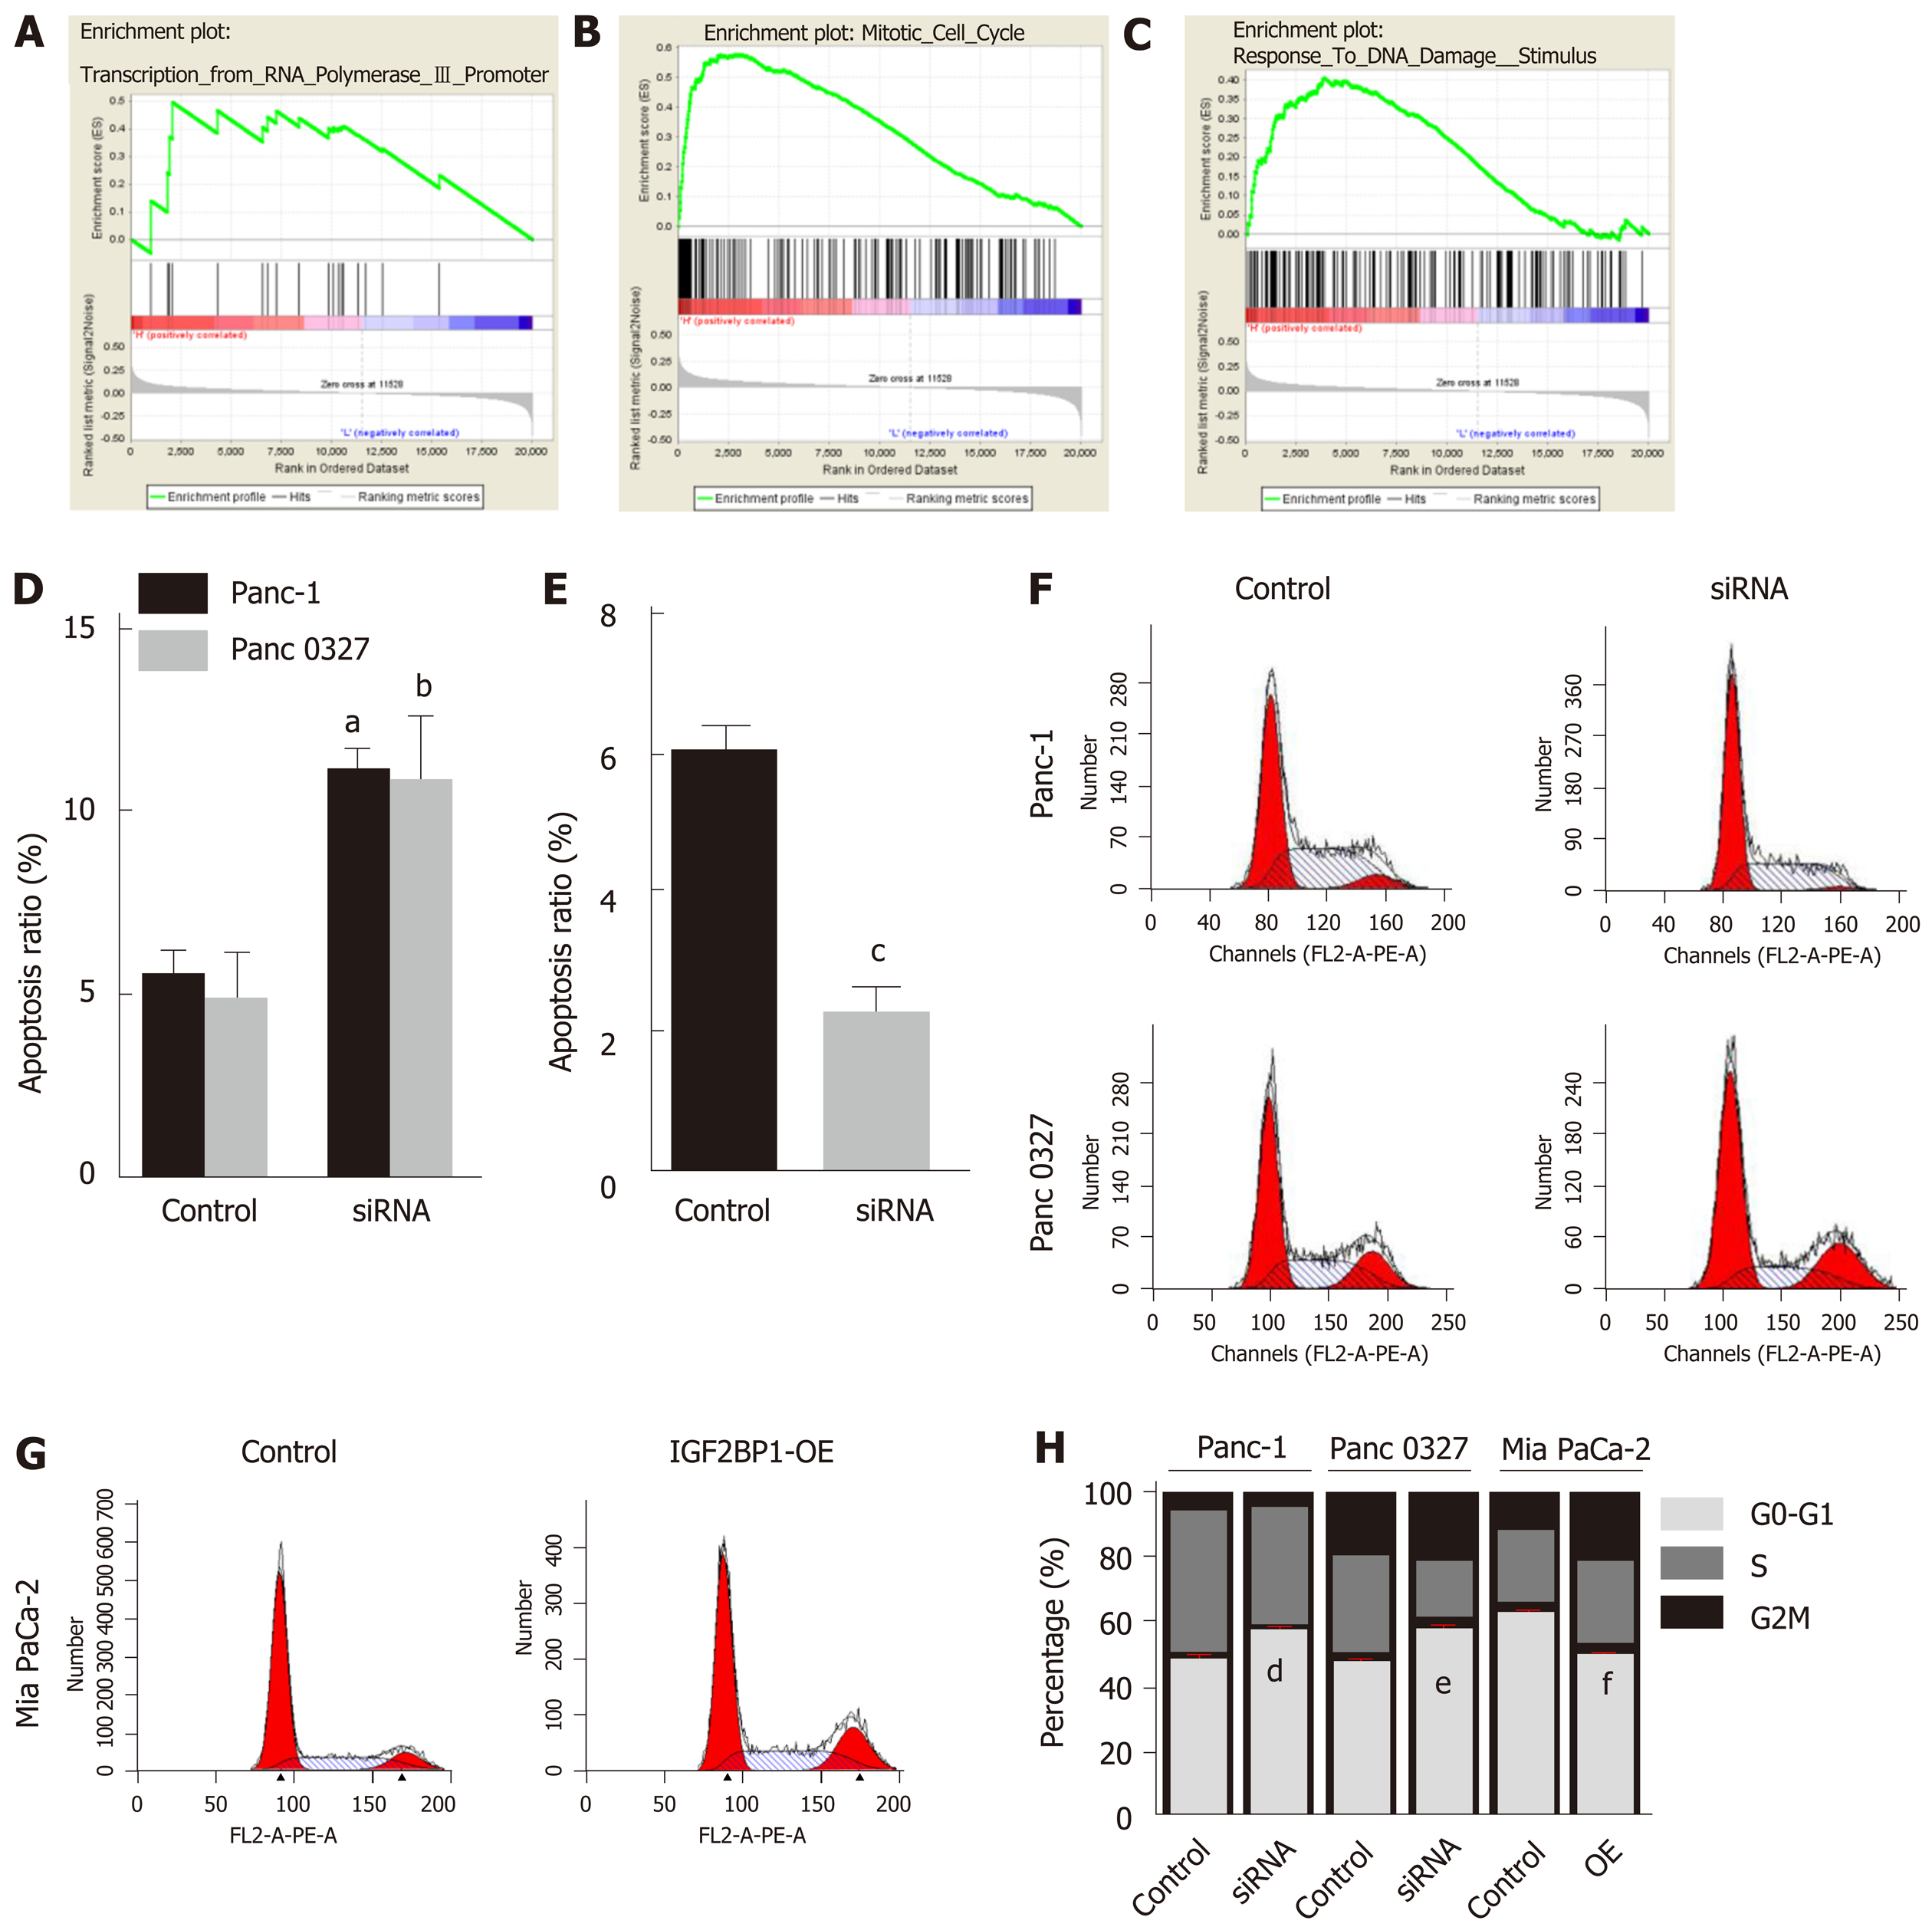
Figure 3 Knockdown of insulin-like growth factor 2 mRNA-binding protein 1 inhibits pancreatic cancer cell proliferation by inducing apoptosis and G1-phase arrest.
A-C: Enrichment plots of gene expression signatures in the GSE62165 dataset according to insulin-like growth factor 2 mRNA-binding protein 1 (IGF2BP1) mRNA expression levels; D: Knockdown of IGF2BP1 induced apoptosis in Panc-1 and Panc 0327 cells; E: Overexpression of IGF2BP1 reduced apoptosis in Mia PaCa-2 cells; F-H: Knockdown of IGF2BP1 induced G0/G1 phase arrest in Panc-1 and Panc 0327 cells and overexpression of IGF2BP1 promoted cell cycle progression in Mia PaCa-2 cells. All data are expressed as the mean ± standard deviation from three independent experiments at least and P < 0.05 was considered statistically significant. aP < 0.01 vs control group of Panc-1 cells; bP < 0.01 vs control group of Panc 0327 cells; cP < 0.001 vs control group of Mia PaCa-2 cells; dP < 0.05 vs control group of Panc-1 cells; eP < 0.05 vs control group of Panc 0327 cells; fP < 0.05 vs control group of Mia PaCa-2 cells. IGF2BP1: Insulin-like growth factor 2 mRNA-binding protein 1.
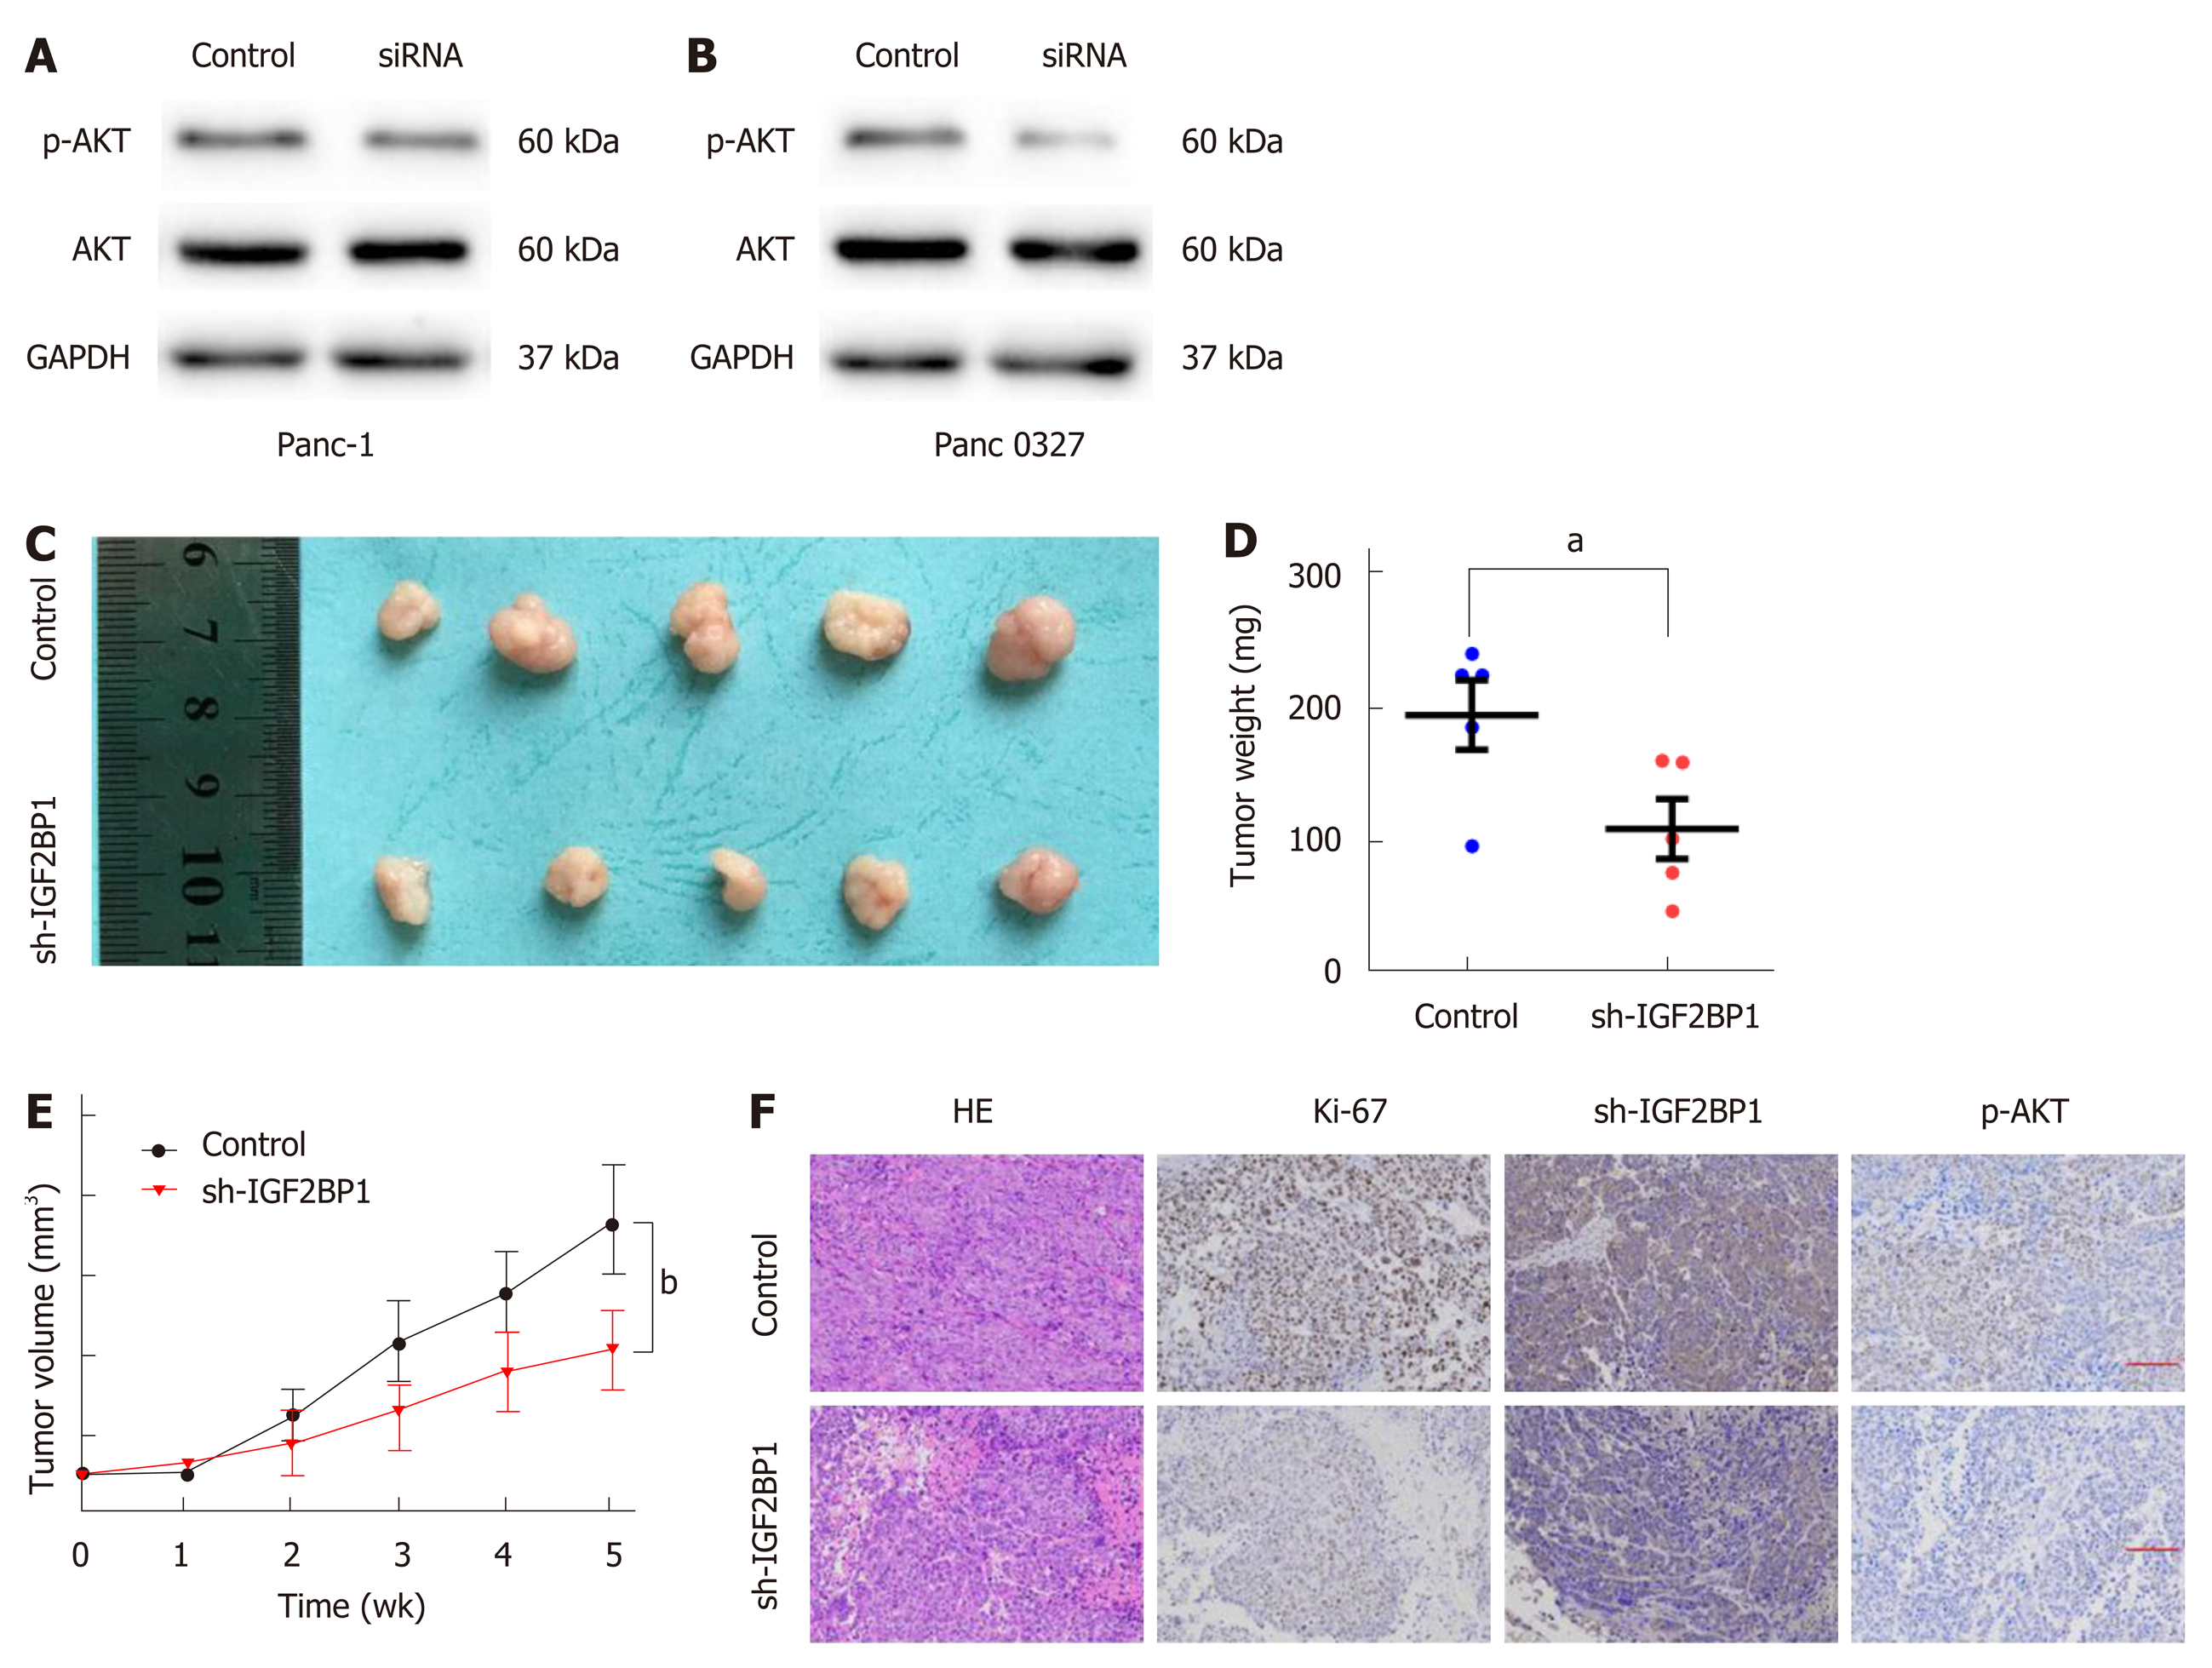
Figure 4 Insulin-like growth factor 2 mRNA-binding protein 1 enhances pancreatic cancer cell proliferation via the AKT signaling pathway.
A and B: Western blot analysis of AKT and p-AKT (Ser473) expression in the indicated cells and their corresponding control cells; C: Panc-1 sh-insulin-like growth factor 2 mRNA-binding protein 1 (IGF2BP1) or control cells were subcutaneously injected into BALB/c nude mice for xenograft assays; D-E: The average weights and tumor growth curves of each group; F: Immunohistochemistry staining of the xenograft tumors. Scale bar = 25 μm (red line). P < 0.05 was considered statistically significant. aP < 0.05 vs control group; bP < 0.05 vs sh-IGF2BP1 group. IGF2BP1: Insulin-like growth factor 2 mRNA-binding protein 1.
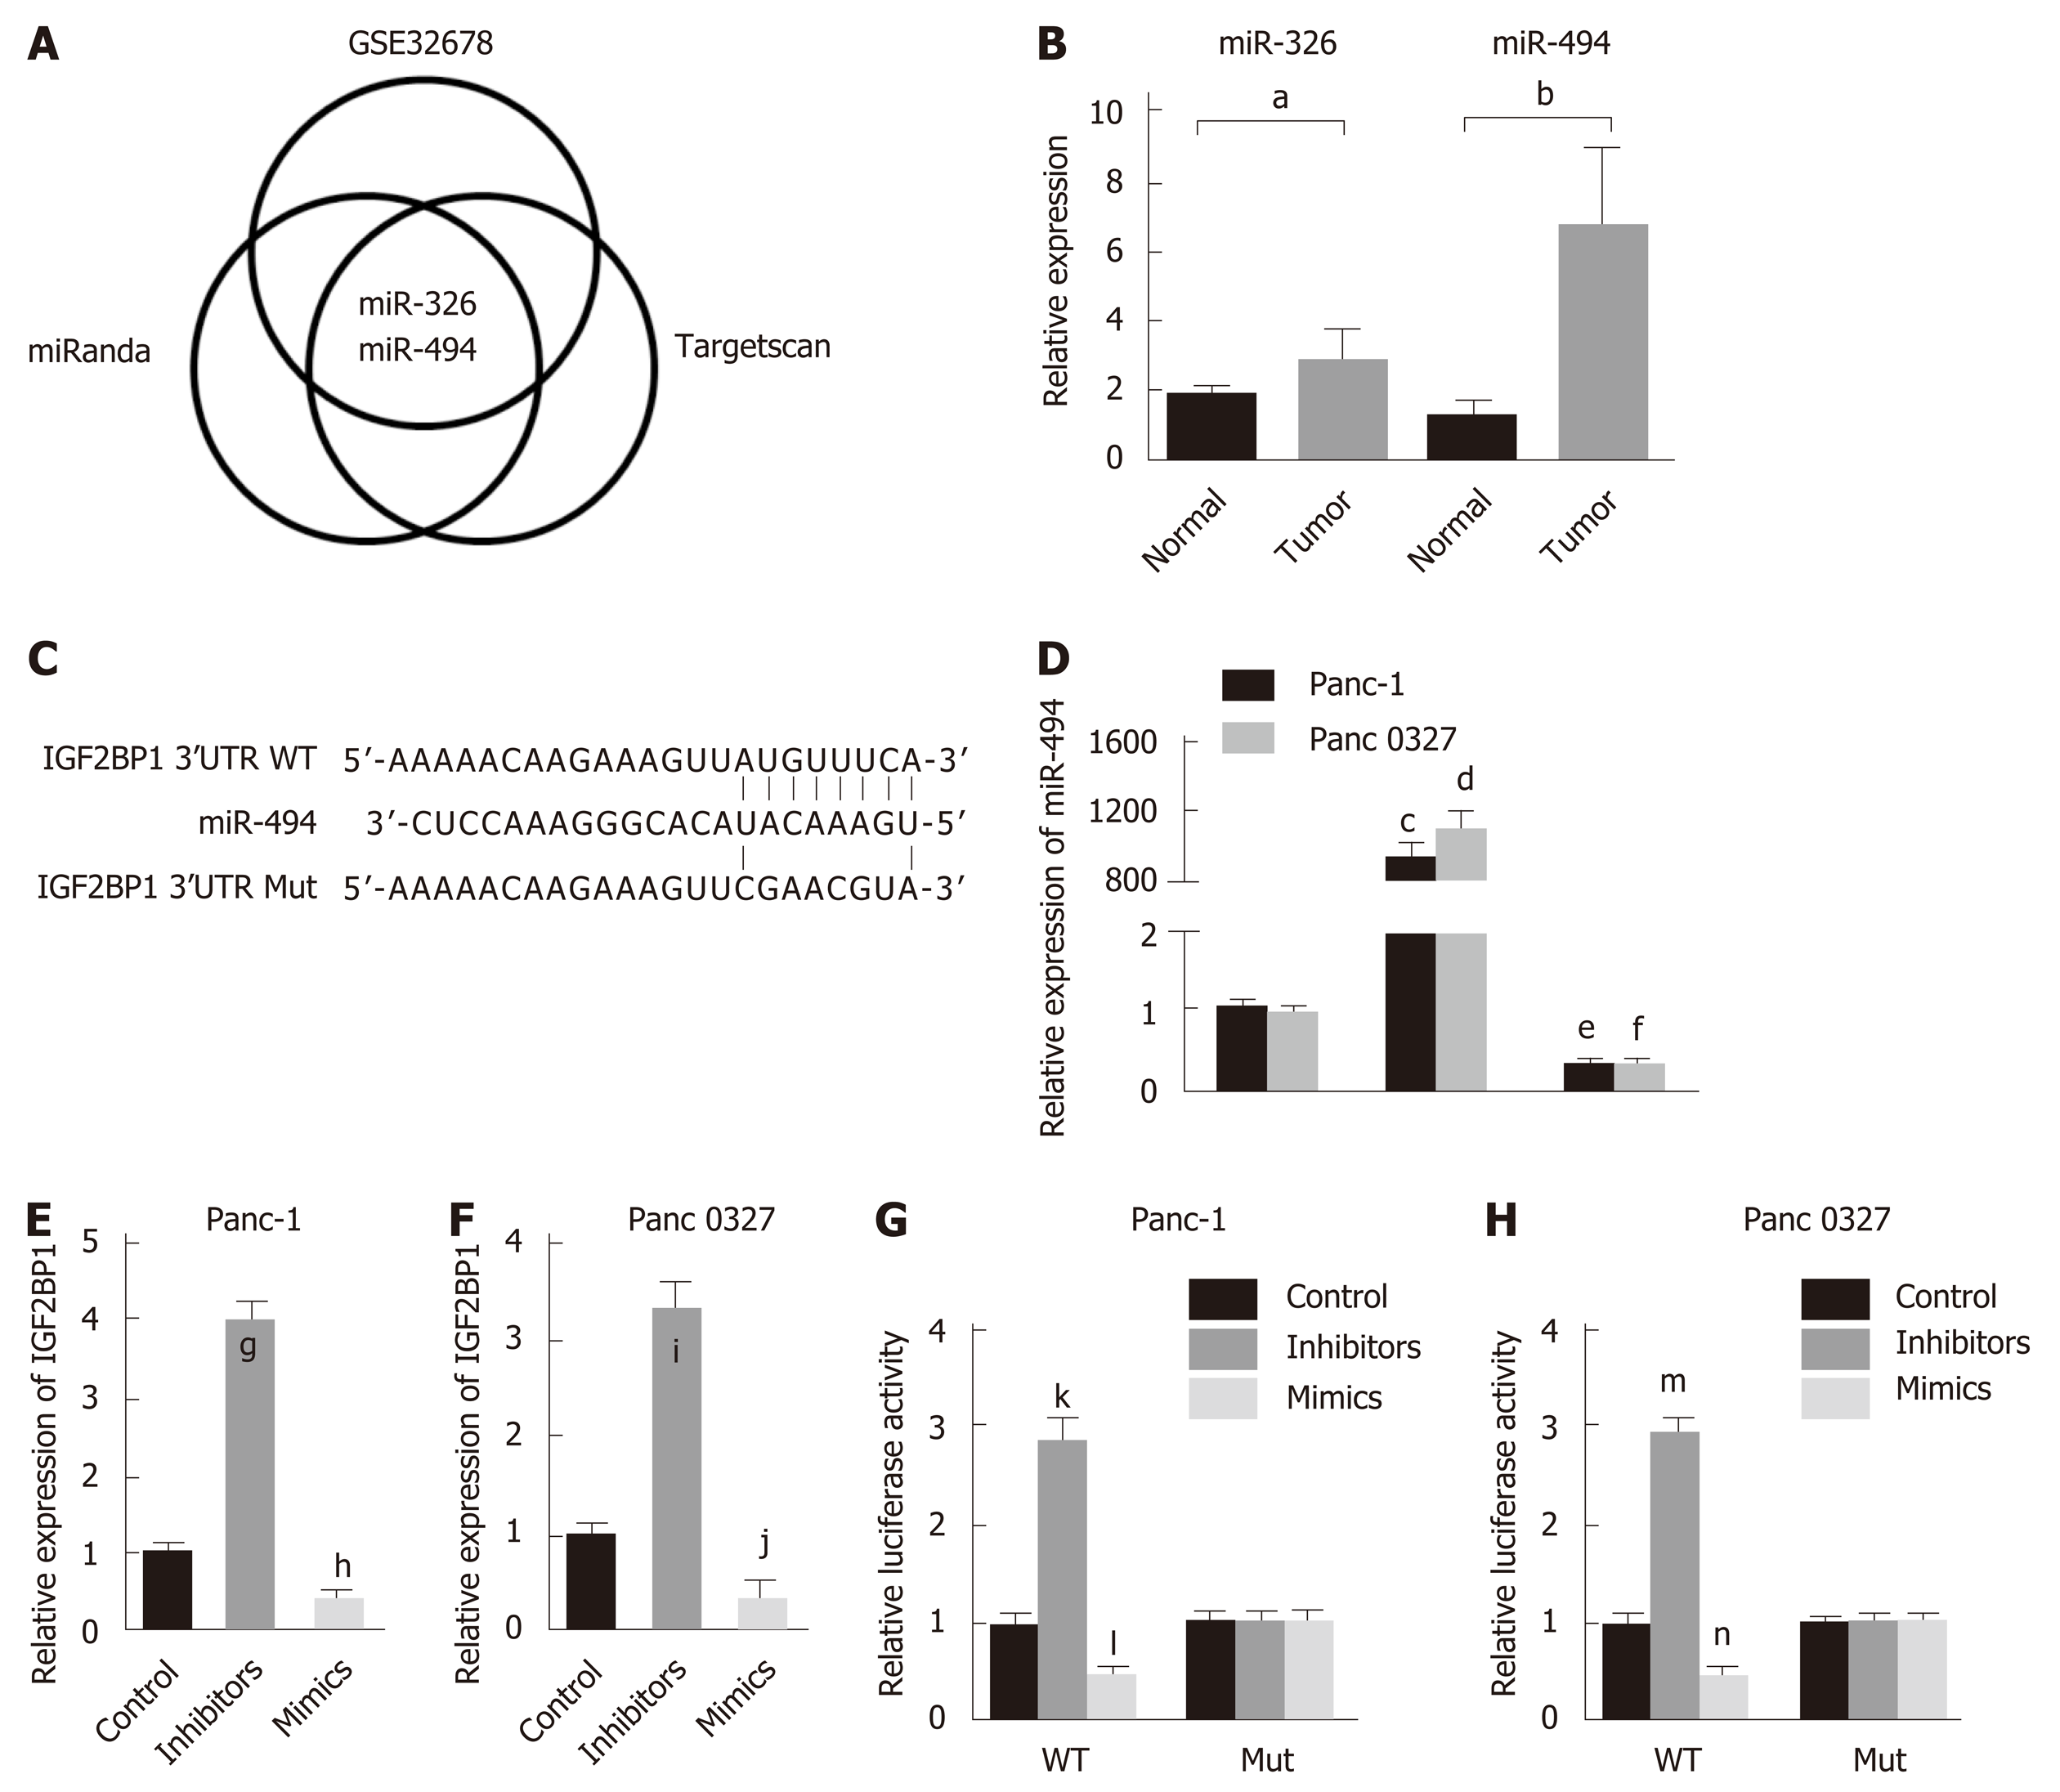
Figure 5 Insulin-like growth factor 2 mRNA-binding protein 1 is a target of miR-494.
A: Intersections among miRNA target prediction algorithms; B: Pancreatic cancer tissues displayed significantly lower miR-494 and miR-326 levels than the matched adjacent nontumor tissues; C: A schematic diagram of miR-494 binding sites in the 3’ untranslated region of insulin-like growth factor 2 mRNA-binding protein 1 (IGF2BP1) from TargetScan; D: MiR-494 mimics or inhibitors were transfected into Panc-1 and Panc 0327 cells, respectively, and miR-494 expression was determined by quantitative reverse transcription polymerase chain reaction (RT-qPCR). U6 served as the internal reference; E-F: IGF2BP1 expression was determined by RT-qPCR after transfection in Panc-1 and Panc 0327 cells. GAPDH served as the internal reference; G-H: The relative luciferase activity was measured in Panc-1 and Panc 0327 cells after cotransfection. All data are expressed as the mean ± standard deviation from three independent experiments at least and P < 0.05 was considered statistically significant. aP < 0.05 vs normal group, bP < 0.001 vs normal group; cP < 0.001 vs control group of Panc-1 cells; dP < 0.001 vs control group of Panc 0327 cells; eP < 0.01 vs control group of Panc-1 cells; fP < 0.01 vs control group of Panc 0327 cells; gP < 0.01 vs control group; hP < 0.05 vs control group; iP < 0.05 vs control group; jP < 0.01 vs control group; kP < 0.05 vs WT group; lP < 0.01 vs WT group; mP < 0.01 vs WT group; nP < 0.01 vs WT group. IGF2BP1: Insulin-like growth factor 2 mRNA-binding protein 1; 3’-UTR: 3’-untranslated region; Wt: Wild-type; Mut: Mutated.
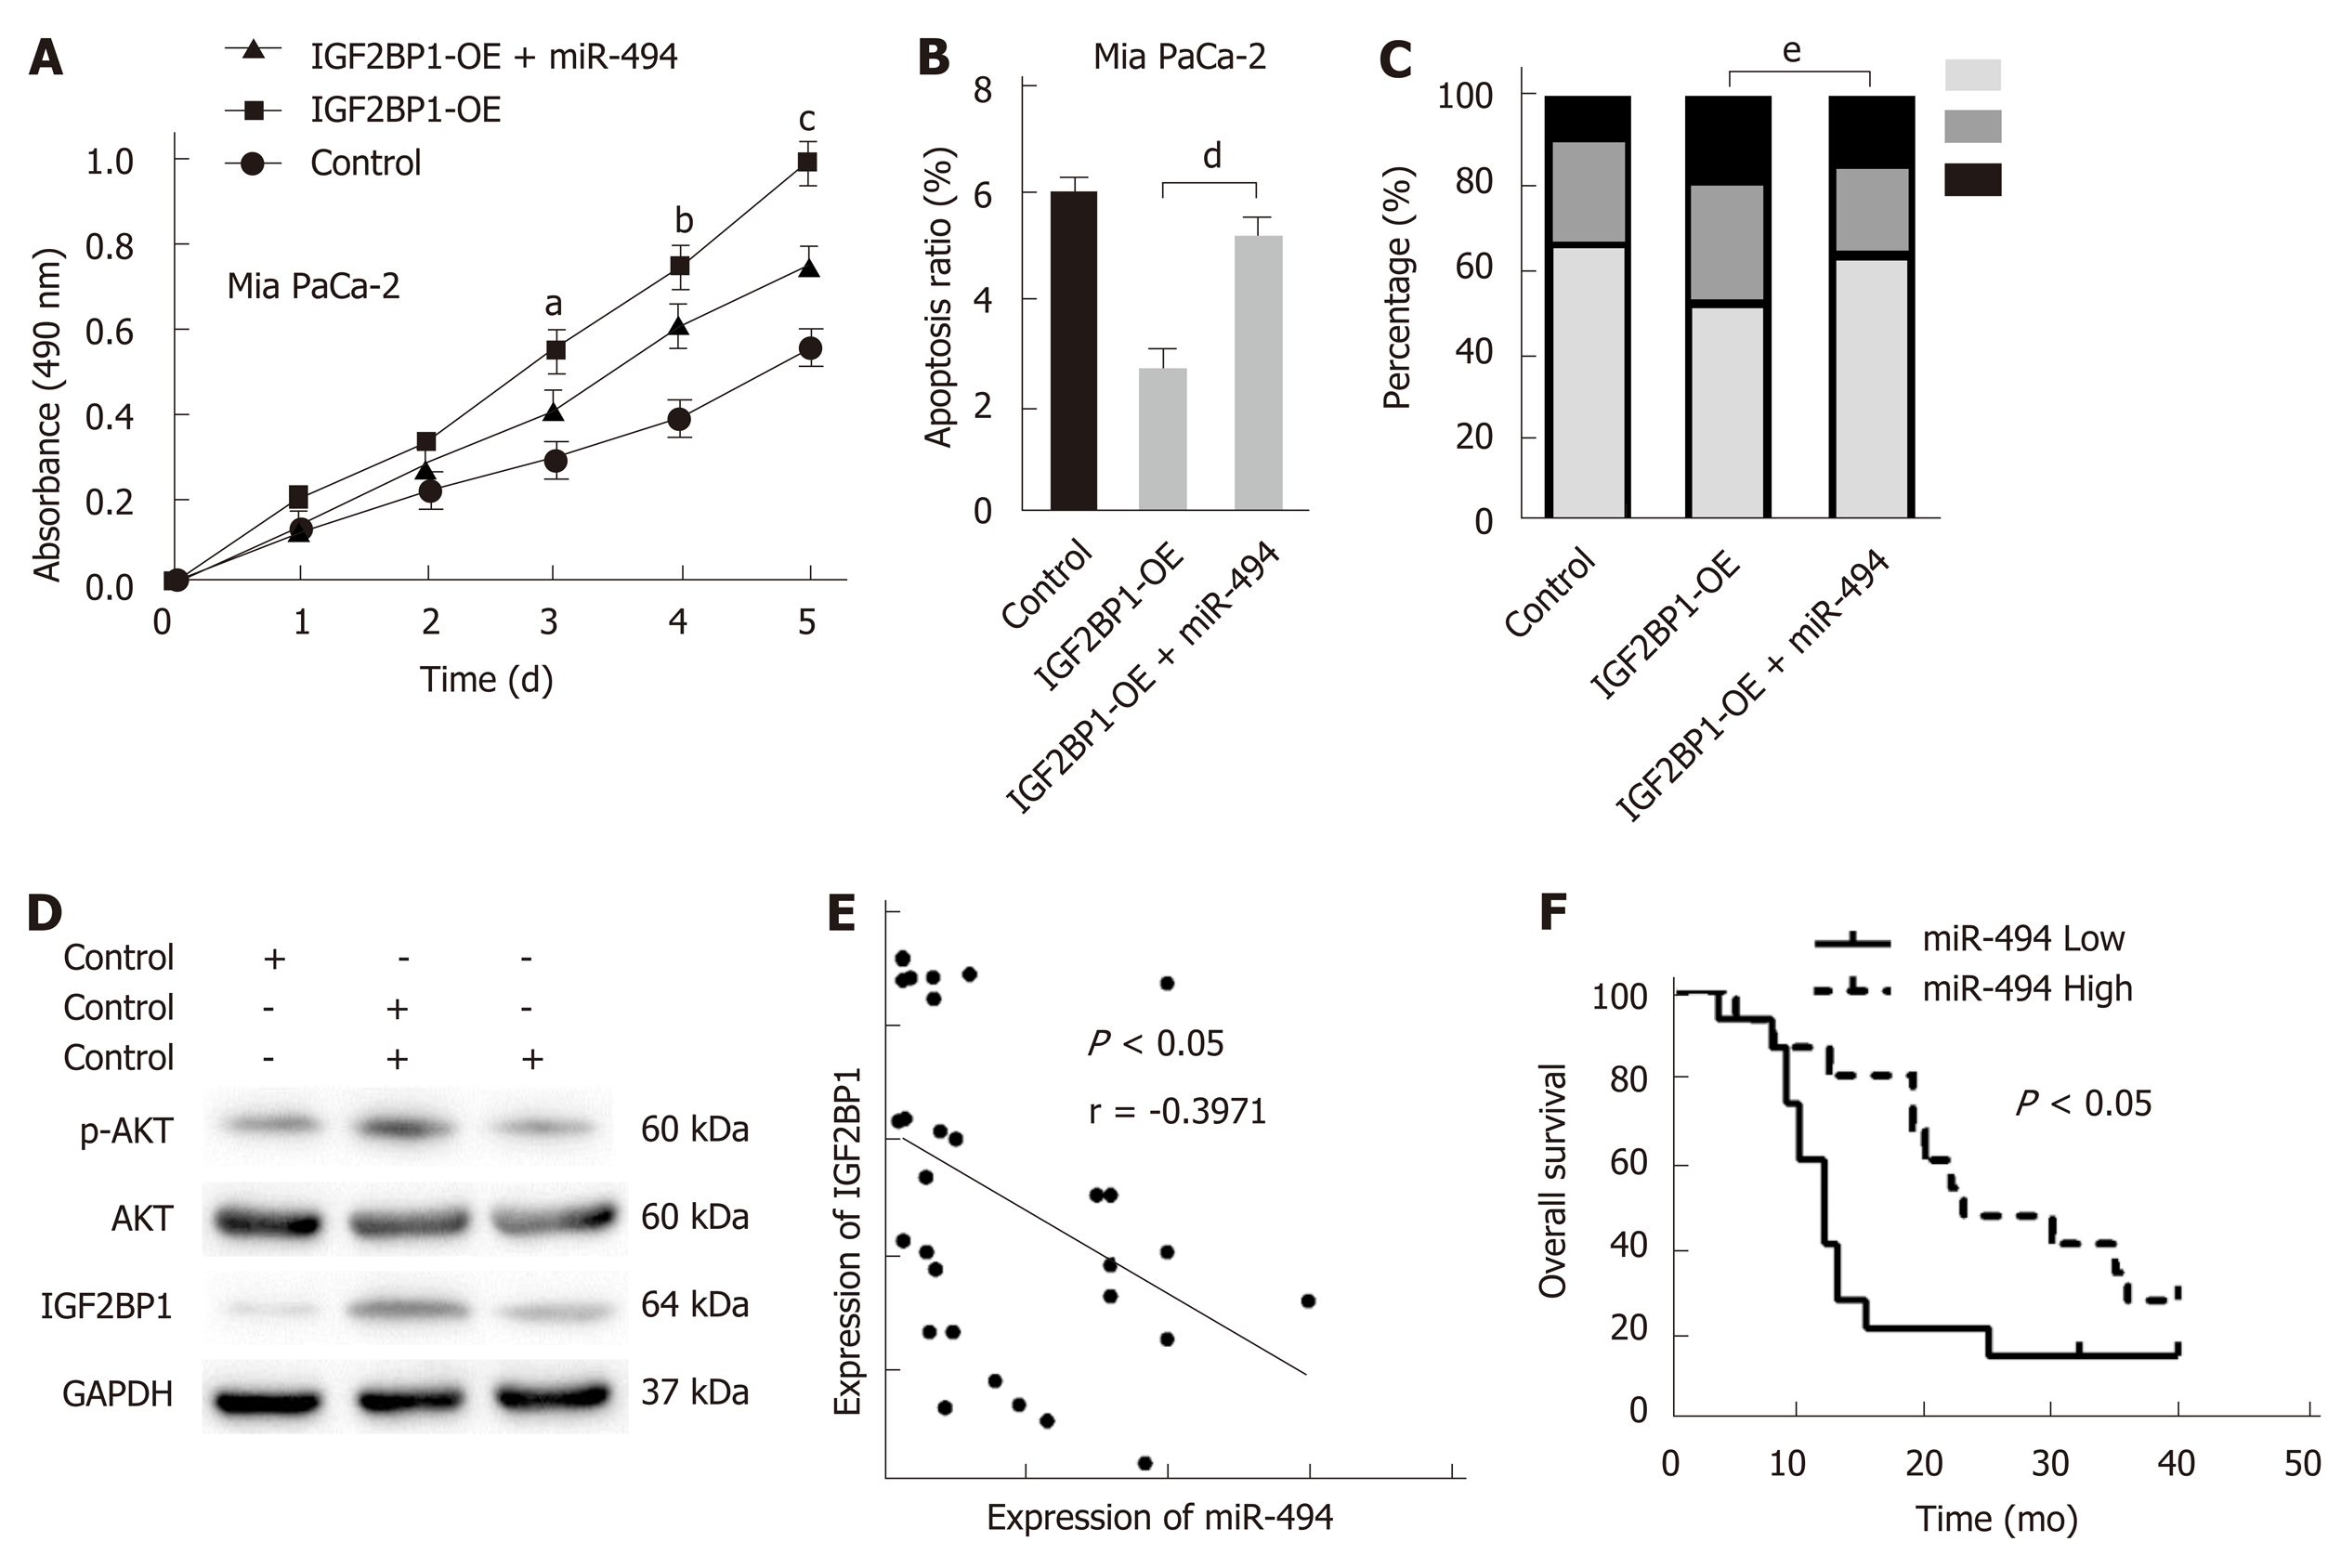
Figure 6 MiR-494 reexpression partly abrogates the oncogenic effect of insulin-like growth factor 2 mRNA-binding protein 1 in pancreatic cancer.
A: Enhanced cell viability of Mia PaCa-2 cells due to insulin-like growth factor 2 mRNA-binding protein 1 (IGF2BP1) overexpression was partly reduced following the reexpression of miR-494, which was detected by CCK-8 assays; B: Cell apoptosis was analyzed by flow cytometry when IGF2BP1-overexpressing Mia PaCa-2 cells were cotransfected with miR-494 mimics or their corresponding controls; C: The cell cycle was analyzed by flow cytometry when IGF2BP1-overexpressing Mia PaCa-2 cells were co-transfected with miR-494 mimics or control; D: Western blot analysis of AKT and p-AKT (Ser473) expression in the indicated cells and their corresponding control group; E: Correlations between the expression of miR-494 and IGF2BP1 in 30 pancreatic cancer specimens were determined by Pearson's correlation analysis; F: Kaplan-Meier analysis indicated that low miR-494 expression predicts a poorer overall survival rate than high miR-494 expression. All data are expressed as the mean ± standard deviation from three independent experiments at least and P < 0.05 was considered statistically significant. aP < 0.05 vs IGF2BP1-OE + miR-494 group at day 3; bP < 0.05 vs IGF2BP1-OE + miR-494 group at day 4; cP < 0.05 vs IGF2BP1-OE + miR-494 group at day 5; dP < 0.01 vs IGF2BP1-OE + miR-494 group; eP < 0.05 vs IGF2BP1-OE + miR-494 group. IGF2BP1: Insulin-like growth factor 2 mRNA-binding protein 1; 3’-UTR: 3’-untranslated region; Wt: Wild-type; Mut: Mutated.
- Citation: Wan BS, Cheng M, Zhang L. Insulin-like growth factor 2 mRNA-binding protein 1 promotes cell proliferation via activation of AKT and is directly targeted by microRNA-494 in pancreatic cancer. World J Gastroenterol 2019; 25(40): 6063-6076
- URL: https://www.wjgnet.com/1007-9327/full/v25/i40/6063.htm
- DOI: https://dx.doi.org/10.3748/wjg.v25.i40.6063


