Copyright
©The Author(s) 2019.
World J Gastroenterol. Jan 28, 2019; 25(4): 418-432
Published online Jan 28, 2019. doi: 10.3748/wjg.v25.i4.418
Published online Jan 28, 2019. doi: 10.3748/wjg.v25.i4.418
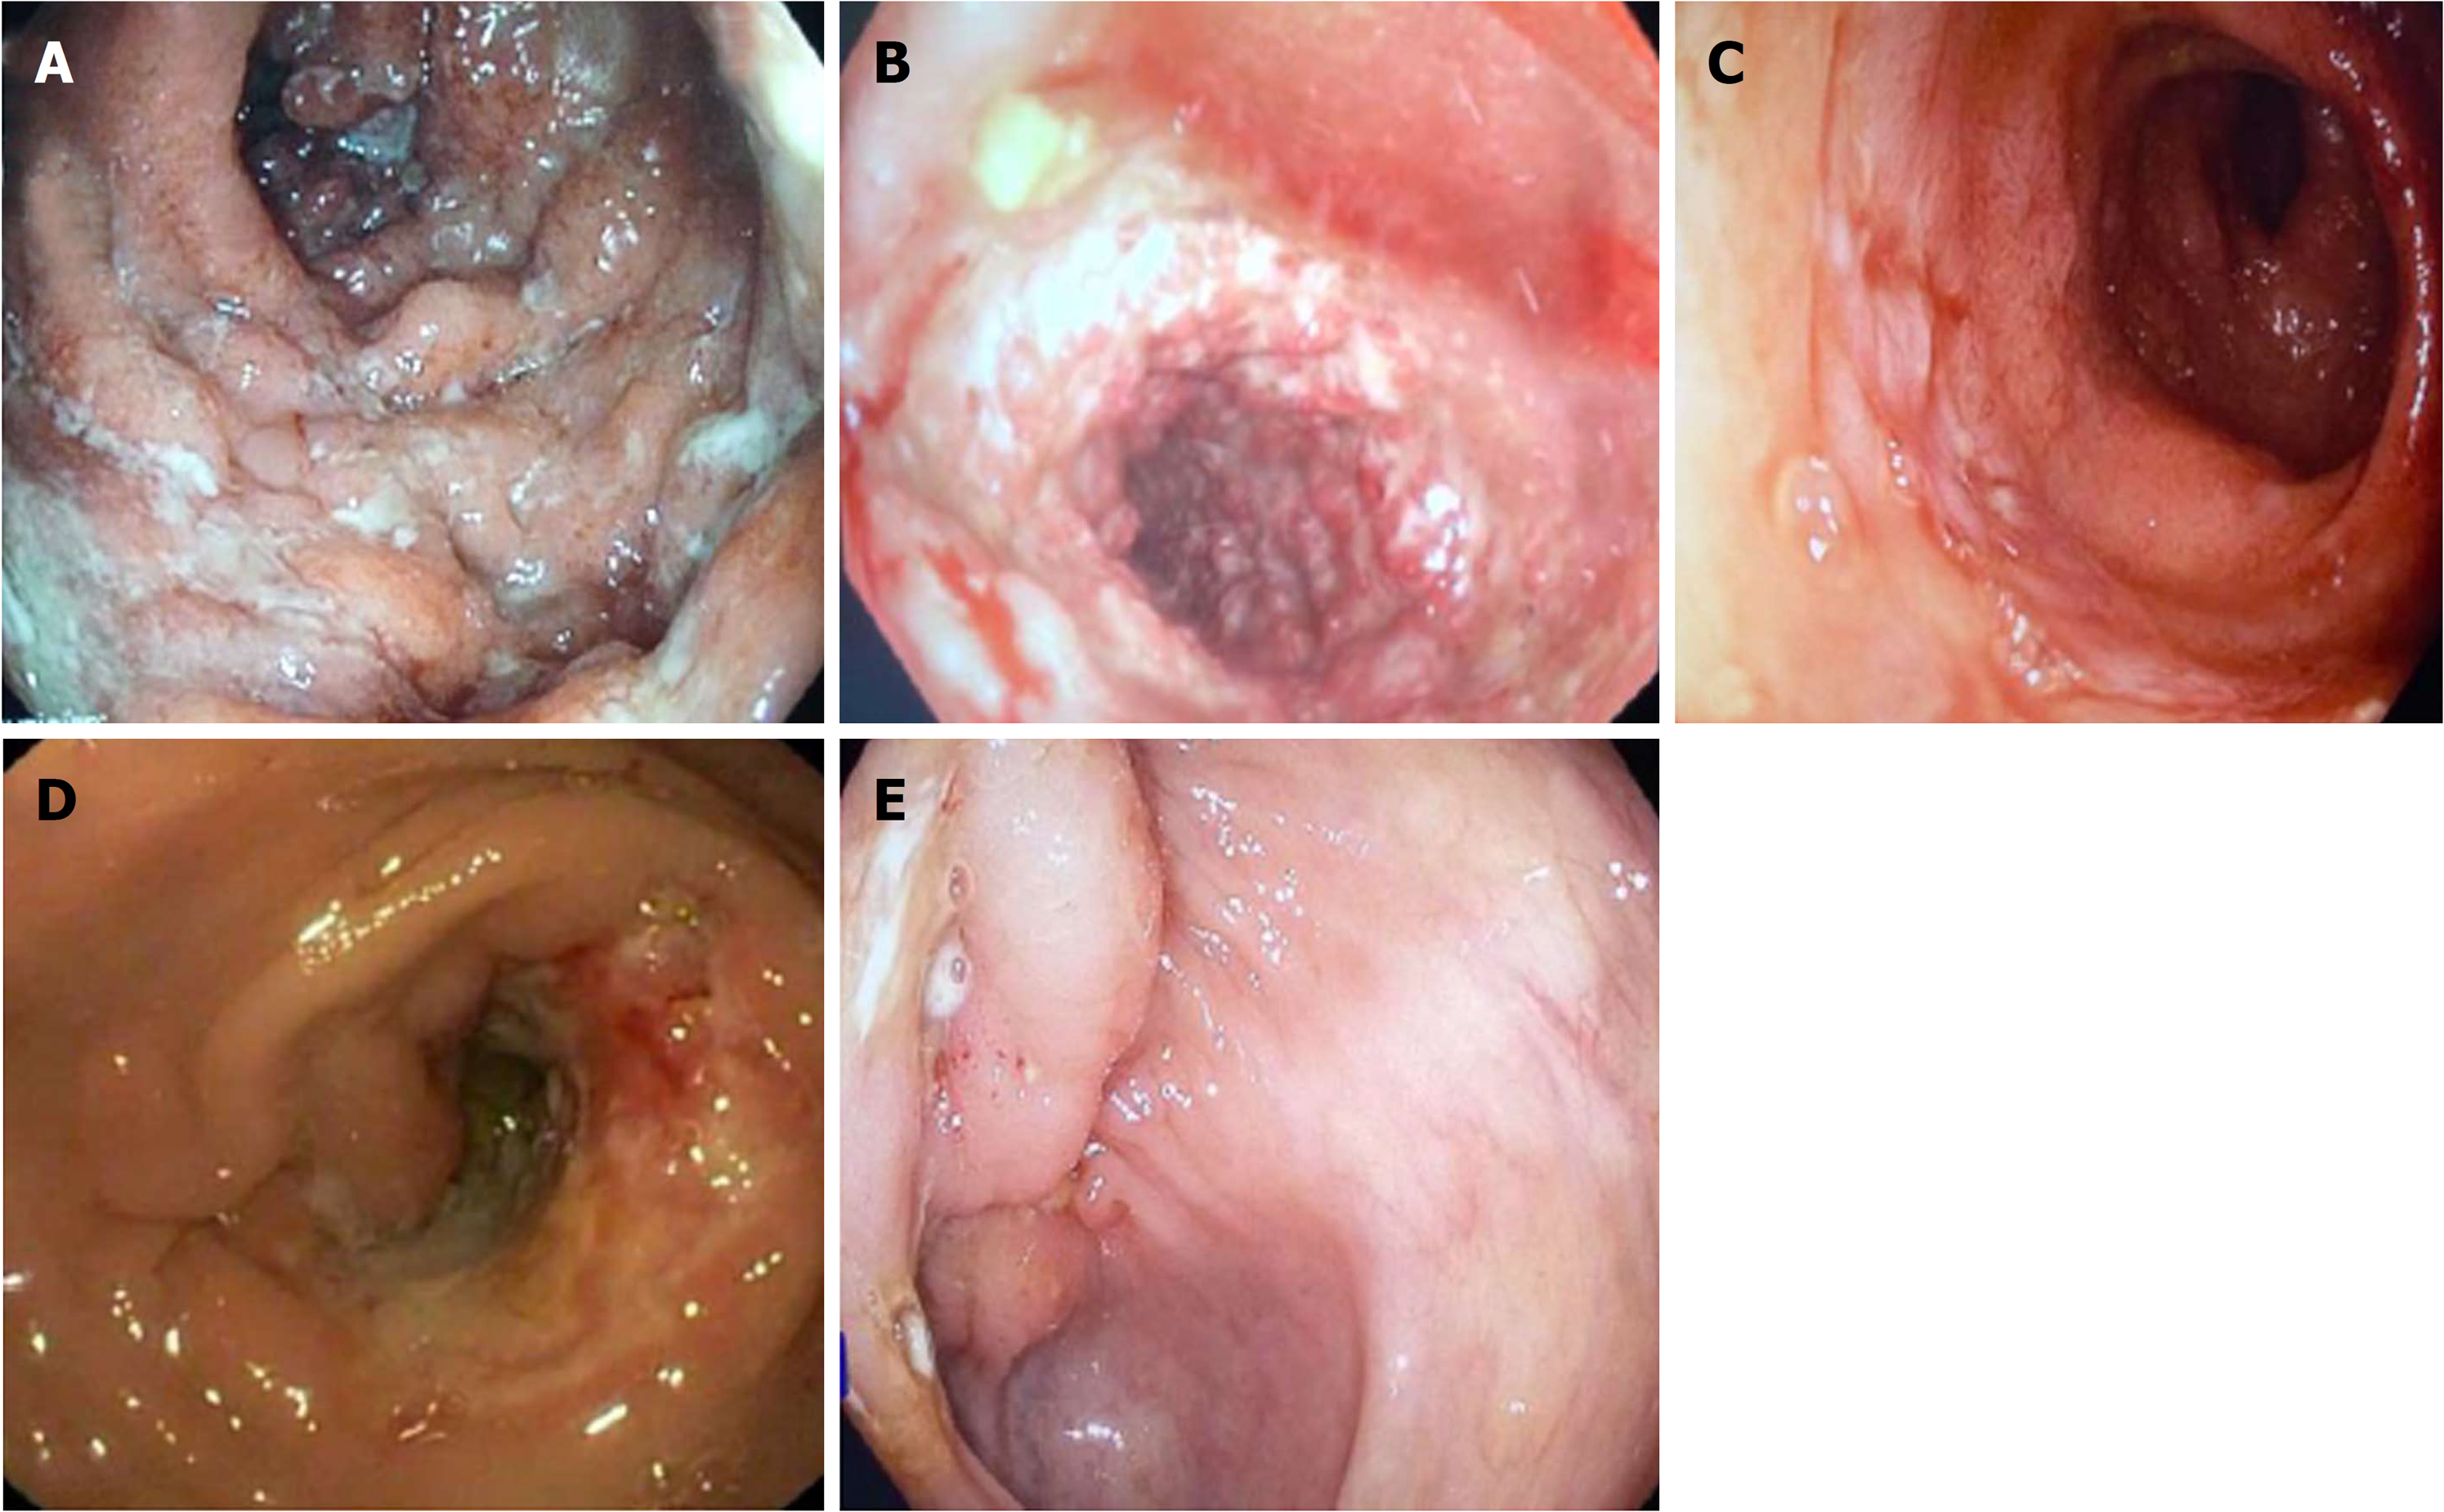
Figure 1 Endoscopic images.
A: Longitudinal ulcer in a patient with Crohn’s disease; B: Coblestoning in a patient with Crohn’s disease; C: Deep ileal ulcer in a patient with Crohn’s disease; D: Transverse ulcer with a stricture in a patient with intestinal tuberculosis; E: Ulcerated bulky ileocaecal valve in a patient with intestinal tuberculosis.
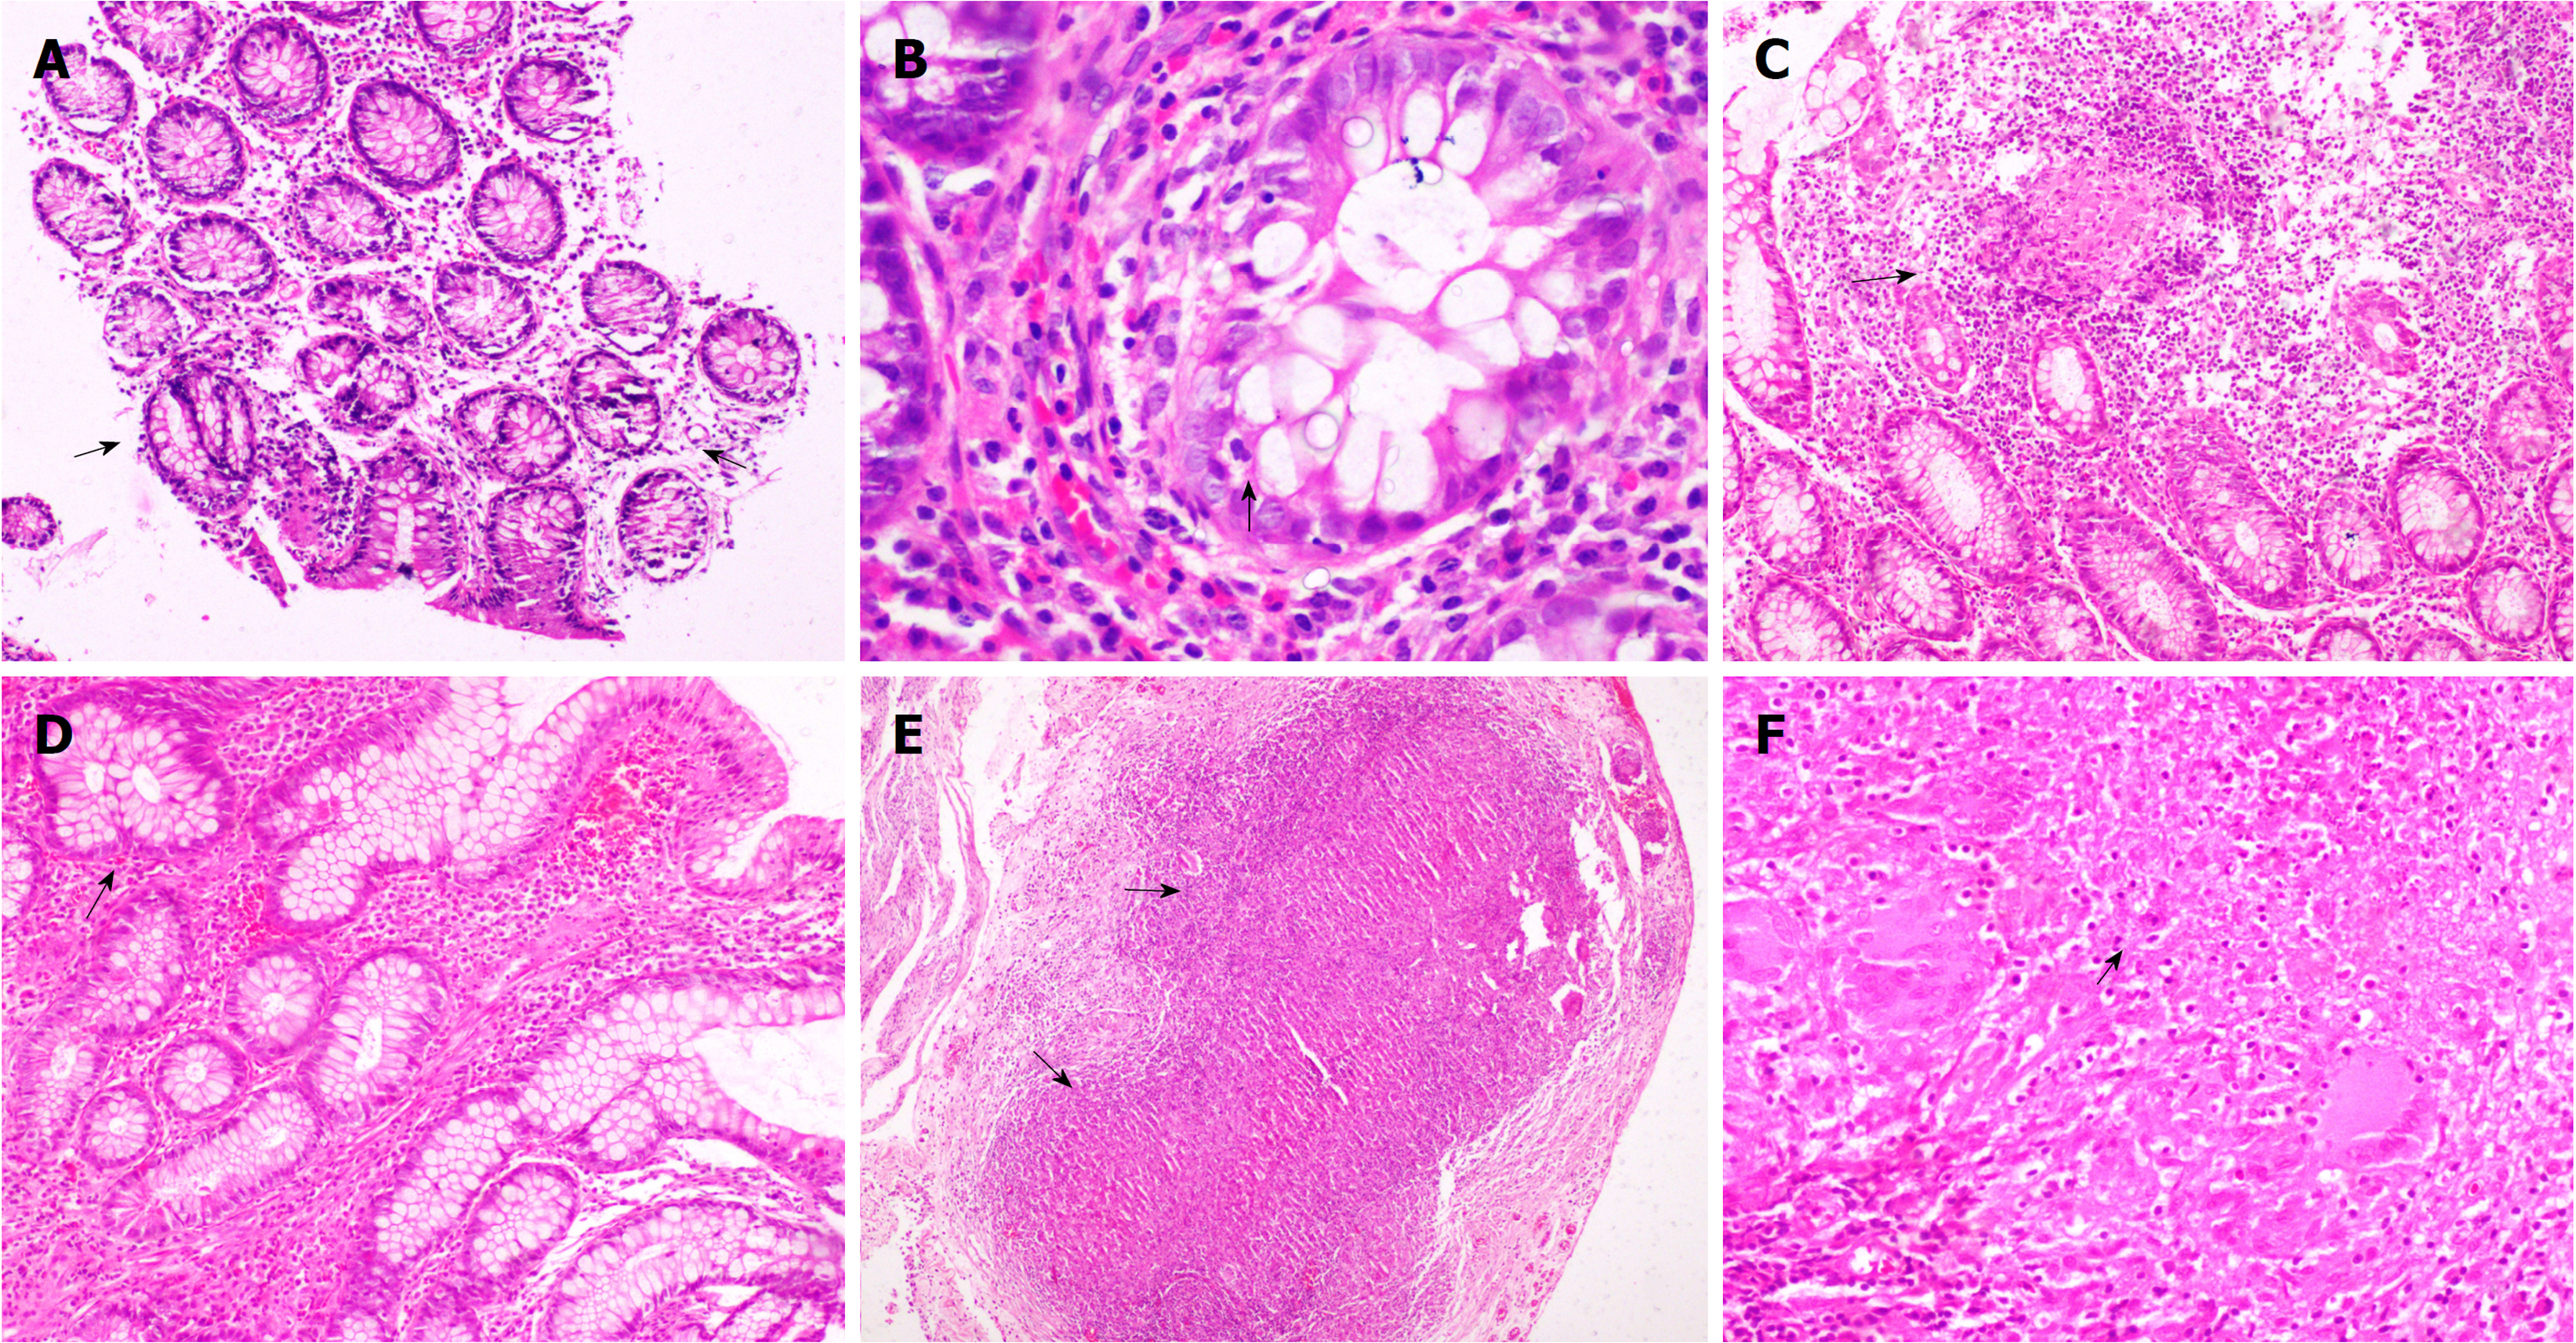
Figure 2 Colonic biopsy.
A: Patchy distortion of crypt architecture (arrows) (× 40). B: Features of focal active cryptitis are noted (arrow) (× 200). C: Colonic biopsy in a case of Crohn’s disease shows pericrypt mucosal microgranuloma (arrow) (× 40). D: Ileal biopsy in a case of ileocaecal tuberculosis shows blunting of ileal villi with crypt branching (arrow) (× 100). E: Serosal confluent necrotizing epithelioid cell granulomas (arrows) were noted (× 40). F: Photomicrograph showing an epithelioid cell granuloma with central necrosis (arrow) and Langhan’s giant cells (× 200).
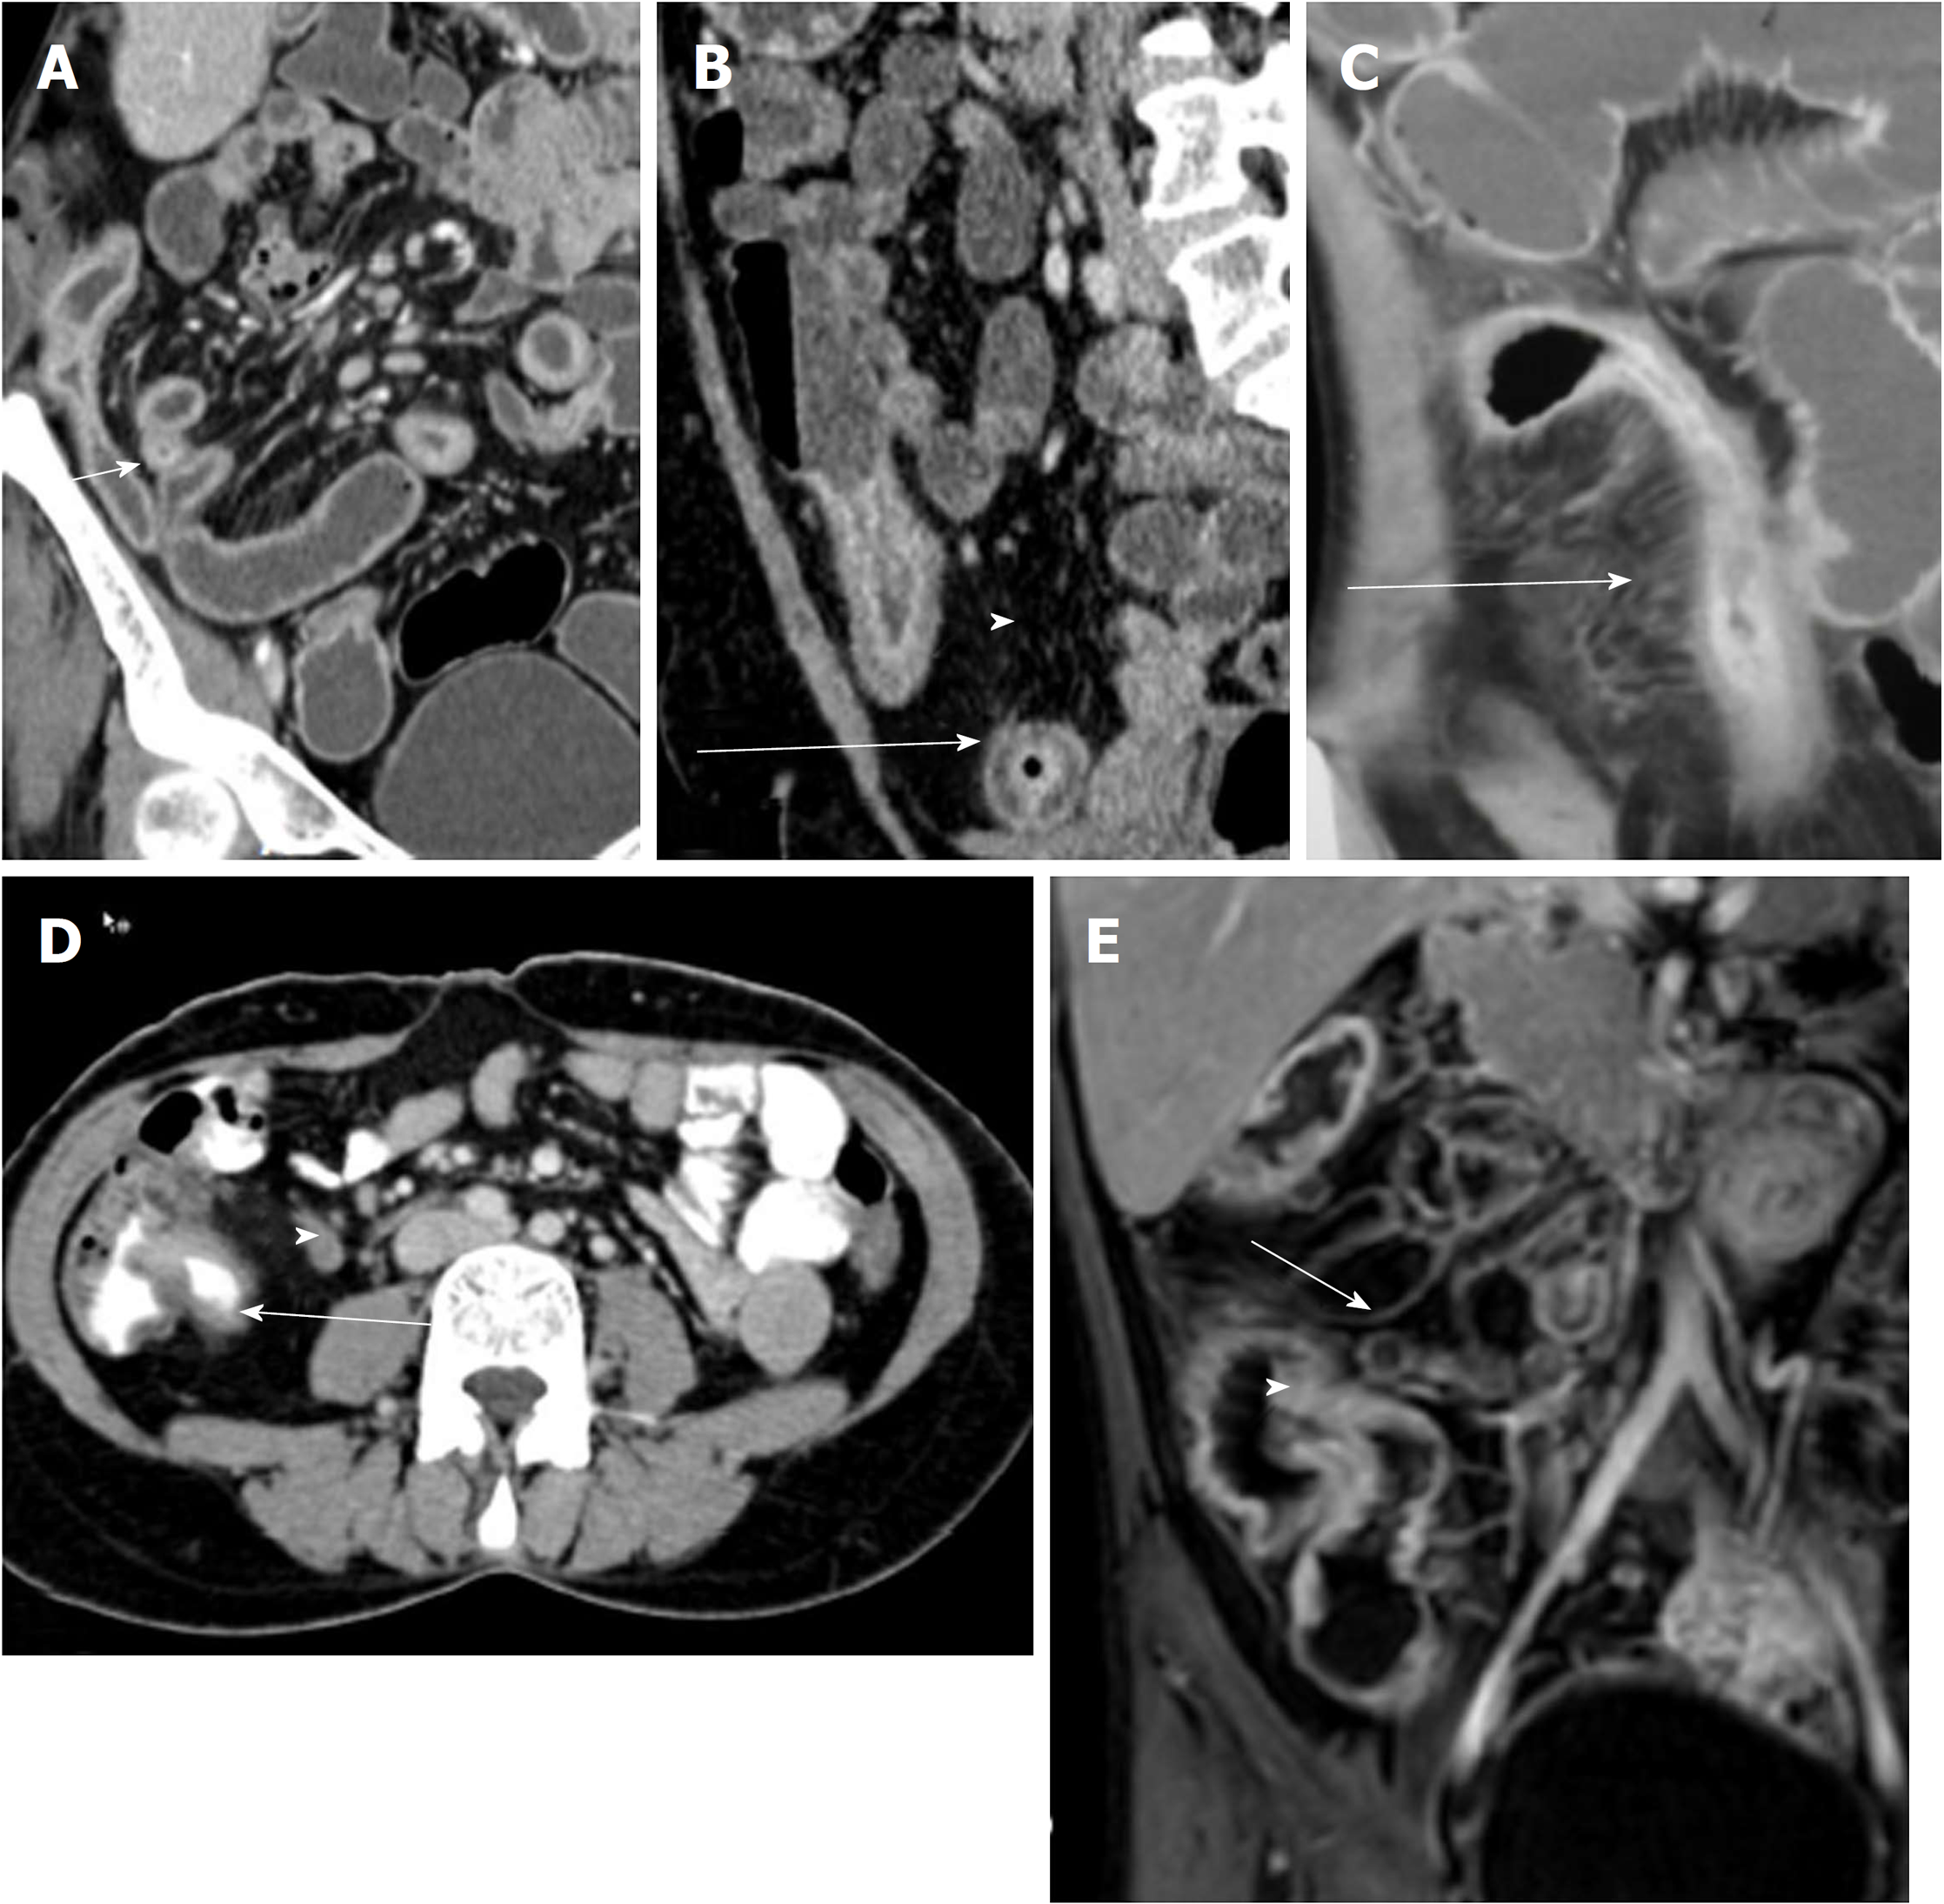
Figure 3 Coronal computed tomography images in patients with Crohn’s disease.
A: Long segment ileal thickening; B: Mural stratification (arrow) and increased visceral fat (arrowhead); C: Comb sign; D: Axial computed tomography image in a patient with intestinal tuberculosis demonstrating short segment ileocaecal thickening (arrow) with necrotic lymph node (arrowhead); and E: Coronal magnetic resonance image in a patient with intestinal tuberculosis showing ileocaecal thickening (arrowhead) and necrotic lymph node (arrow).
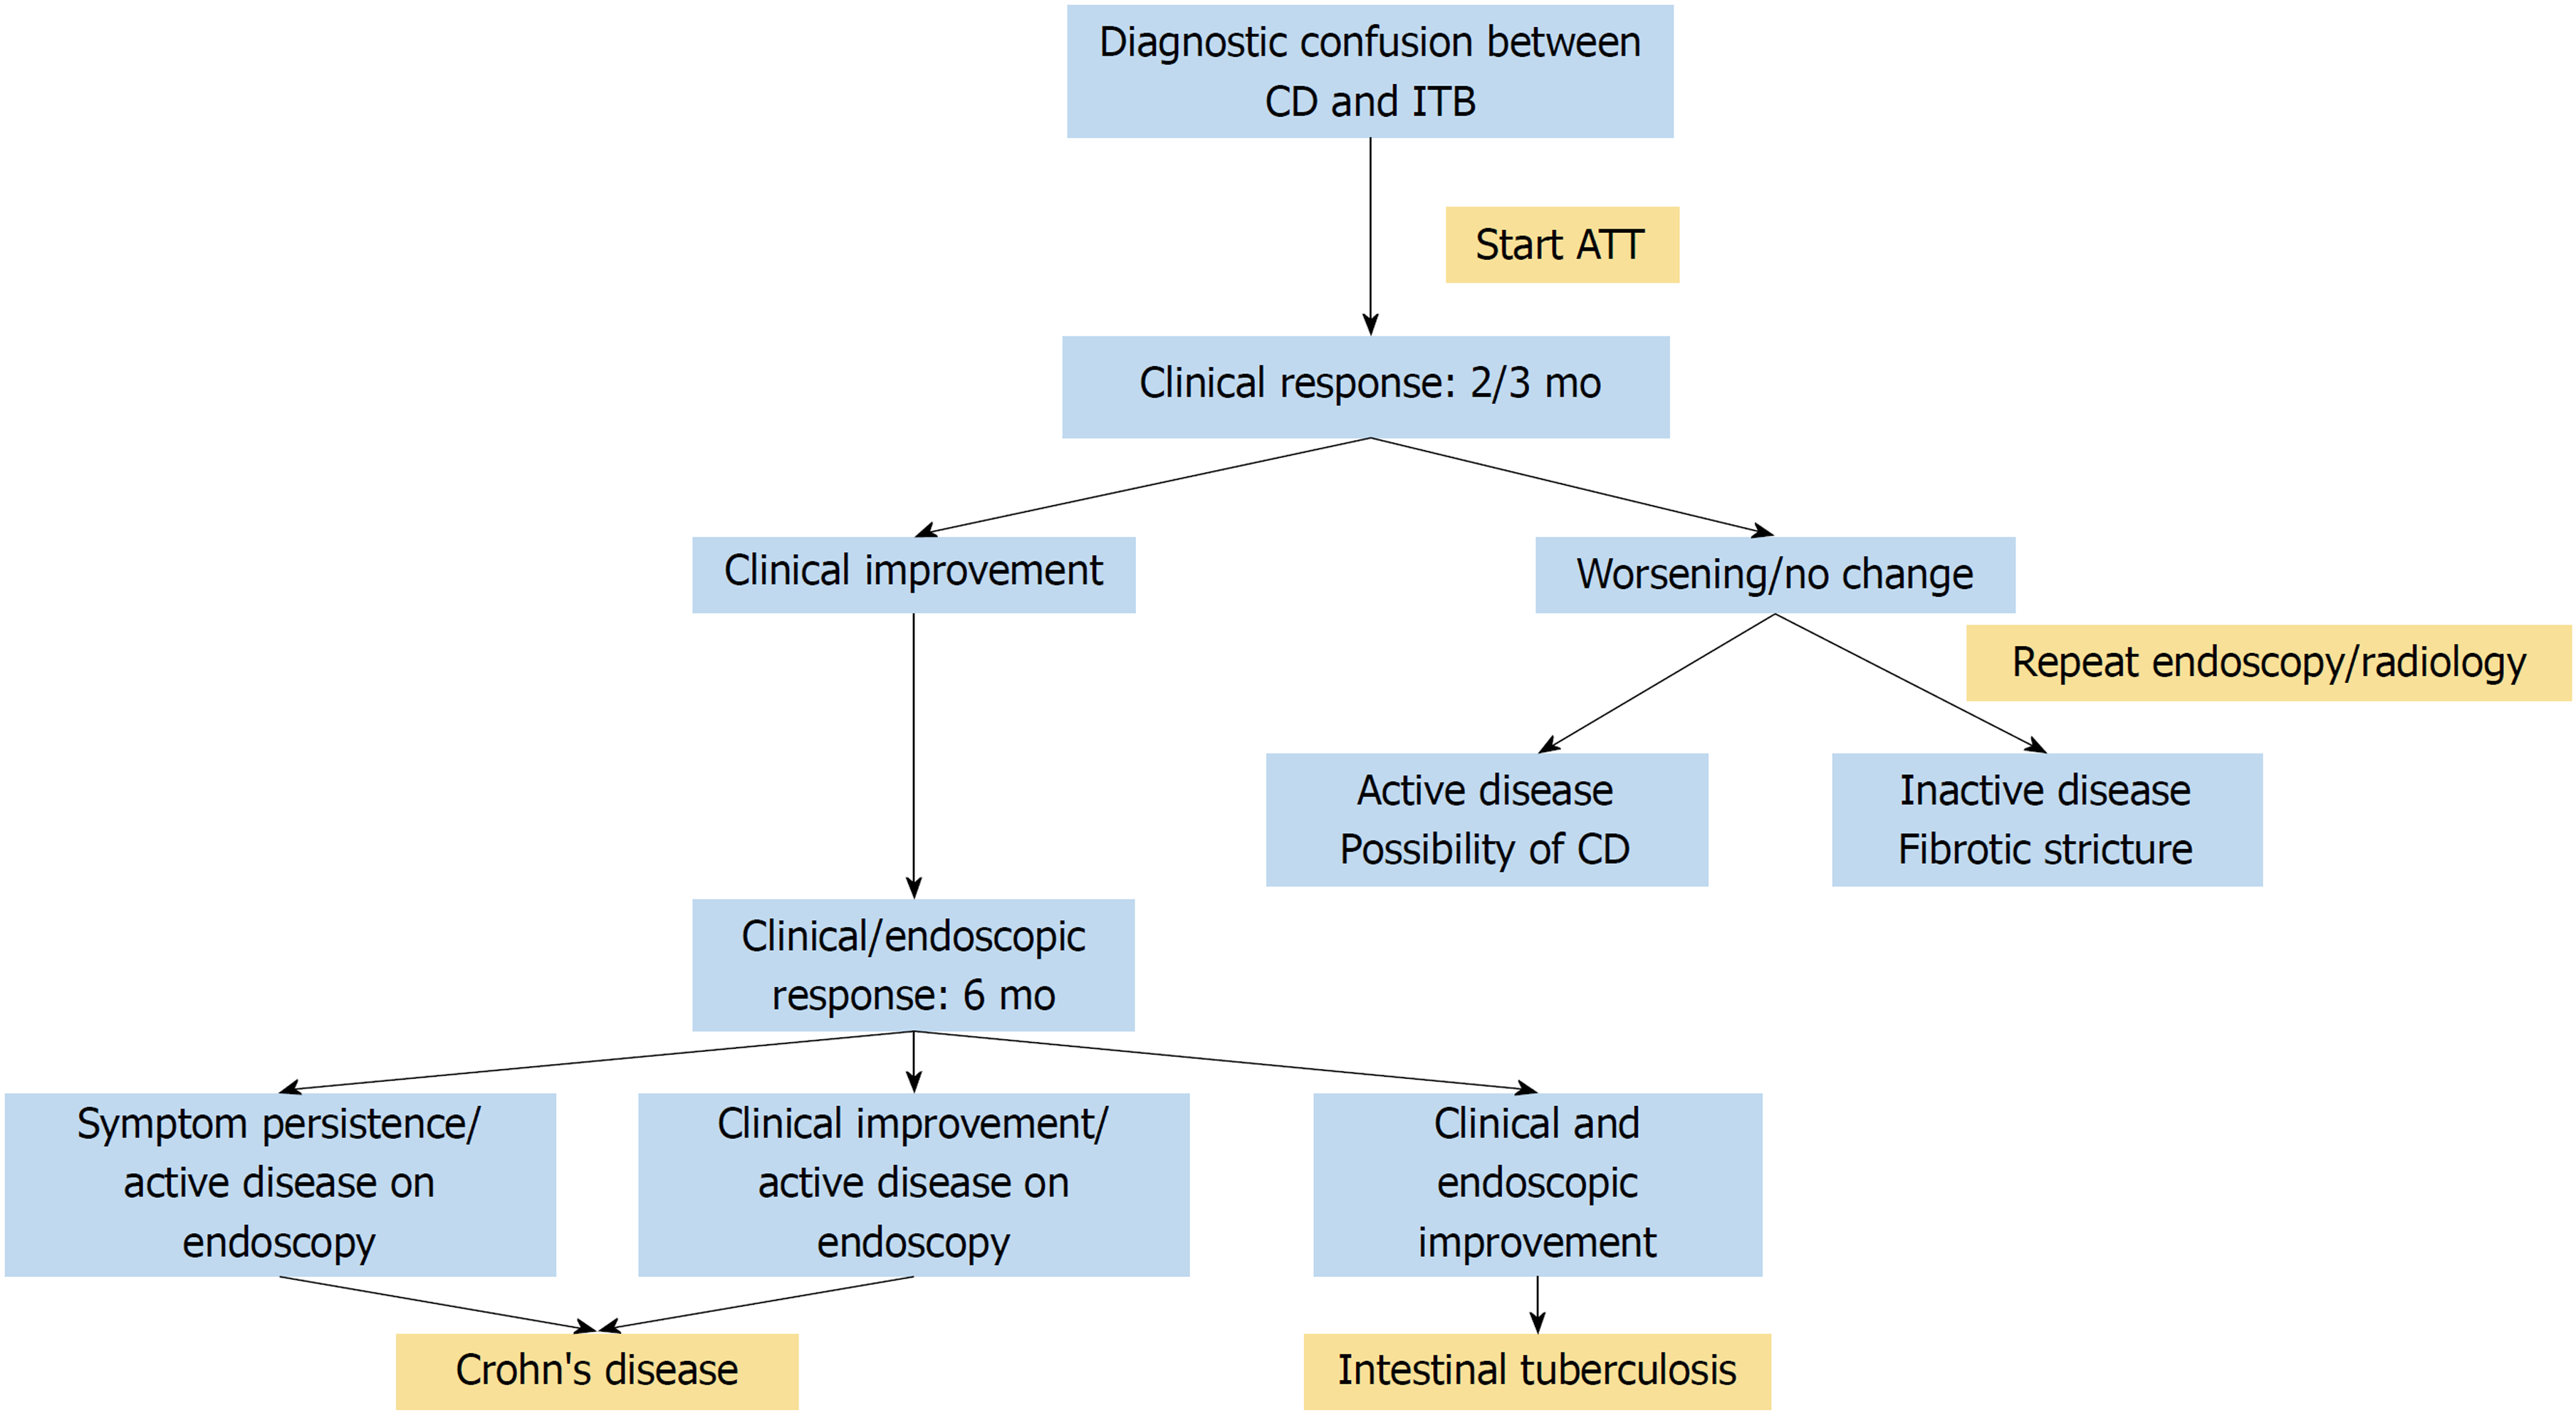
Figure 4 Algorithm for following a patient on therapeutic anti-tubercular therapy trial.
ATT: Anti-tubercular therapy; CD: Crohn’s disease; ITB: Intestinal tuberculosis.
- Citation: Kedia S, Das P, Madhusudhan KS, Dattagupta S, Sharma R, Sahni P, Makharia G, Ahuja V. Differentiating Crohn’s disease from intestinal tuberculosis. World J Gastroenterol 2019; 25(4): 418-432
- URL: https://www.wjgnet.com/1007-9327/full/v25/i4/418.htm
- DOI: https://dx.doi.org/10.3748/wjg.v25.i4.418


