Copyright
©The Author(s) 2019.
World J Gastroenterol. Oct 7, 2019; 25(37): 5667-5675
Published online Oct 7, 2019. doi: 10.3748/wjg.v25.i37.5667
Published online Oct 7, 2019. doi: 10.3748/wjg.v25.i37.5667
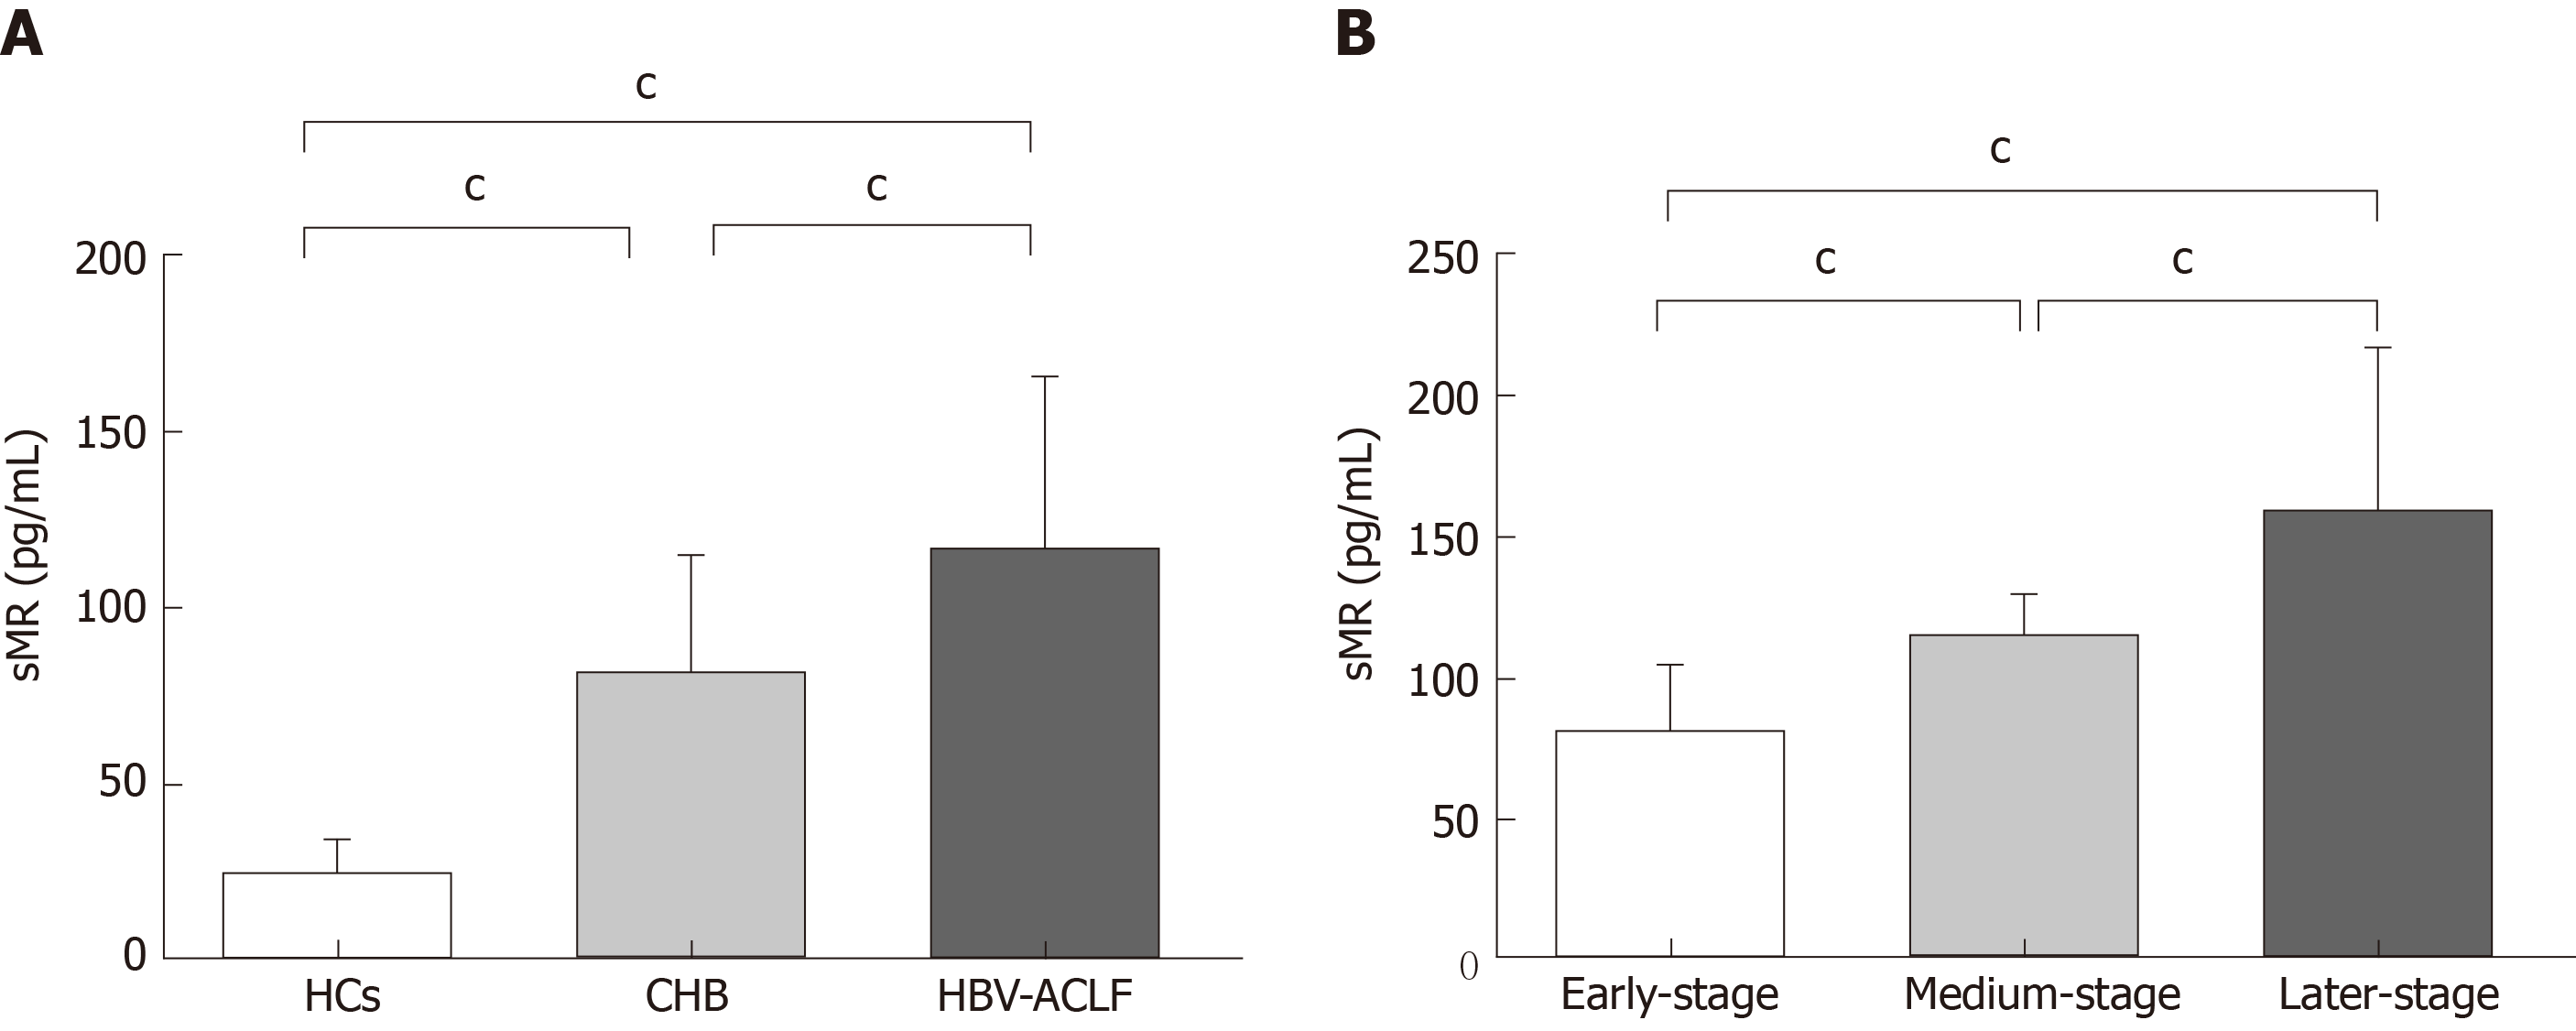
Figure 1 Serum soluble mannose receptor levels in different groups of subjects.
A: Comparison of serum sMR levels among HBV-ACLF patients, CHB patients, and HCs; B: Comparison of sMR levels among different stages of HBV-ACLF patients. cP < 0.01. sMR: Soluble mannose receptor; HCs: Healthy controls; CHB: Chronic hepatitis B; HBV: Hepatitis B virus; ACLF: Acute-on-chronic liver failure.
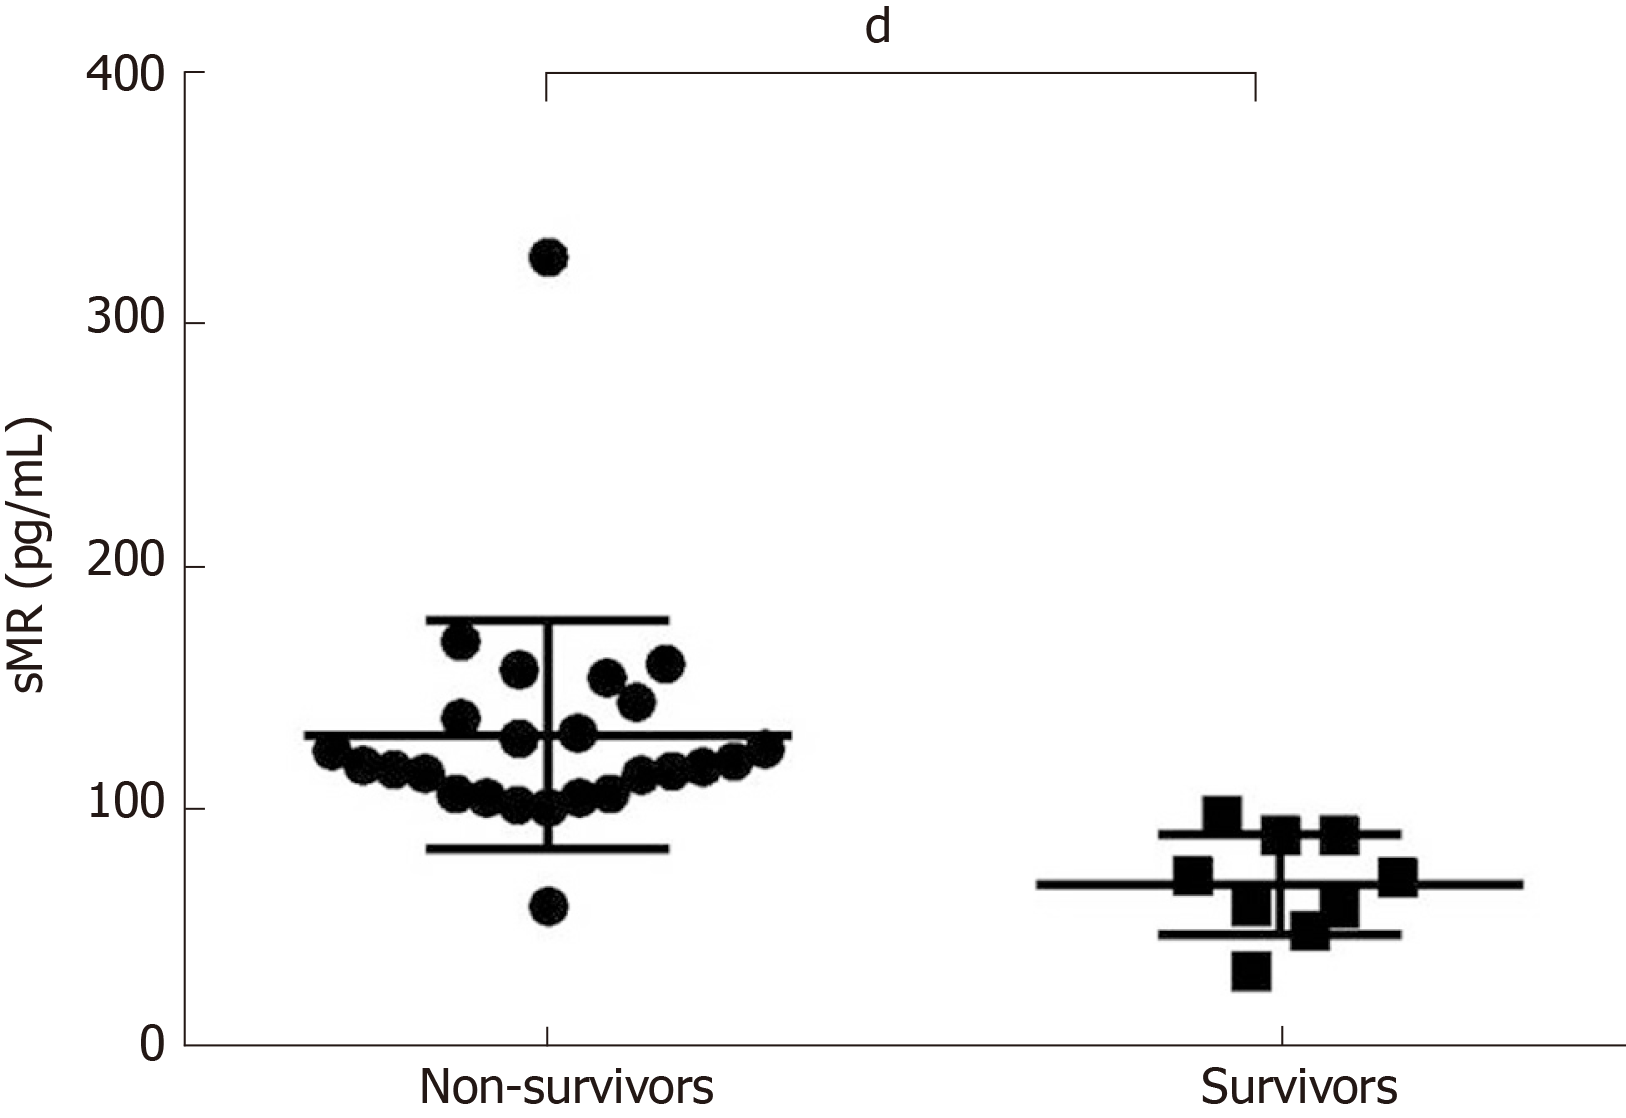
Figure 2 Comparison of soluble mannose receptor levels between non-survivors and survivors.
Serum sMR level in the non-survivor group was significantly higher than that of the survivor group. dP < 0.05. sMR: Soluble mannose receptor.
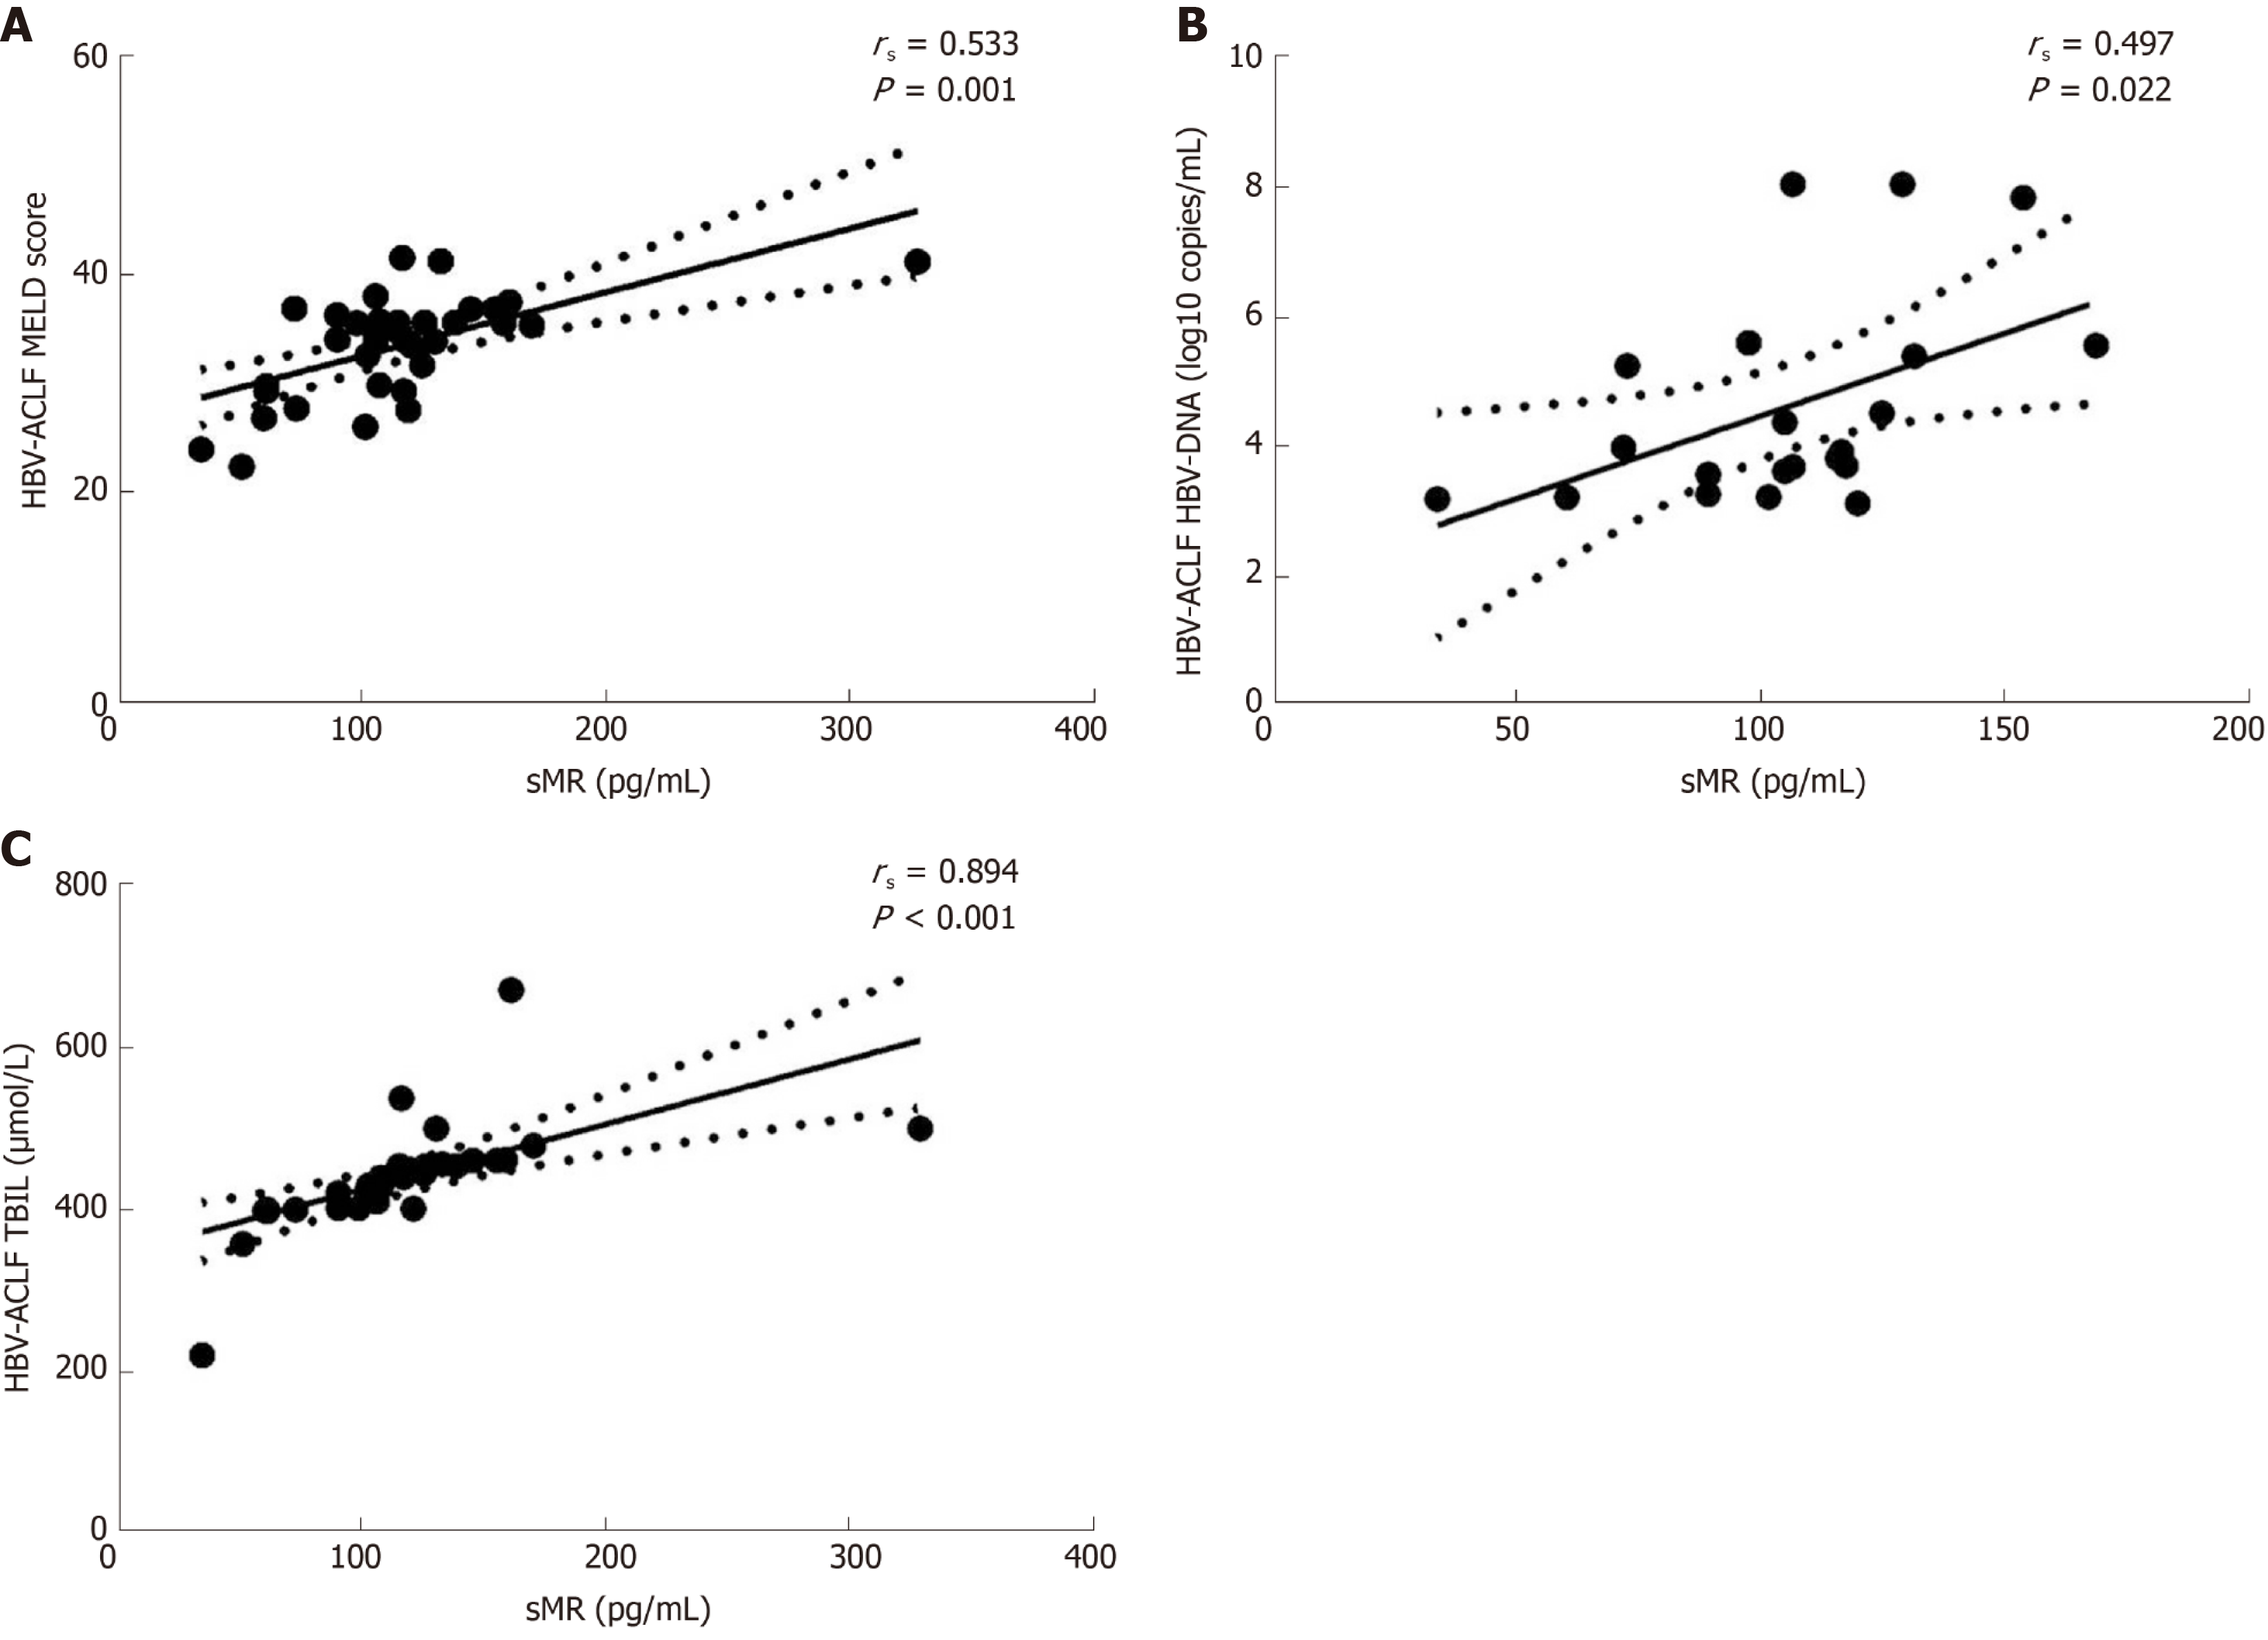
Figure 3 Correlations between serum soluble mannose receptor level and liver injury parameters.
rs: Spearman correlation coefficient; sMR: Soluble mannose receptor; HBV: Hepatitis B virus; ACLF: Acute-on-chronic liver failure; MELD: Model for end-stage liver disease; TBIL: Total bilirubin.
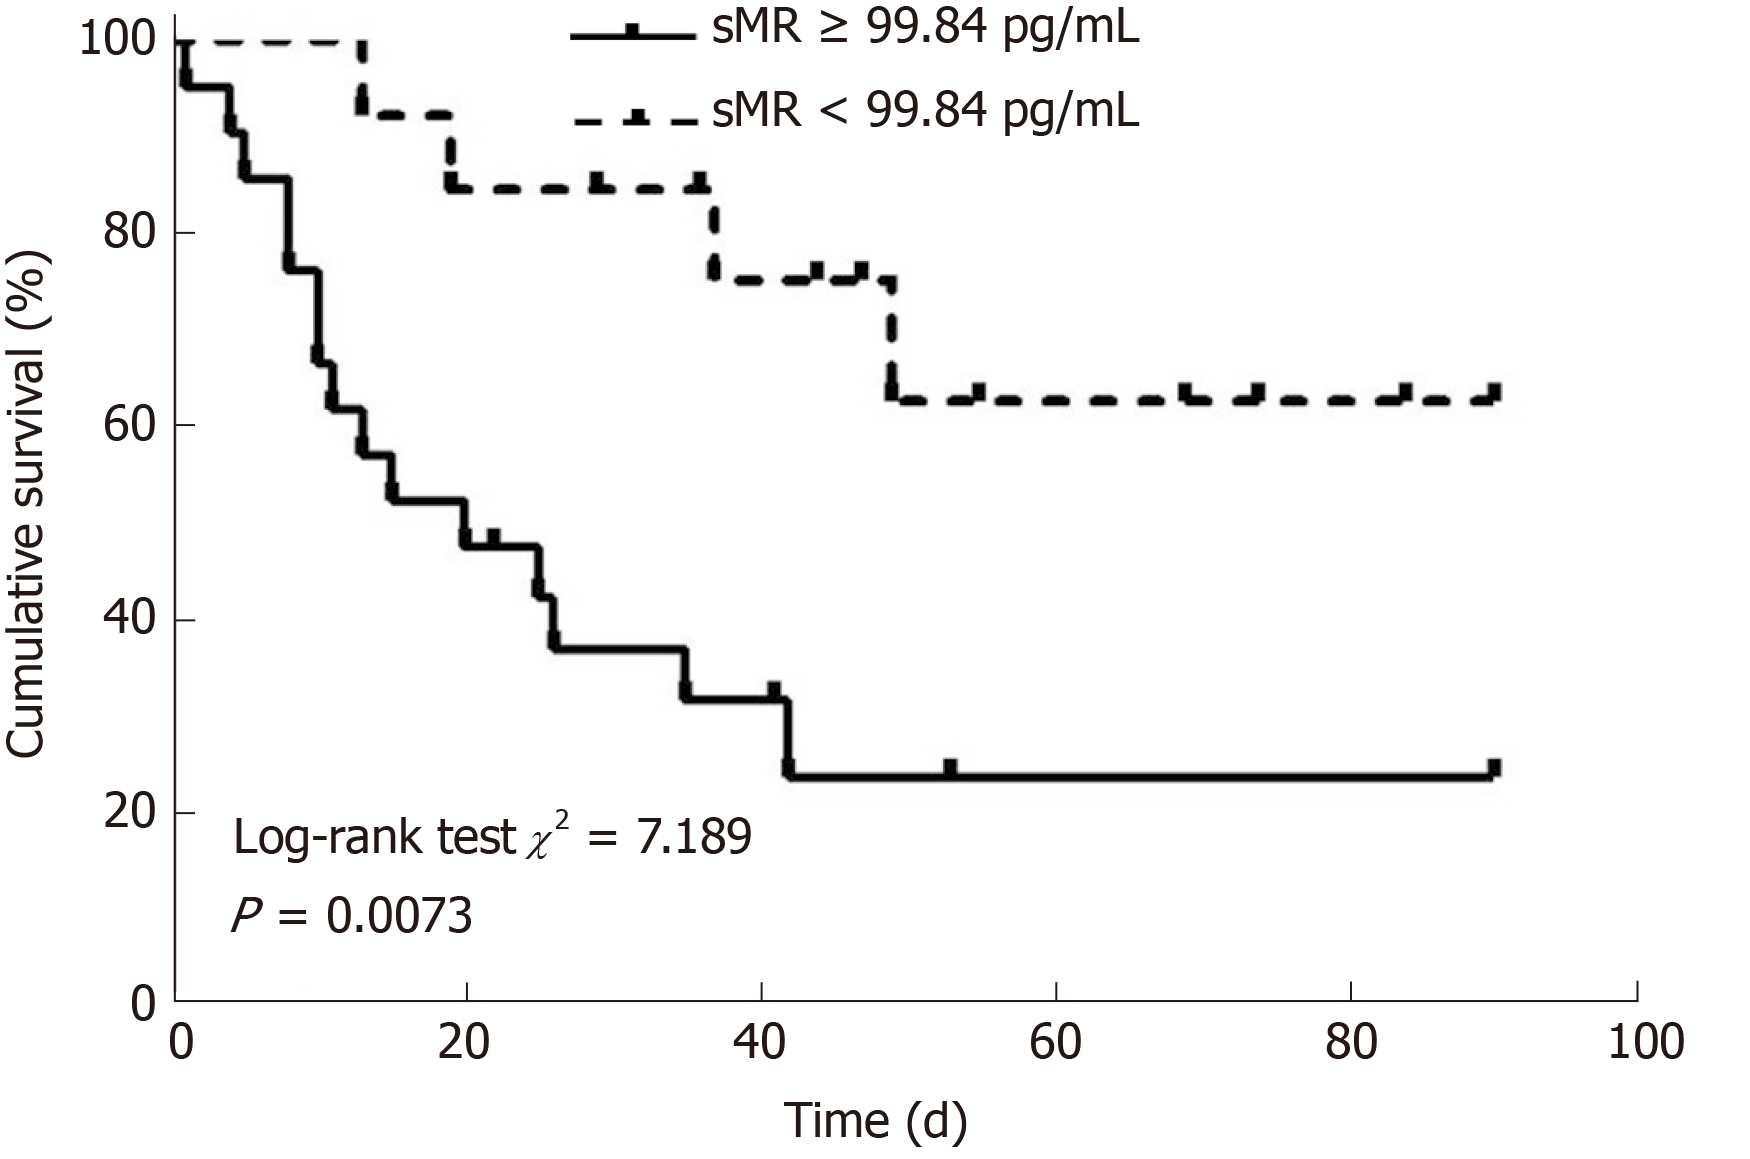
Figure 4 Kaplan-Meier survival curves of soluble mannose receptor levels for predicting 90-day mortality.
sMR: Soluble mannose receptor.
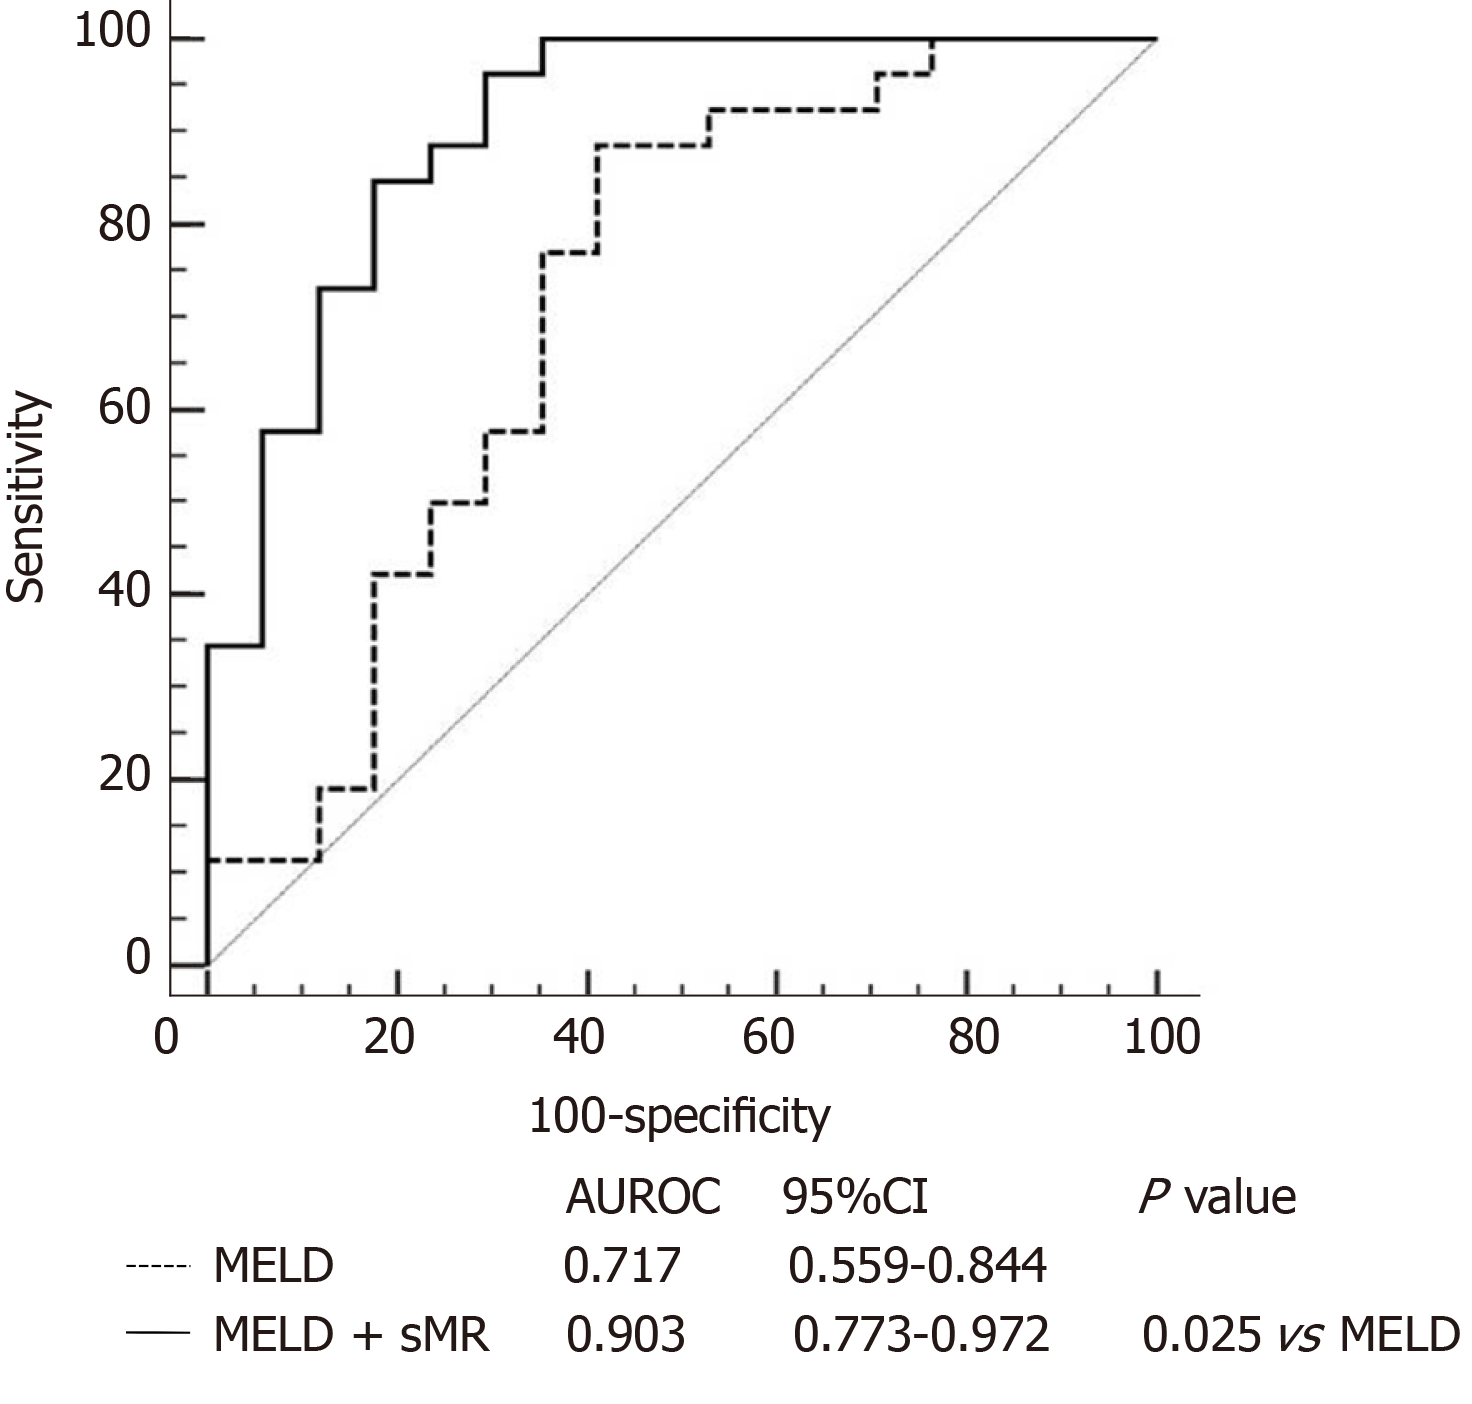
Figure 5 Areas under the receiver operating characteristics curves of model for end-stage liver disease score alone and model for end-stage liver disease score plus serum soluble mannose receptor.
AUROC: Area under the receiver operating characteristics curve; CI: Confidence interval; MELD: Model for end-stage liver disease; sMR: Soluble mannose receptor.
- Citation: Li TP, Guan SH, Wang Q, Chen LW, Yang K, Zhang H. Soluble mannose receptor as a predictor of prognosis of hepatitis B virus-related acute-on-chronic liver failure. World J Gastroenterol 2019; 25(37): 5667-5675
- URL: https://www.wjgnet.com/1007-9327/full/v25/i37/5667.htm
- DOI: https://dx.doi.org/10.3748/wjg.v25.i37.5667


