Copyright
©The Author(s) 2019.
World J Gastroenterol. Sep 21, 2019; 25(35): 5376-5387
Published online Sep 21, 2019. doi: 10.3748/wjg.v25.i35.5376
Published online Sep 21, 2019. doi: 10.3748/wjg.v25.i35.5376
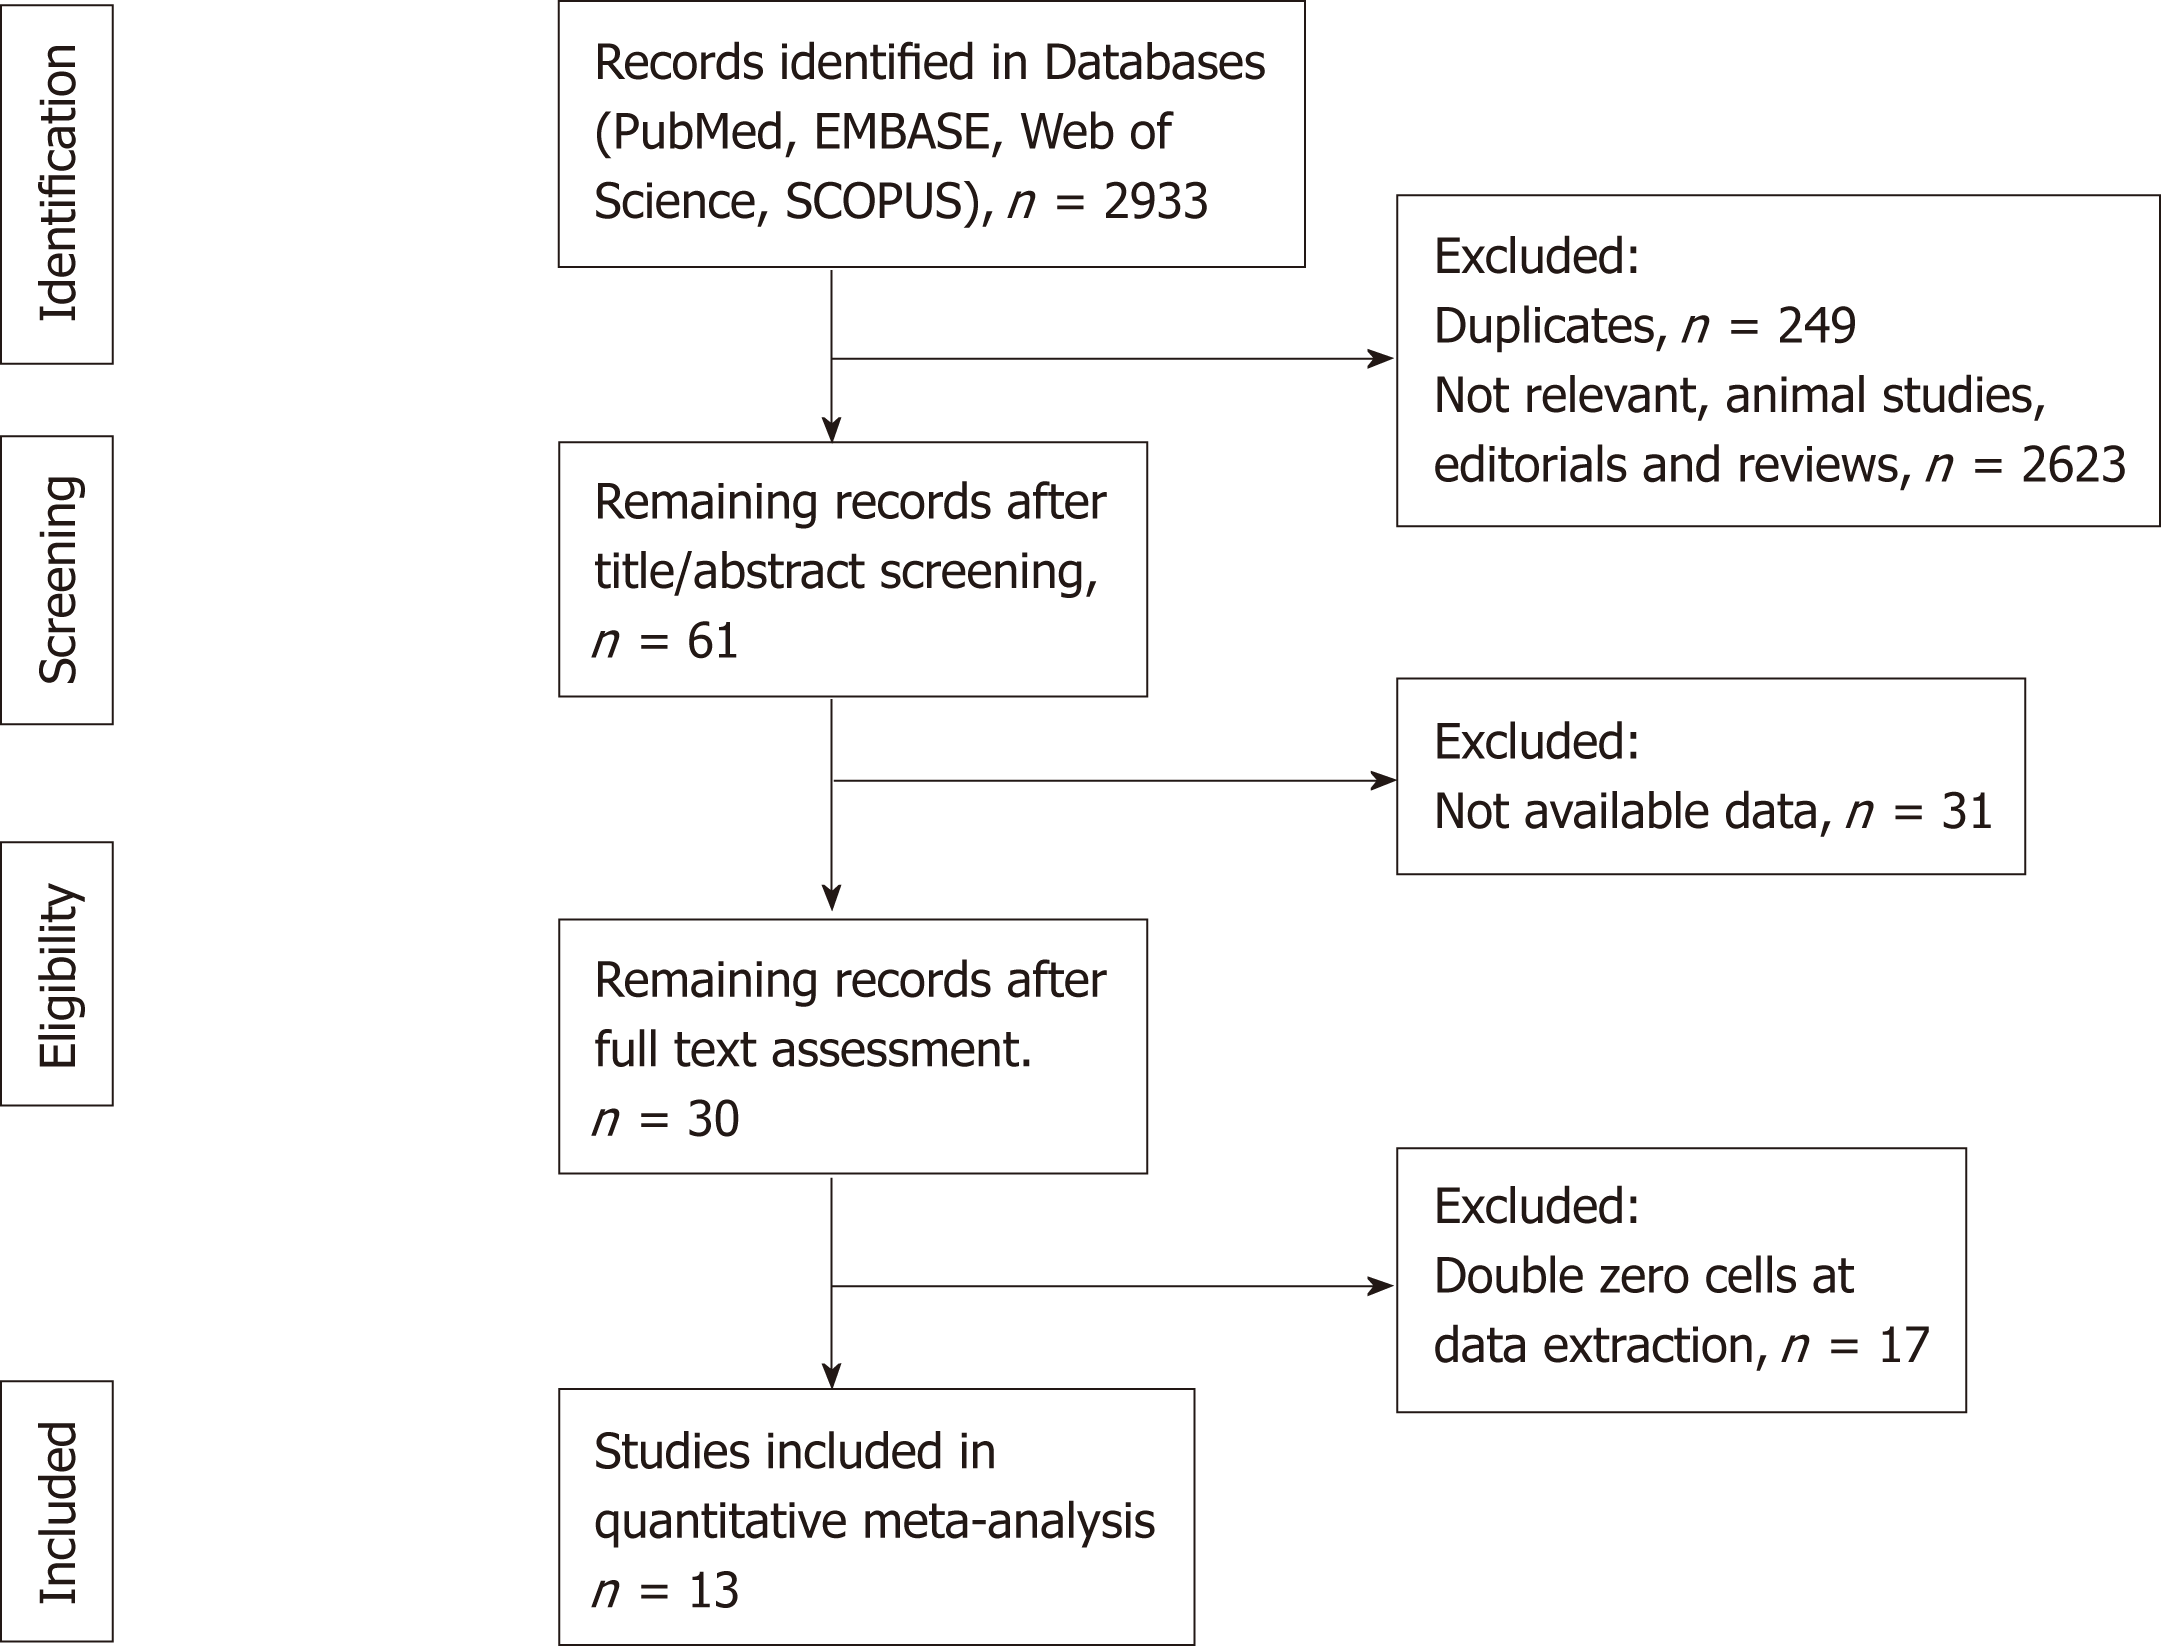
Figure 1 PRISMA flow diagram of the quantitative meta-analysis.
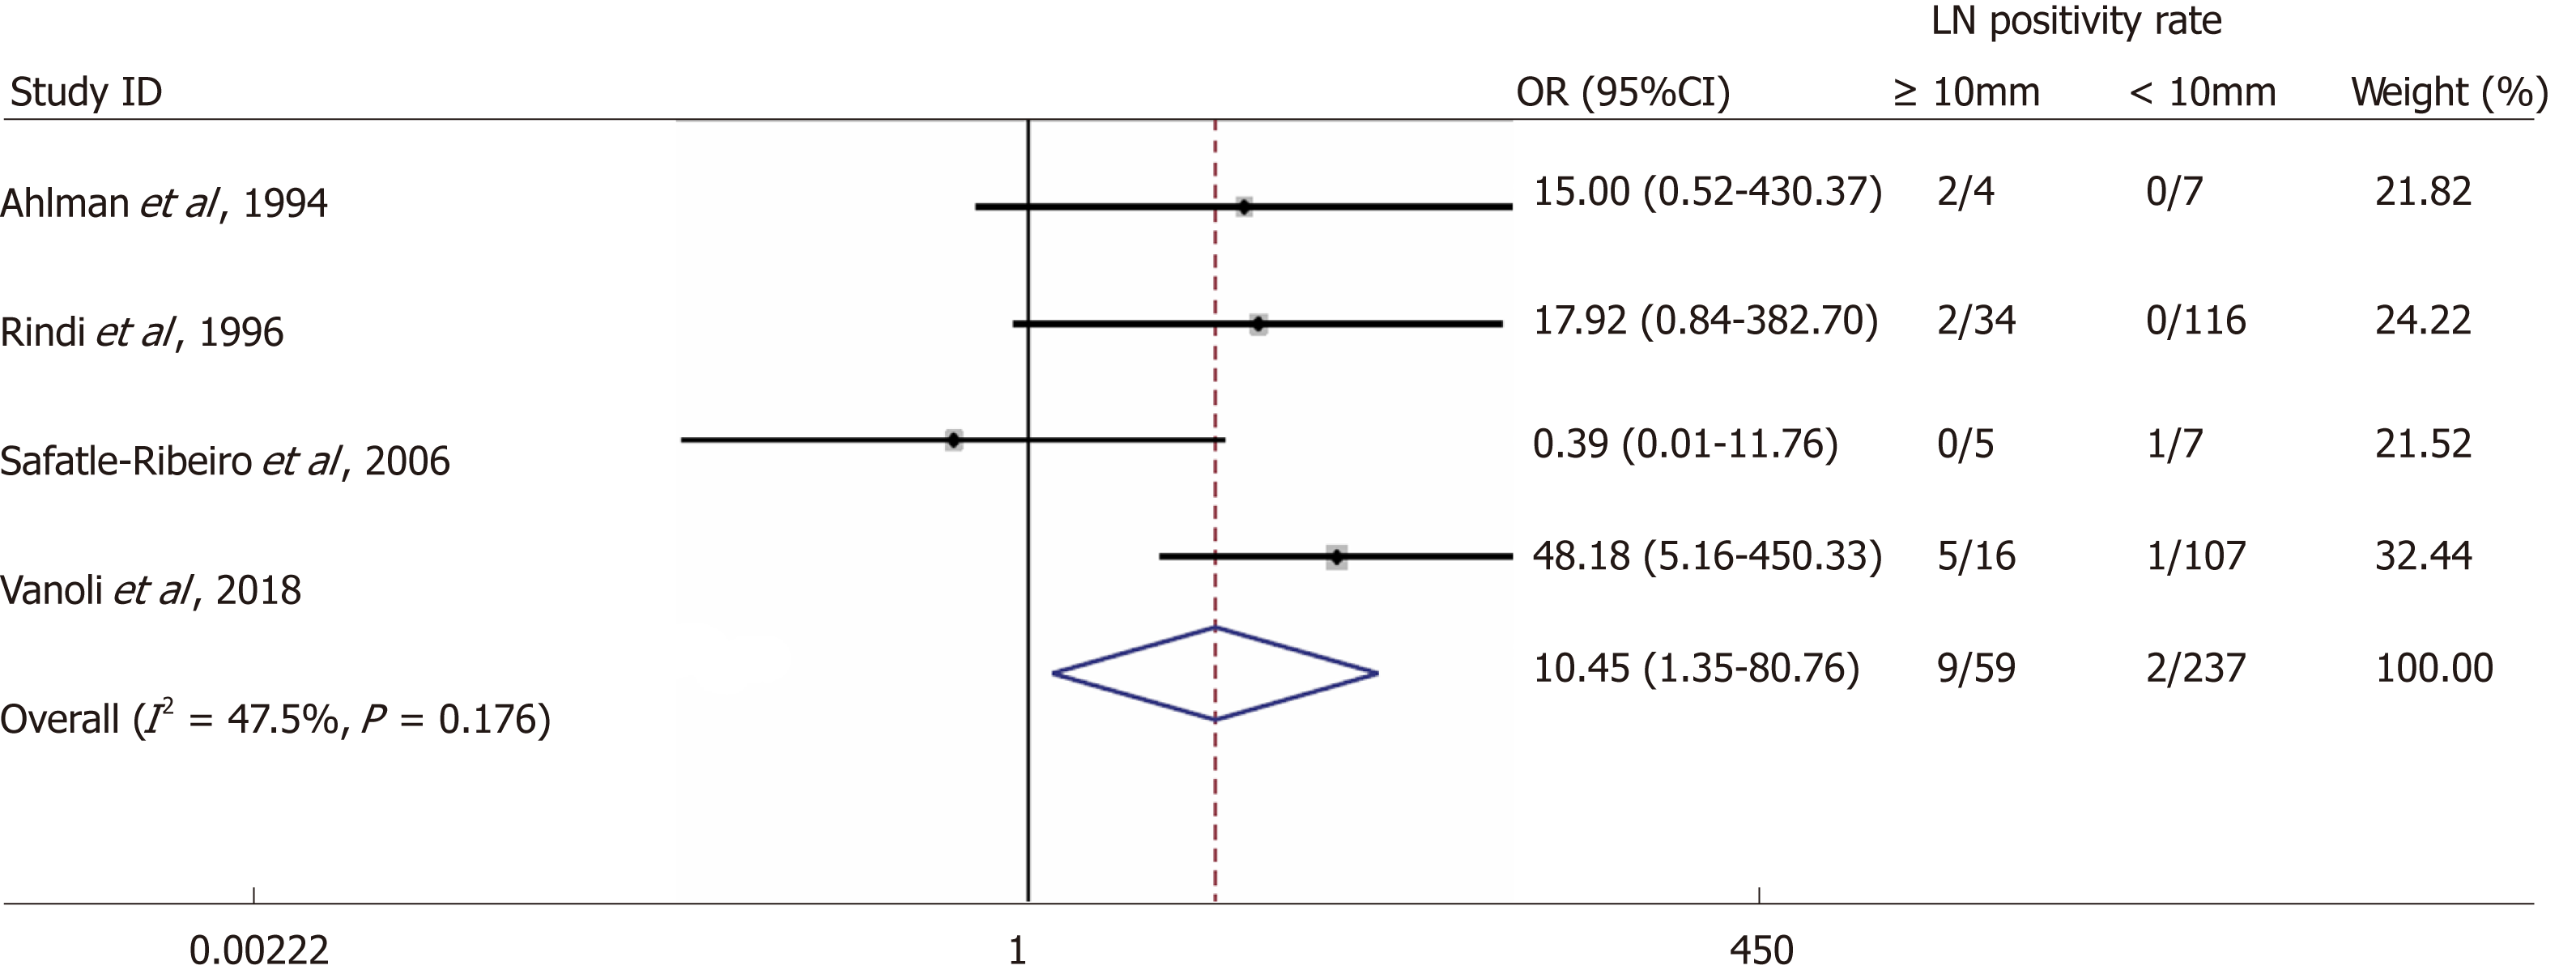
Figure 2 Forest plot comparing the rate of lymph node metastases at a 10 mm size cut-off, i.
e., in tumour size ≥ 10 mm vs tumour size < 10 mm. Meta-analysis of all studies carried out using a random-effects model; Odds ratios are shown with 95%CI.
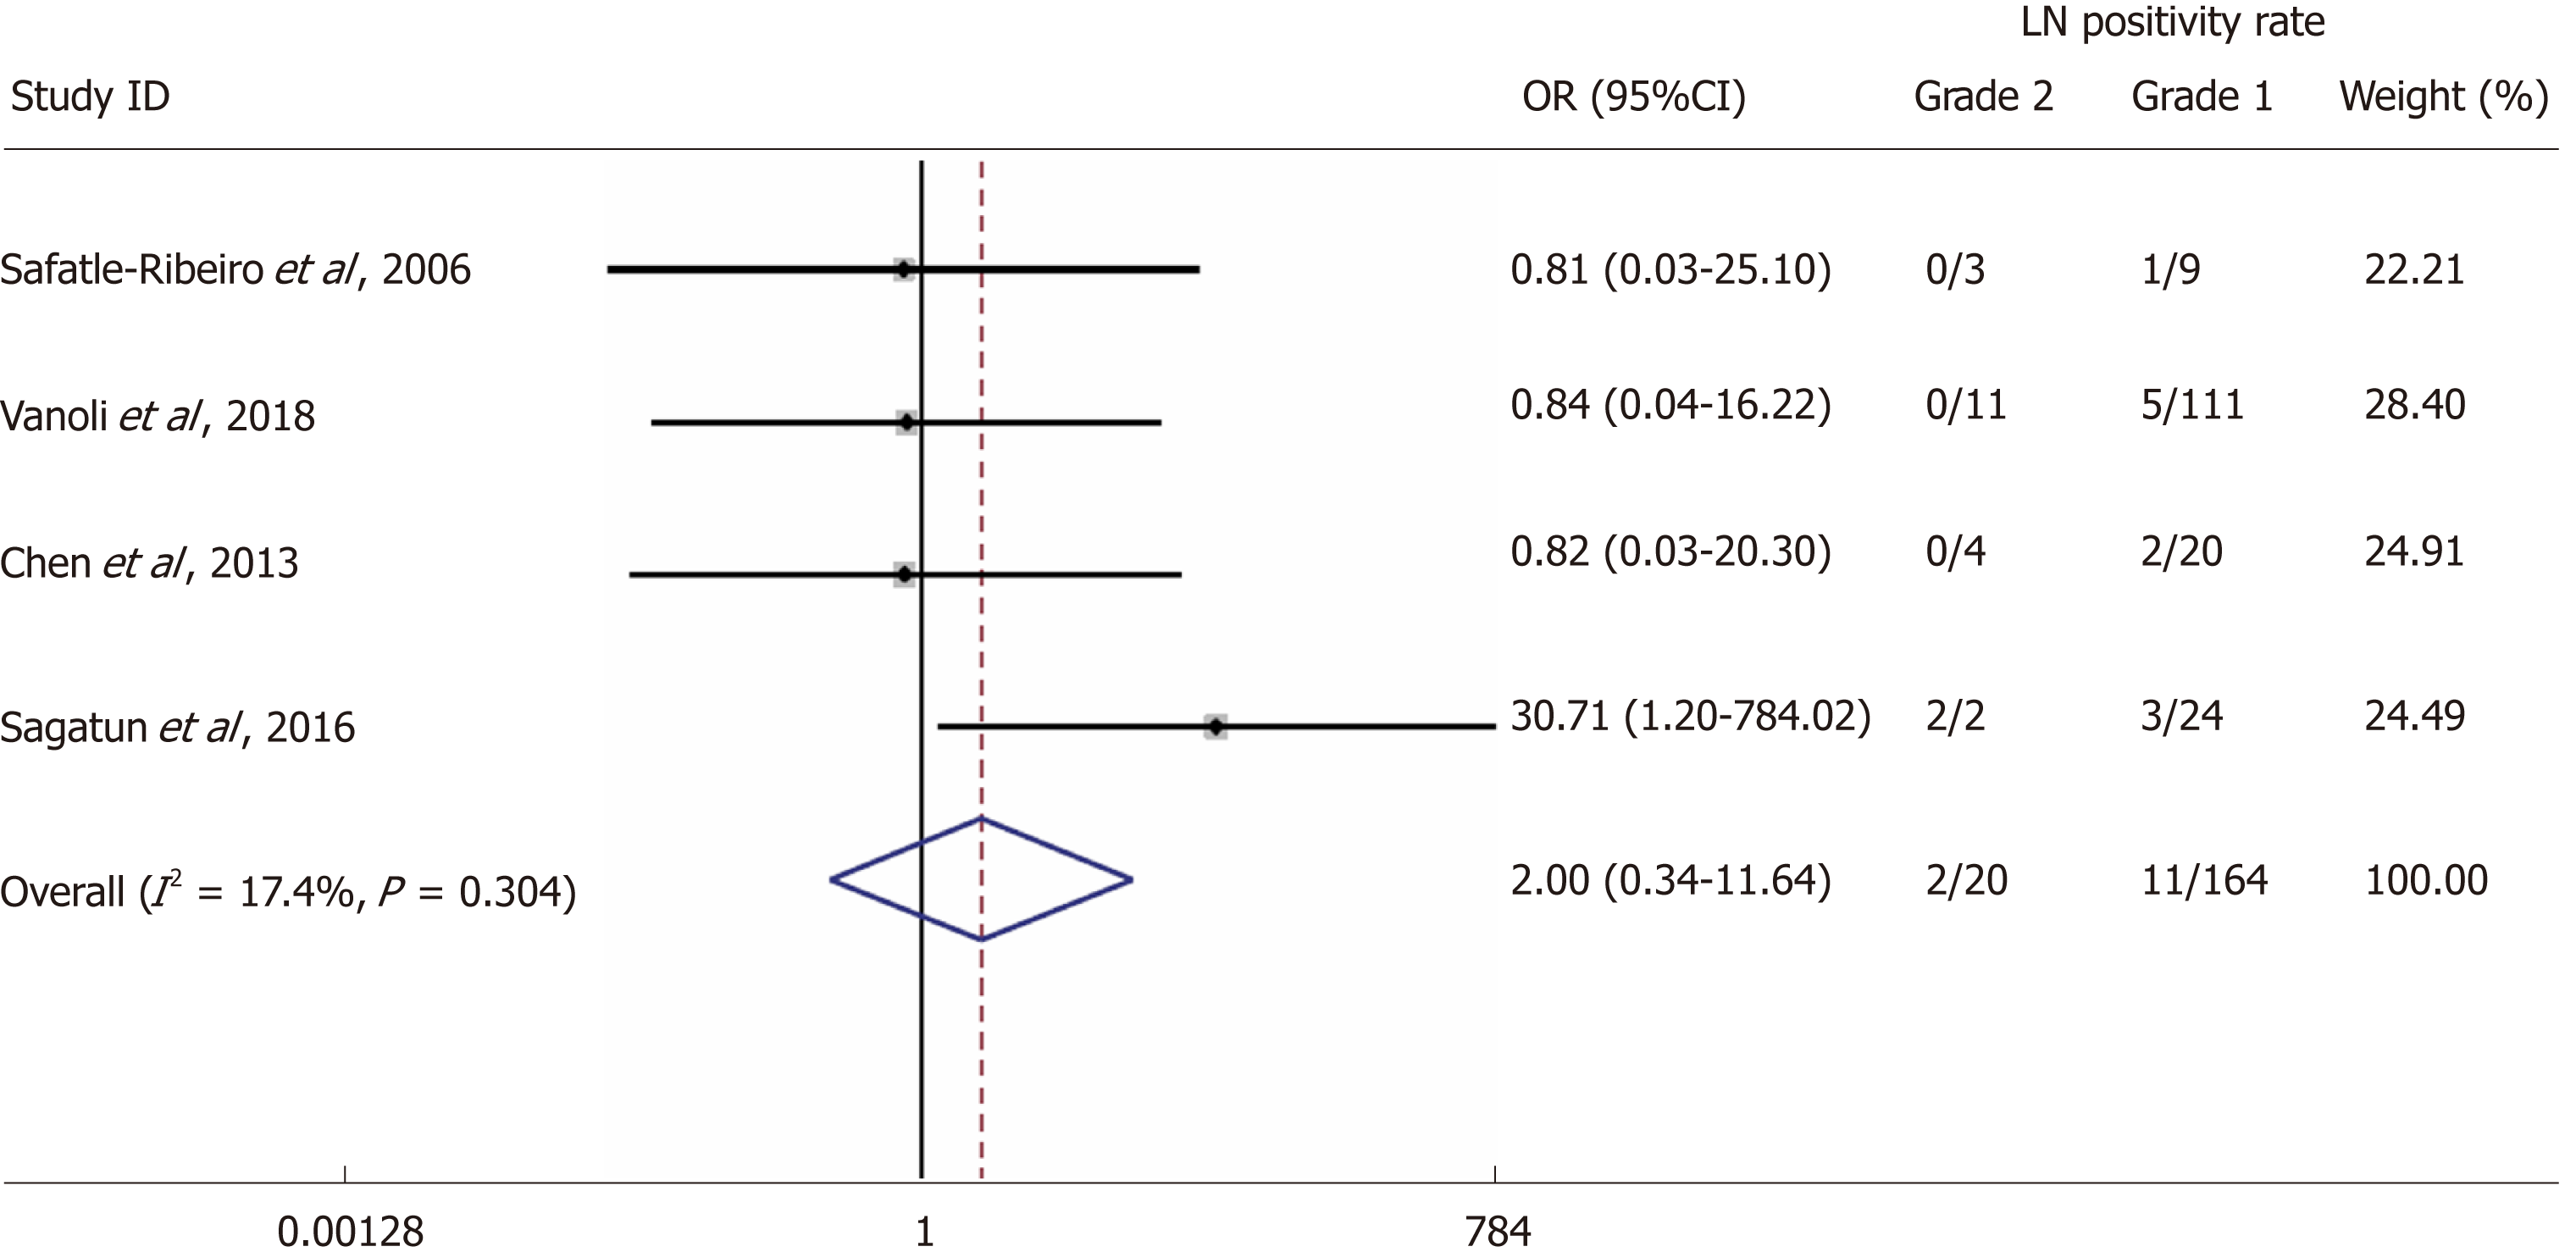
Figure 3 Forest plot comparing the rate of lymph node metastases in patients with grade 1 vs grade 2 gastric neuroendocrine neoplasms type 1.
Meta-analysis of all studies carried out using a random-effects model; Odds ratios are shown with 95%CI.
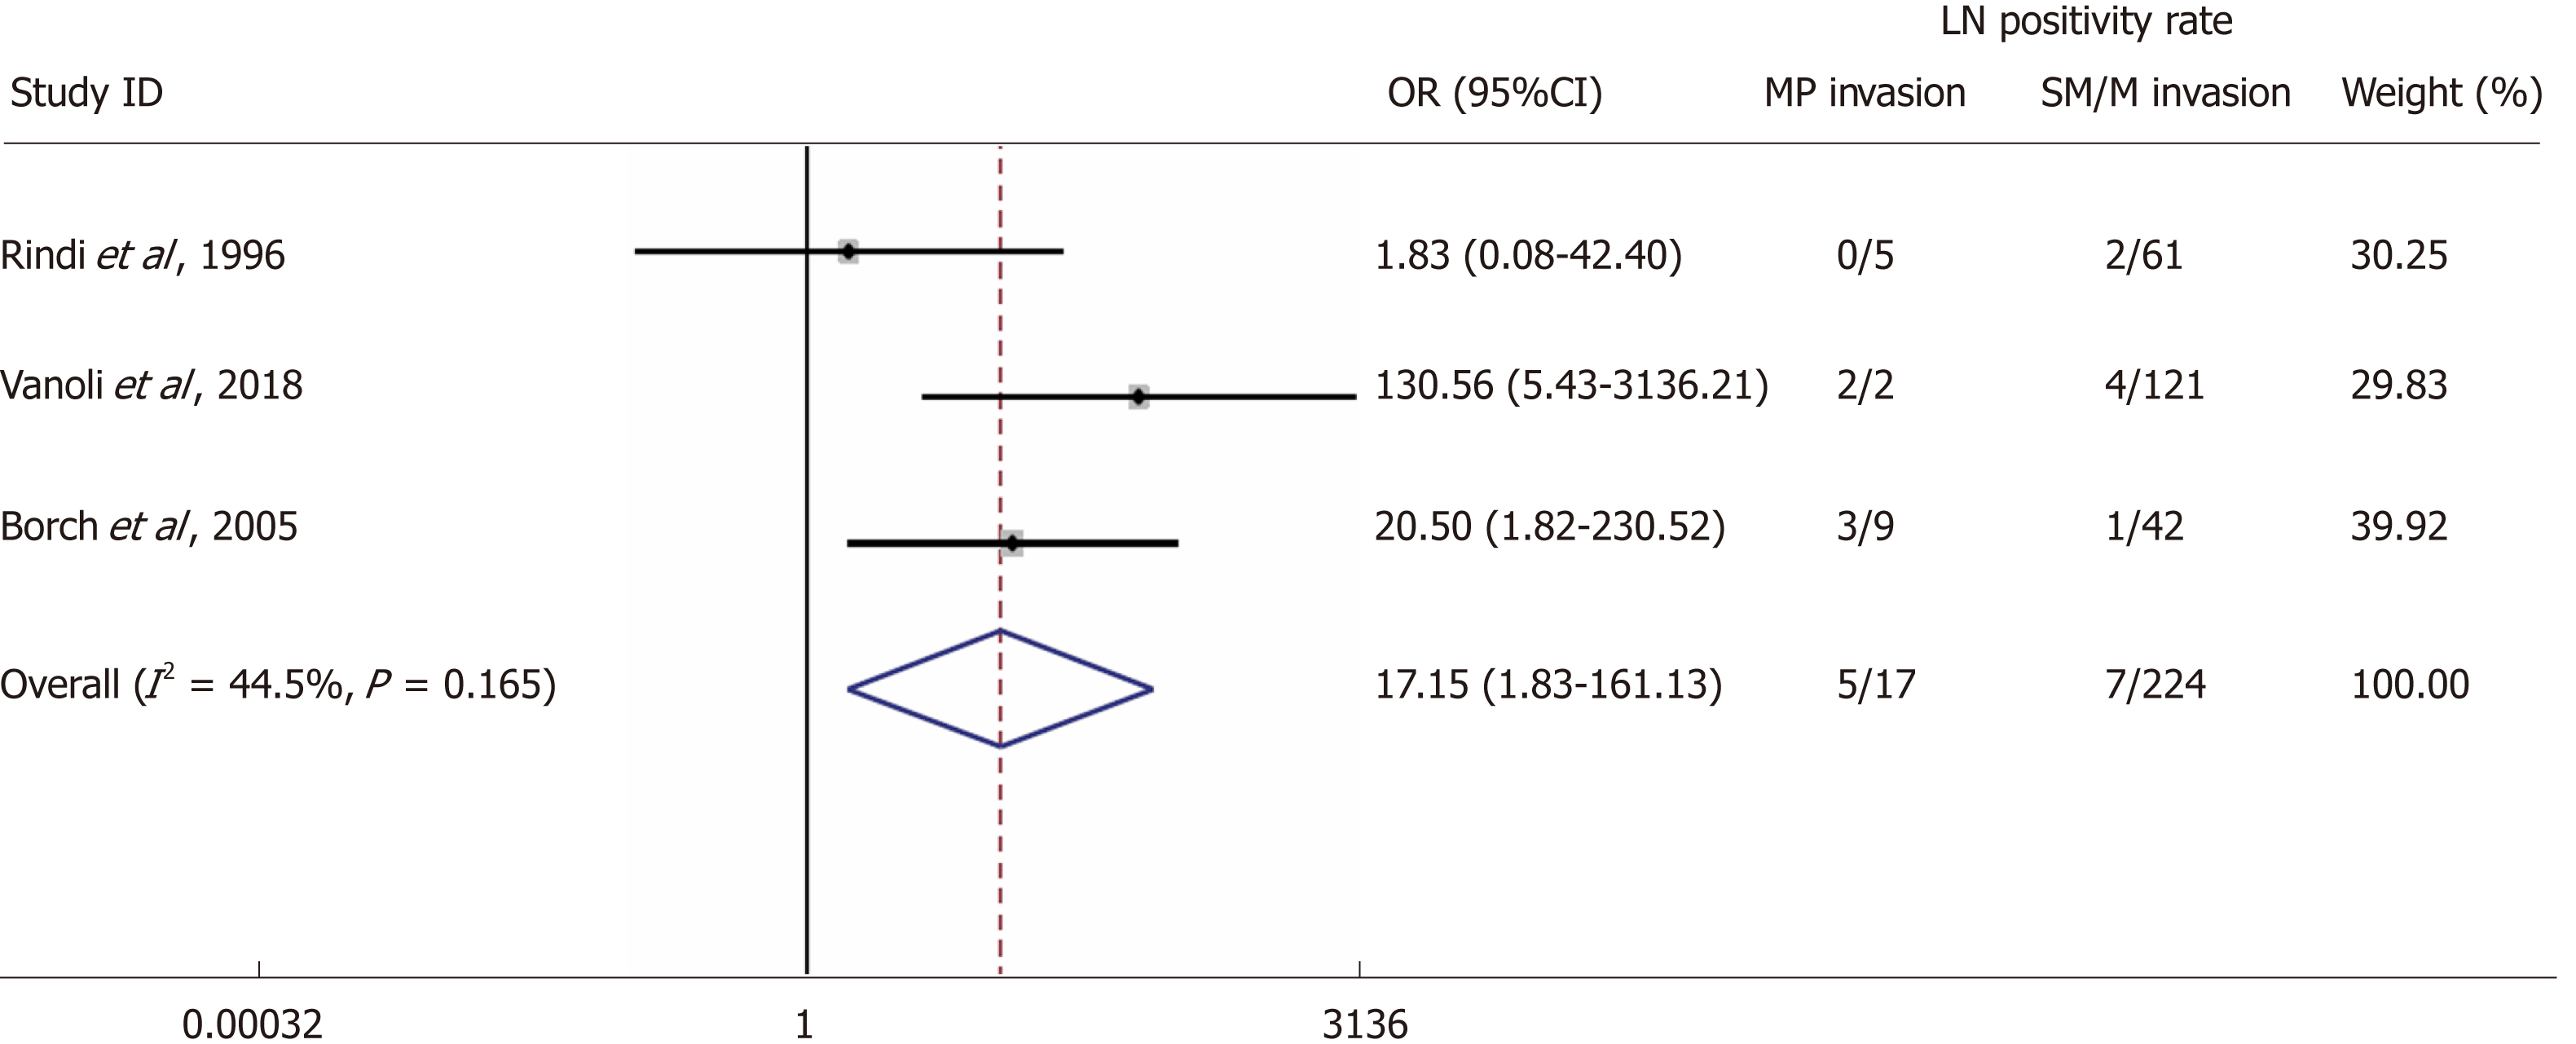
Figure 4 Forest plot comparing the rate of lymph node metastases in tumours with mucosal/submucosal invasion vs tumours with invasion of the muscularis propria.
Meta-analysis of all studies carried out using a random-effects model; Odds ratios are shown with 95%CI.
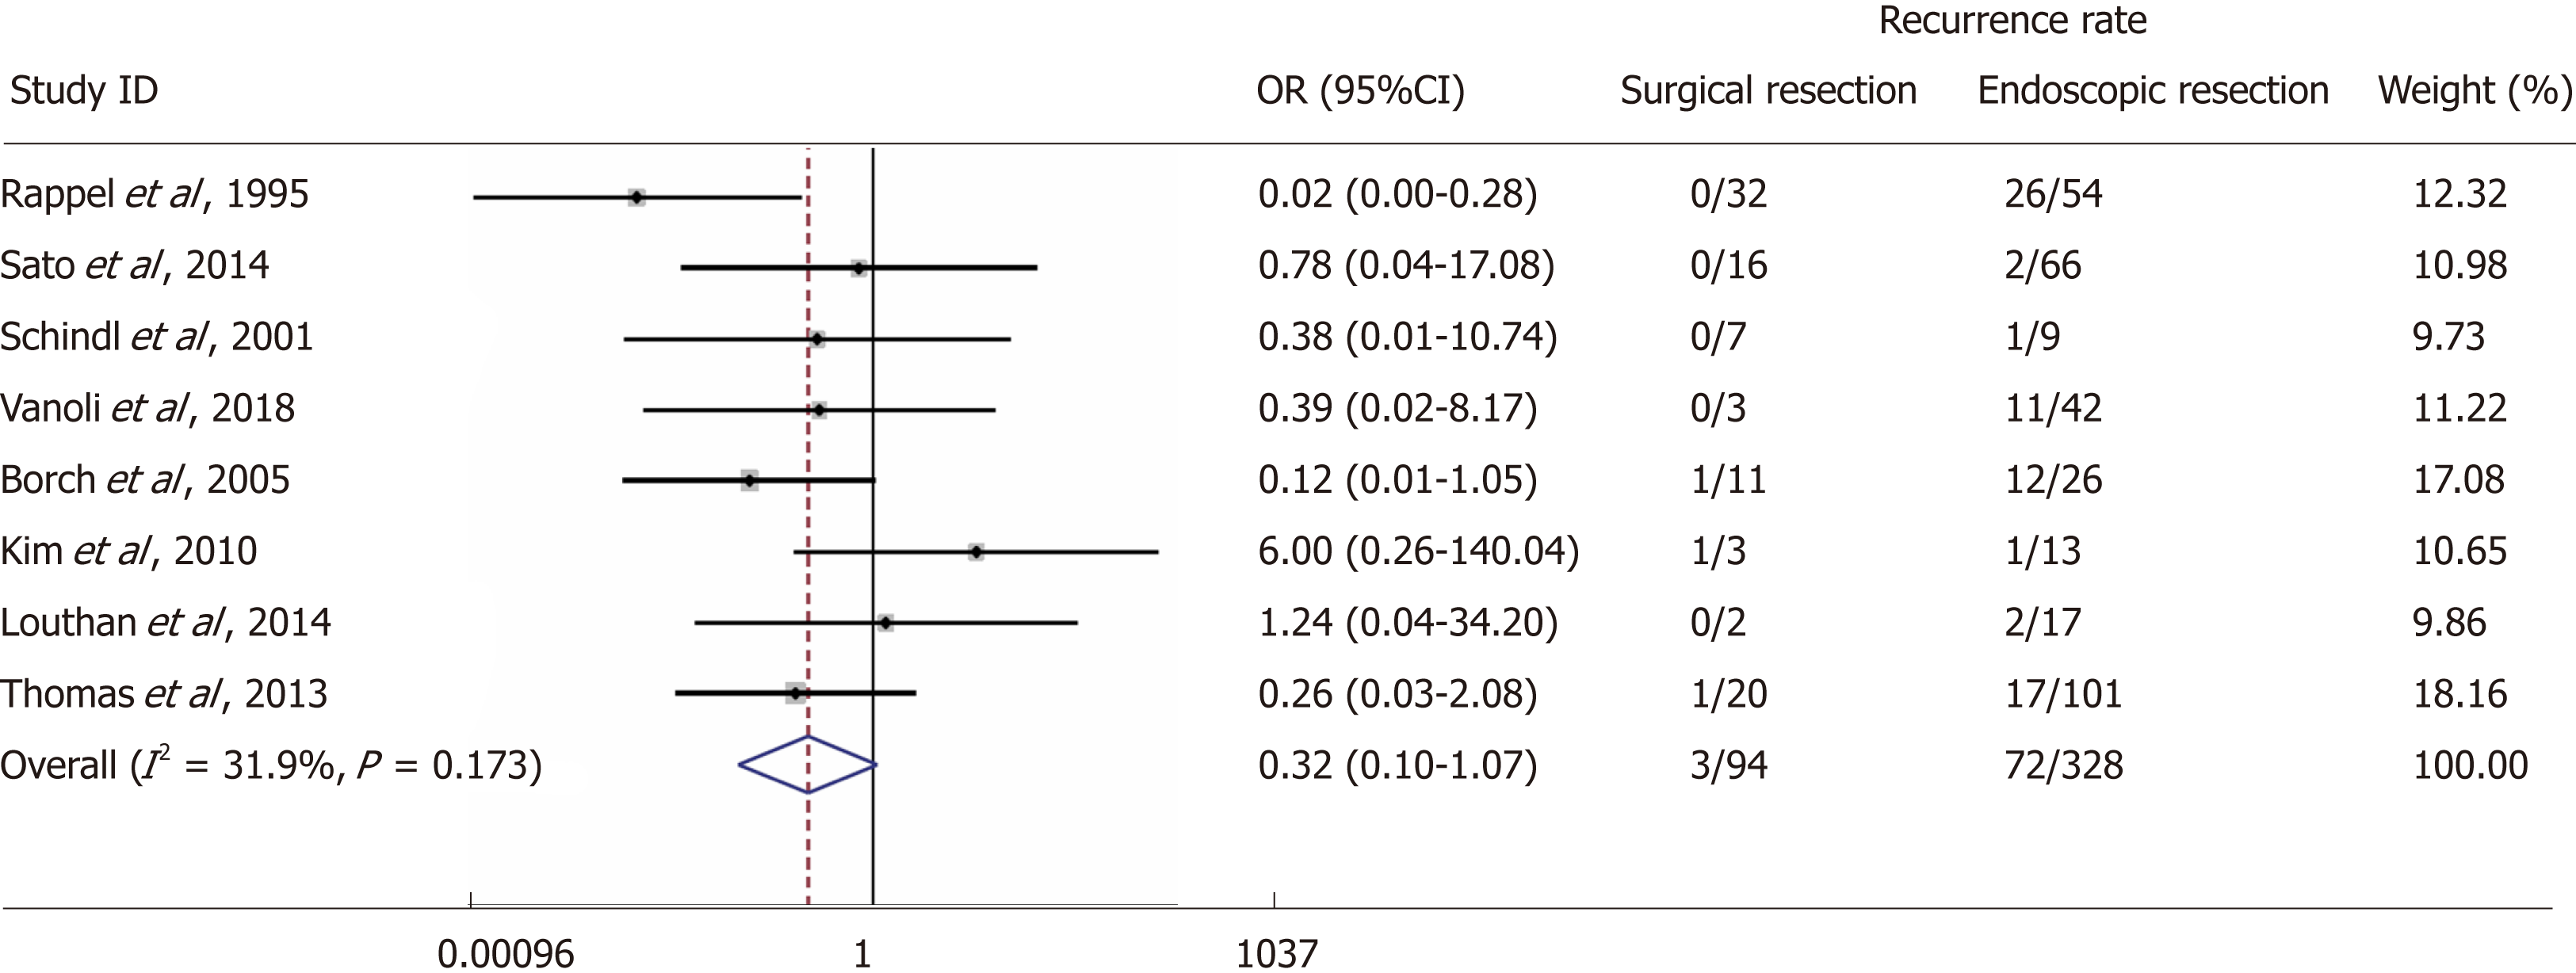
Figure 5 Forest plot comparing the rate of local recurrence in patients with gastric neuroendocrine neoplasms type 1 undergoing endoscopic resection vs surgical resection.
Meta-analysis of all studies carried out using a random-effects model; Odds ratios are shown with 95%CI.
- Citation: Tsolakis AV, Ragkousi A, Vujasinovic M, Kaltsas G, Daskalakis K. Gastric neuroendocrine neoplasms type 1: A systematic review and meta-analysis. World J Gastroenterol 2019; 25(35): 5376-5387
- URL: https://www.wjgnet.com/1007-9327/full/v25/i35/5376.htm
- DOI: https://dx.doi.org/10.3748/wjg.v25.i35.5376


