Copyright
©The Author(s) 2019.
World J Gastroenterol. Sep 7, 2019; 25(33): 4999-5016
Published online Sep 7, 2019. doi: 10.3748/wjg.v25.i33.4999
Published online Sep 7, 2019. doi: 10.3748/wjg.v25.i33.4999
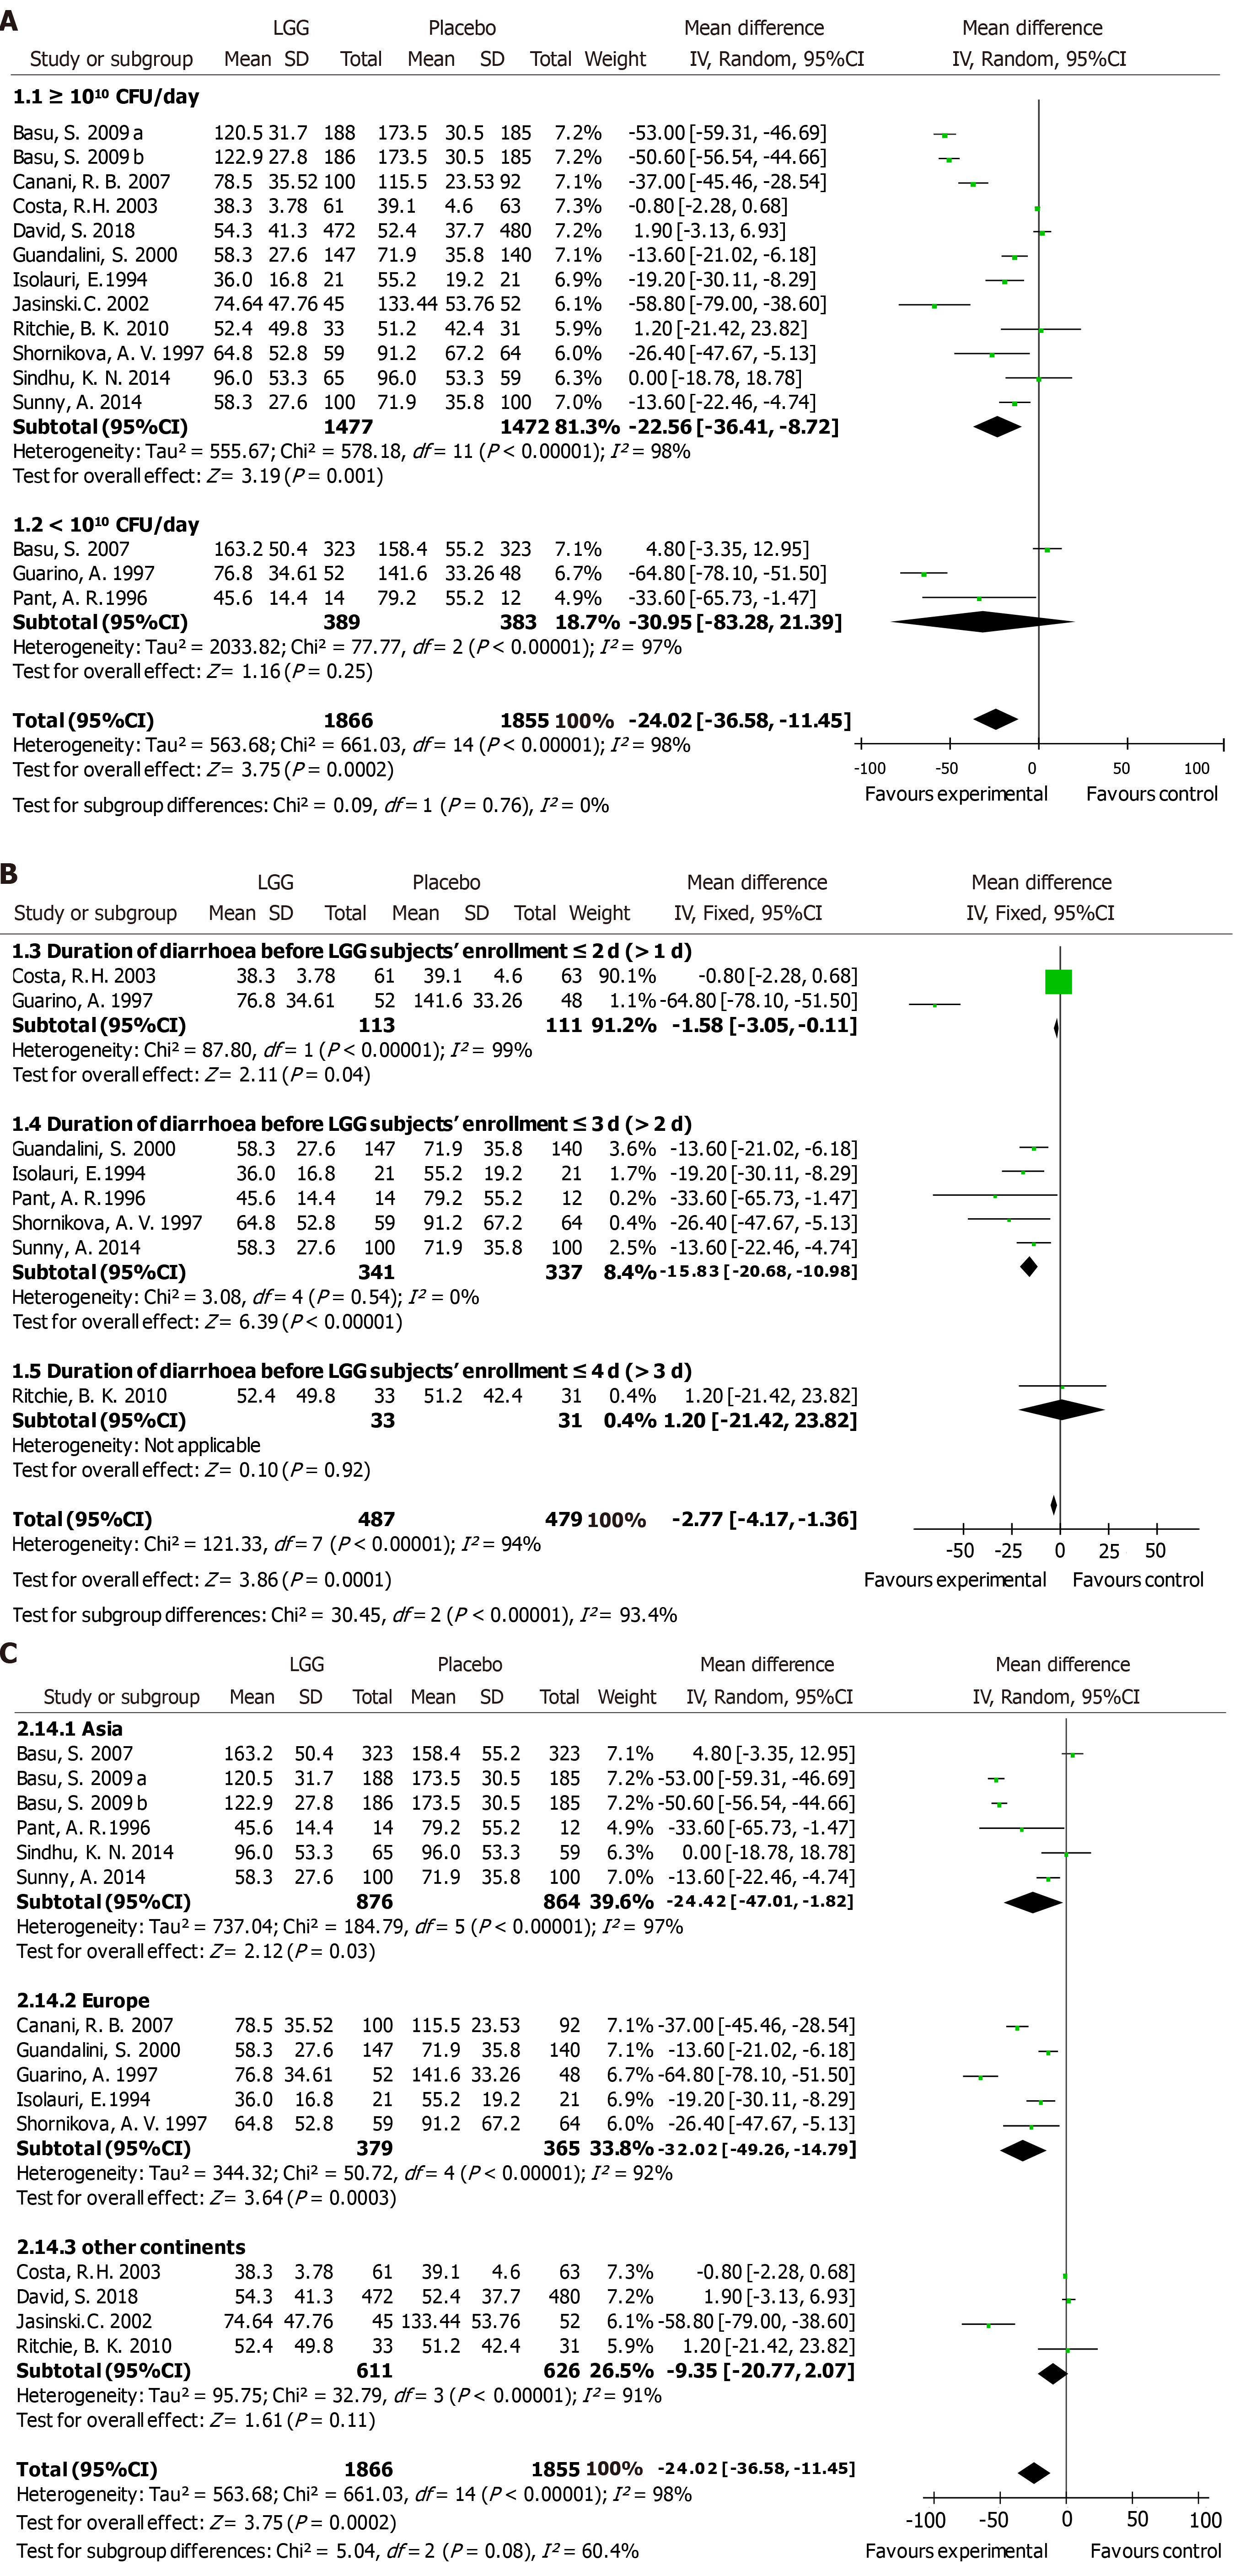
Figure 1 Lactobacillus GG vs control with regard to the duration of diarrhea (hours).
A: High dose and low dose; B: The duration of diarrhea before Lactobacillus rhamnosus GG participants’ enrollment: ≤2 d (>1 d), ≤3 d (>2 d), and ≤4 d (>3 d); C: Geography of the clinical trials: Asia, Europe, and other continents. LGG: Lactobacillus rhamnosus GG; CI: Confidence interval; SD: Standard deviation.
Figure 2 Lactobacillus GG vs control with regard to mean duration of diarrhea (hours) in children with rotavirus diarrhea.
LGG: Lactobacillus rhamnosus GG; CI: Confidence interval; SD: Standard deviation.
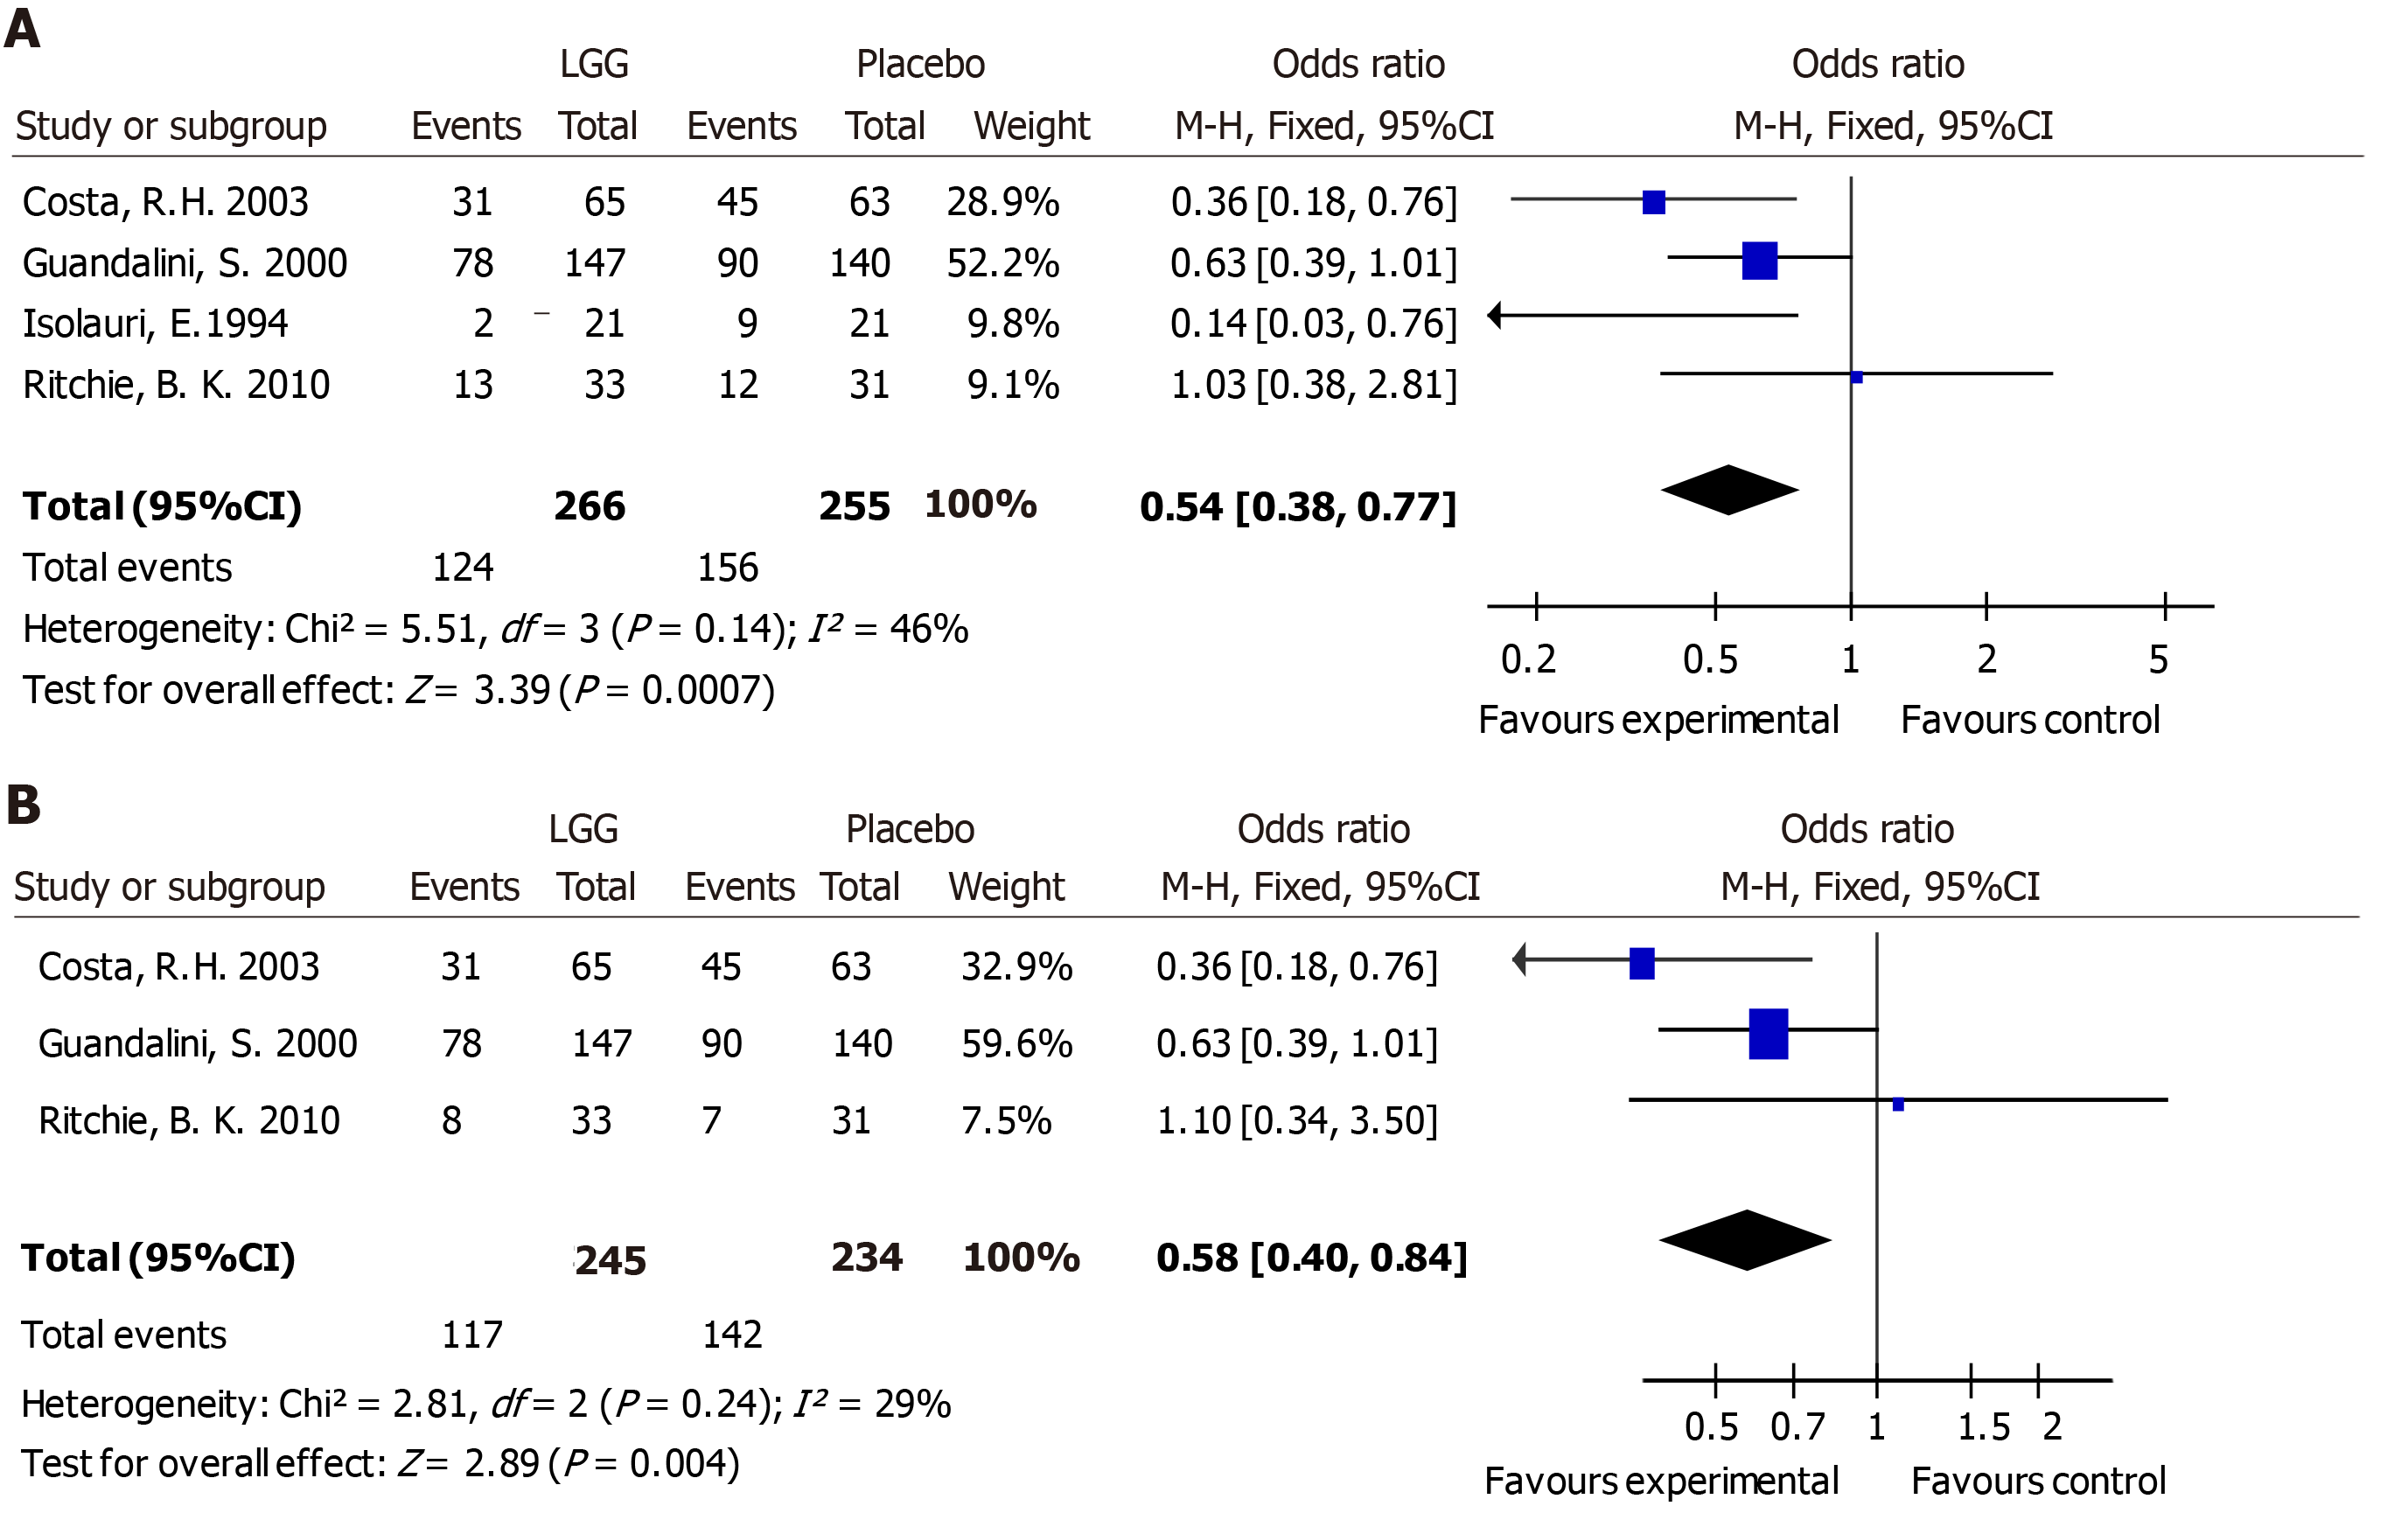
Figure 3 Lactobacillus GG vs control with regard to the presence of diarrhea.
A: Diarrhea lasting > 3 d; B: Diarrhea lasting > 4 d. LGG: Lactobacillus rhamnosus GG; CI: Confidence interval.
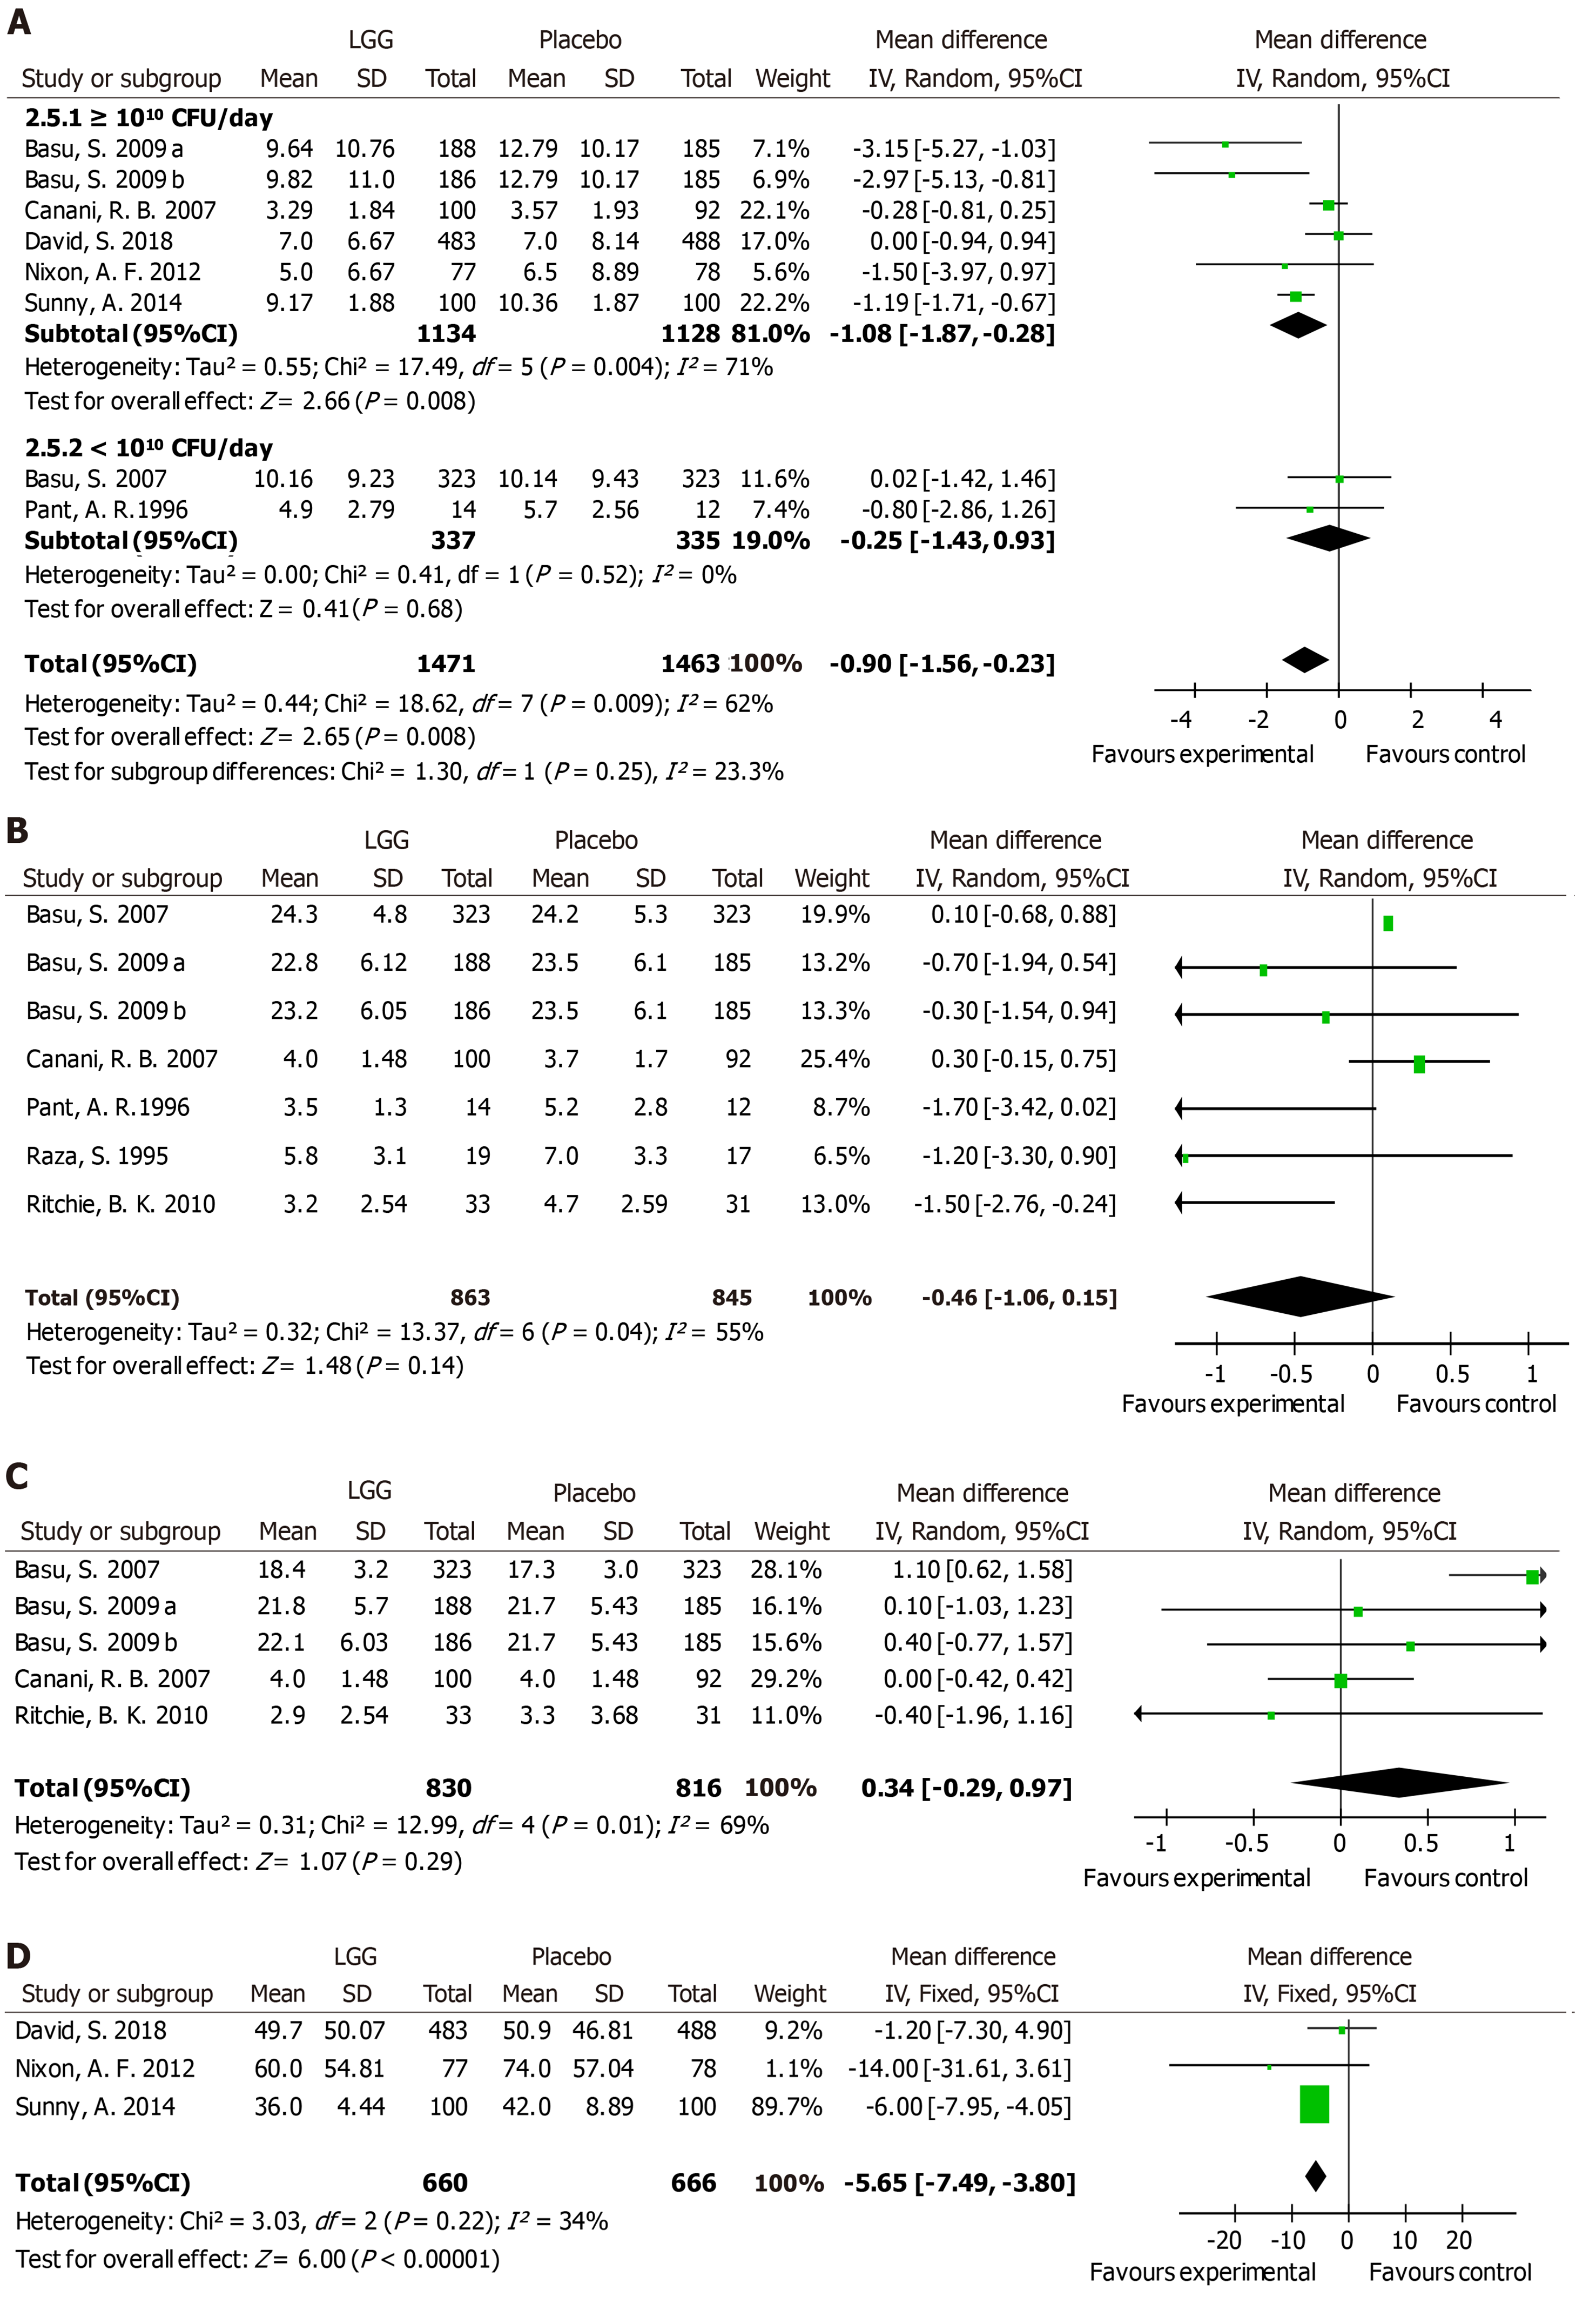
Figure 4 Lactobacillus GG vs control with regard to stool number and consistency.
A: The average stool number per day (high dose and low dose); B: Stool frequency on day 2; C: Stool frequency on day 3; D: The mean time to improvement in stool consistency. LGG: Lactobacillus rhamnosus GG; CI: Confidence interval; SD: Standard deviation.
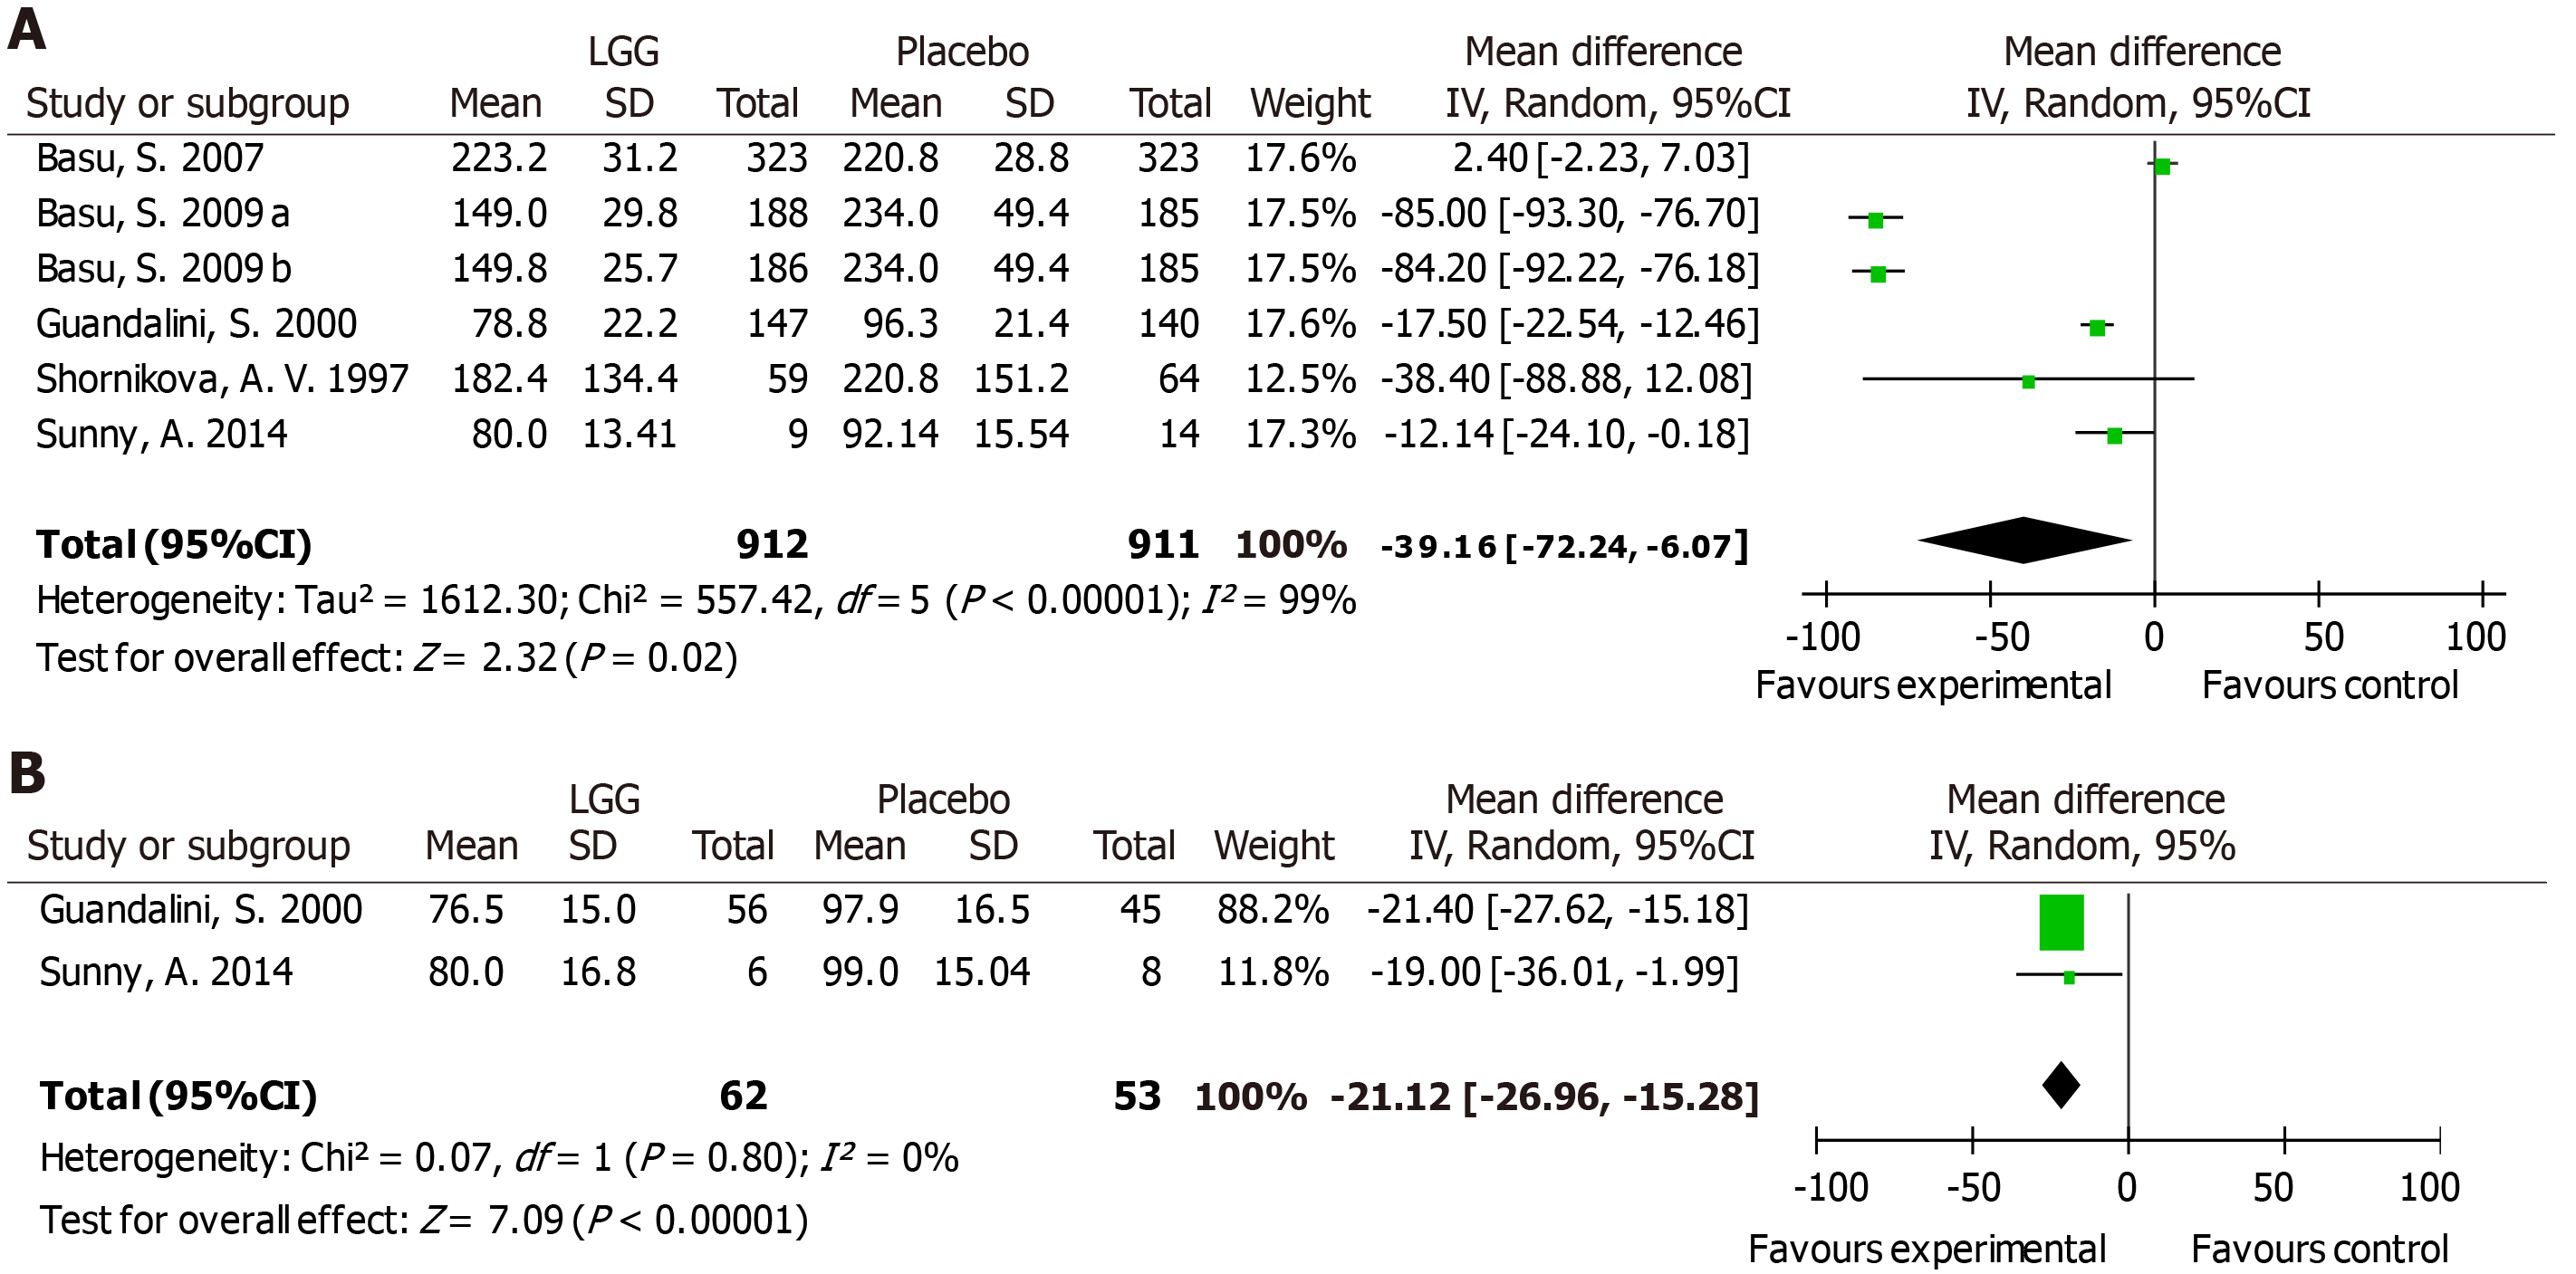
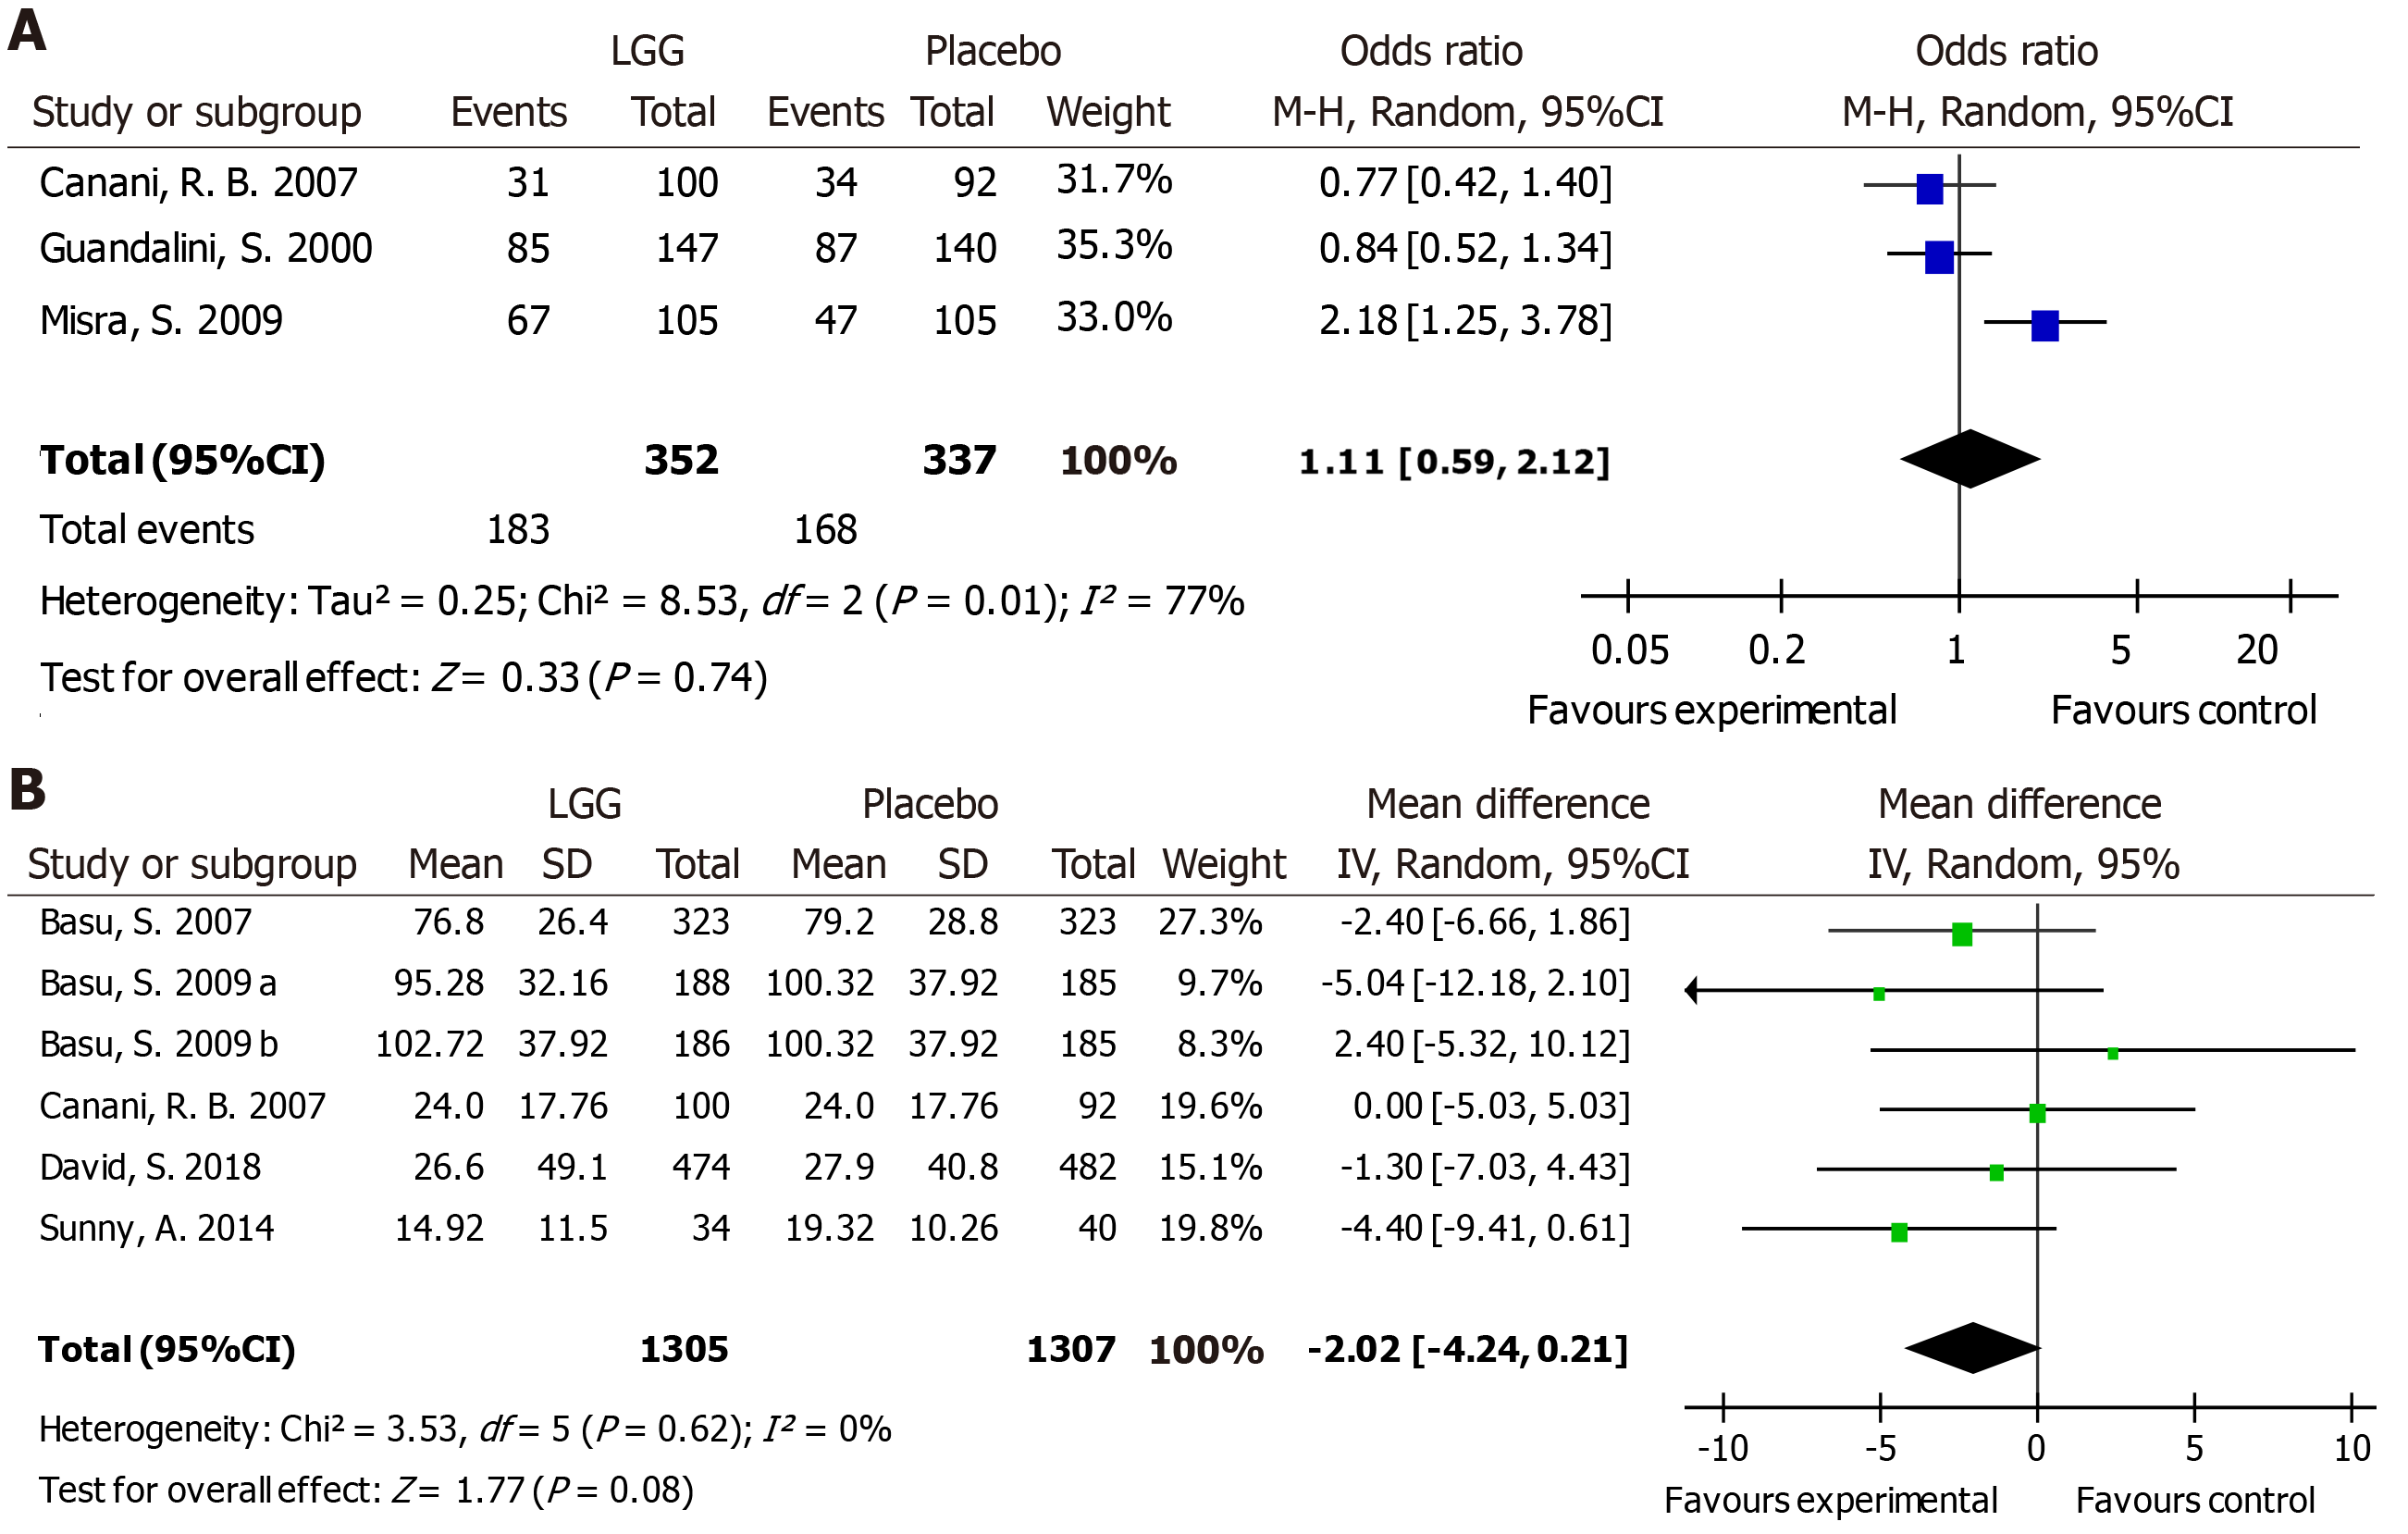
Figure 5 Lactobacillus GG vs control.
A: The duration of hospital stay (hours); B: The hospital stay duration of rotavirus-positive children (hours). LGG: Lactobacillus rhamnosus GG; CI: Confidence interval; SD: Standard deviation.
Figure 6 Lactobacillus GG vs control with regard to vomiting.
A: The number of participants with vomiting [number (%)]; B: The duration of vomiting (hours). LGG: Lactobacillus rhamnosus GG; CI: Confidence interval; SD: Standard deviation.
- Citation: Li YT, Xu H, Ye JZ, Wu WR, Shi D, Fang DQ, Liu Y, Li LJ. Efficacy of Lactobacillus rhamnosus GG in treatment of acute pediatric diarrhea: A systematic review with meta-analysis. World J Gastroenterol 2019; 25(33): 4999-5016
- URL: https://www.wjgnet.com/1007-9327/full/v25/i33/4999.htm
- DOI: https://dx.doi.org/10.3748/wjg.v25.i33.4999


