Copyright
©The Author(s) 2019.
World J Gastroenterol. Sep 7, 2019; 25(33): 4970-4984
Published online Sep 7, 2019. doi: 10.3748/wjg.v25.i33.4970
Published online Sep 7, 2019. doi: 10.3748/wjg.v25.i33.4970
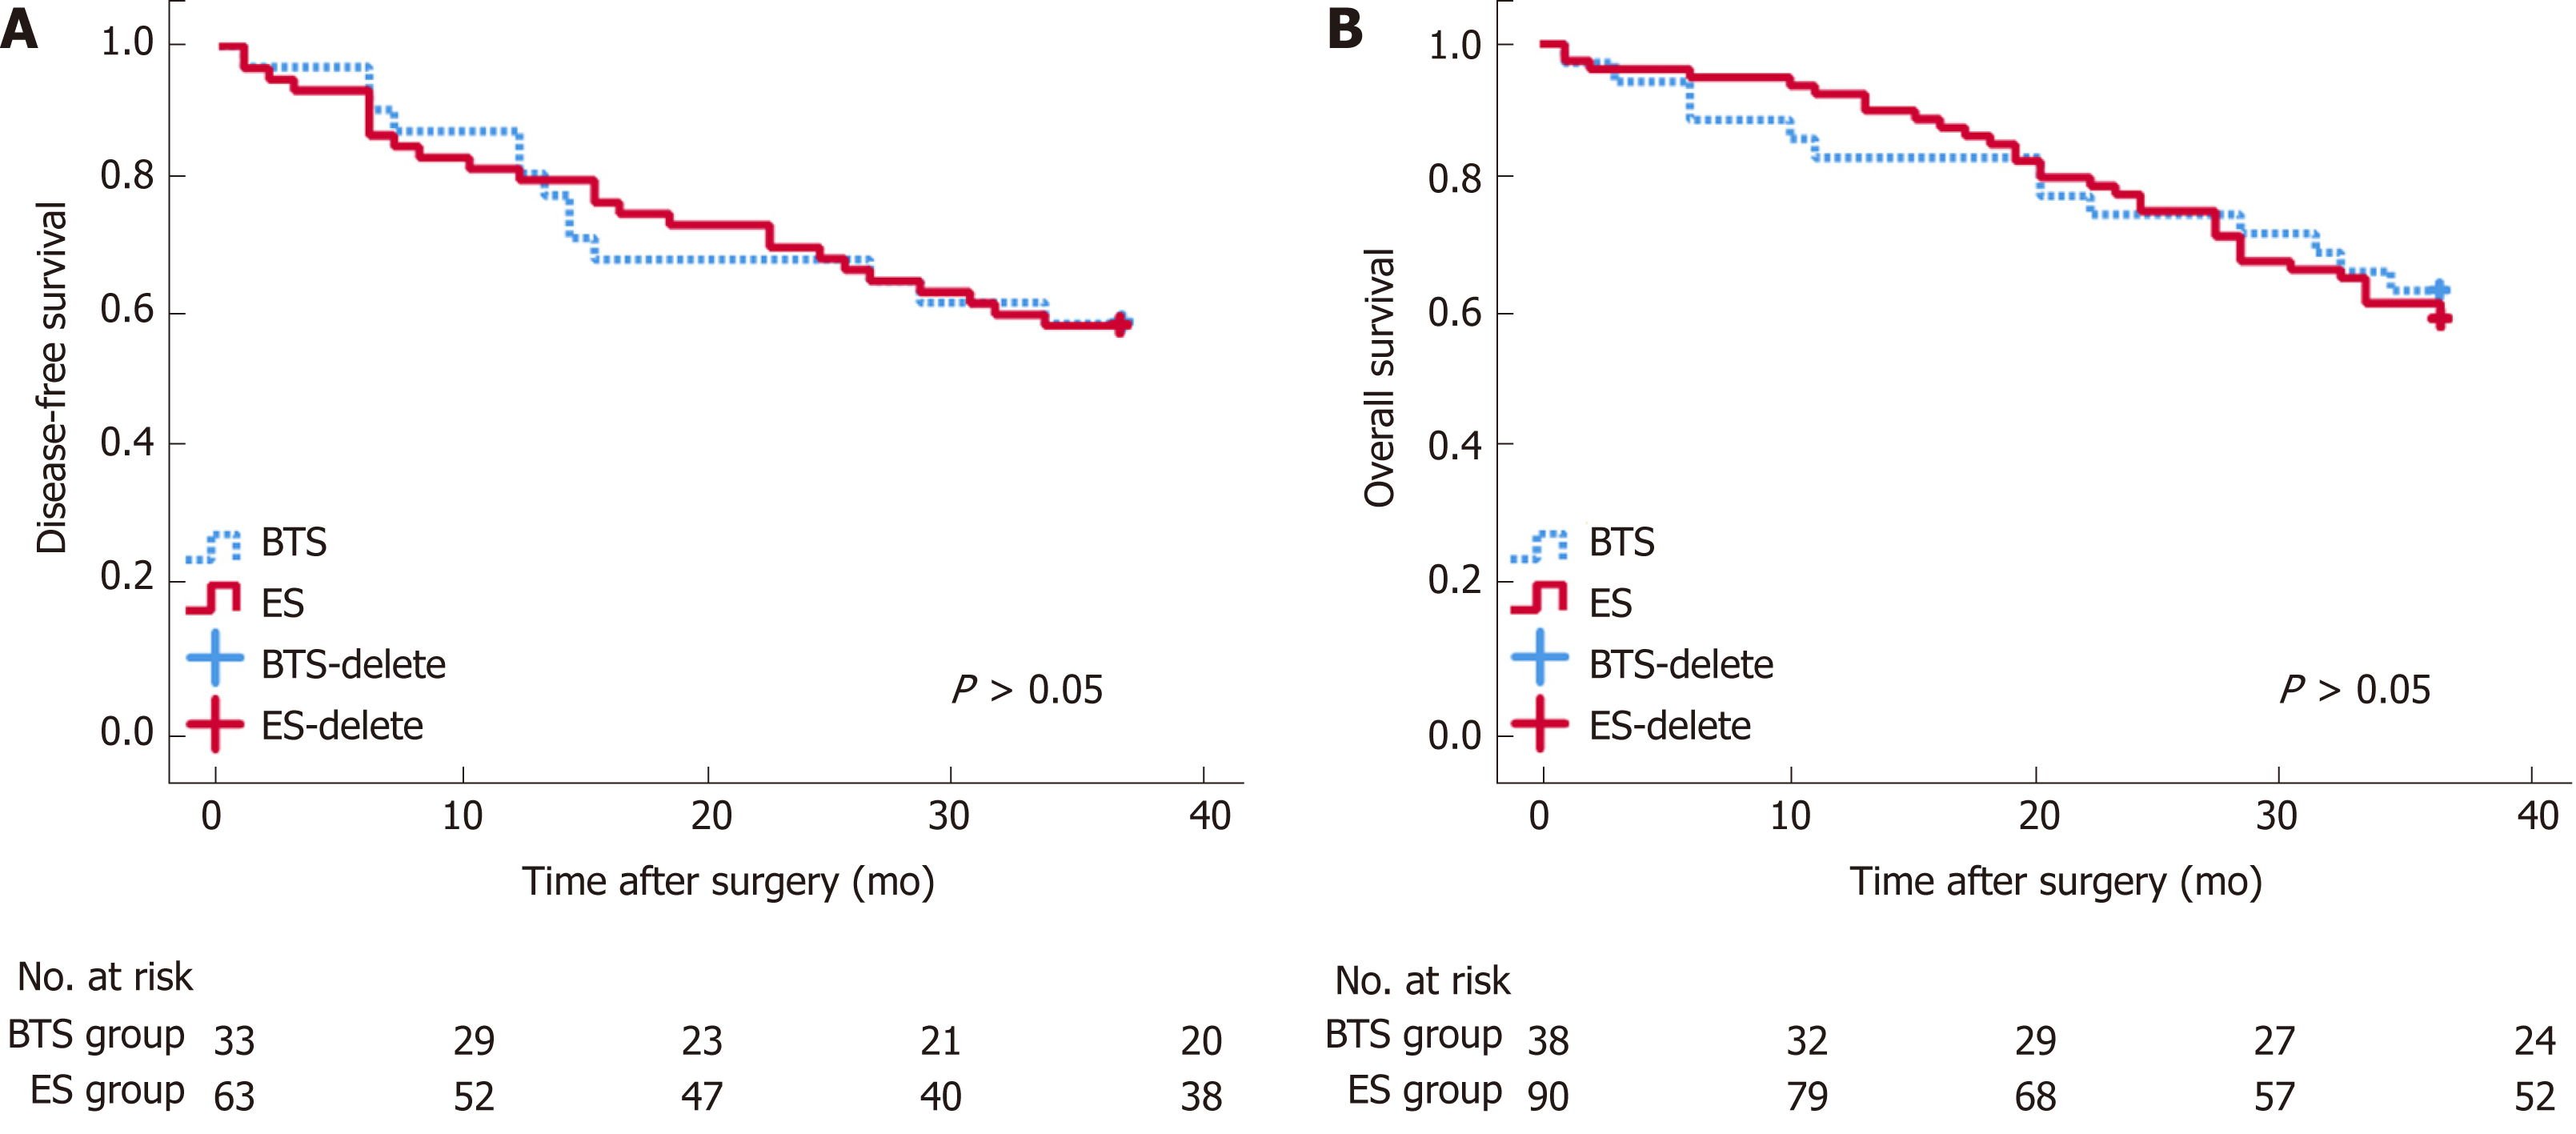
Figure 1 Long-term survival analysis between emergency surgery and bridge to surgery groups.
Disease-free survival (DFS, A) and overall survival (OS, B) after surgery seemed similar between the bridge to surgery (BTS) and emergency surgery (ES) groups.
Figure 2 Receiver operating characteristic curve and long-term survival analysis of emergency surgery and bridge to surgery group.
Derived neutrophil-to-lymphocyte ratio (dNLR) is preferred as a prognostic biomarker for the emergency surgery (ES) group with the highest area under receiver operating characteristic curve (AUC) for 3-year overall survival (OS) (0.679, 95%CI: 0.551-0.808) (A) and 3-year disease-free survival (DFS) (0.679, 95%CI: 0.551-0.808) (B), with a cutoff point value of 1.57. High-ratio grade of dNLR (≥ 1.57) was closely related to lower 3-year DFS (≥ 1.57 vs <1.57, 23.10 ± 13.85 mo vs 31.45 ± 9.35 mo, P = 0.009) in the ES group (D), but not with 3-year OS (C). Lymphocyte-to-monocyte ratio (LMR) was preferred as a prognostic biomarker for bridge to surgery (BTS) group with the highest AUC for 3-year OS (0.611, 95%CI: 0.424-0.798) (E) and 3-year DFS (0.571, 95%CI: 0.366-0.776) (F), with a cutoff point value of 1.67. High-ratio grade of LMR (≥ 1.67) was closely related to lower 3-year OS (≥ 1.67 vs <1.67, 23.10 ± 13.85 mo vs 33.78 ± 5.35 mo, P = 0.020) (G) and 3-year DFS (≥ 1.67 vs < 1.67, 22.67 ± 14.02 mo vs 31.50 ± 8.89 mo, P = 0.046) in the BTS group (H).
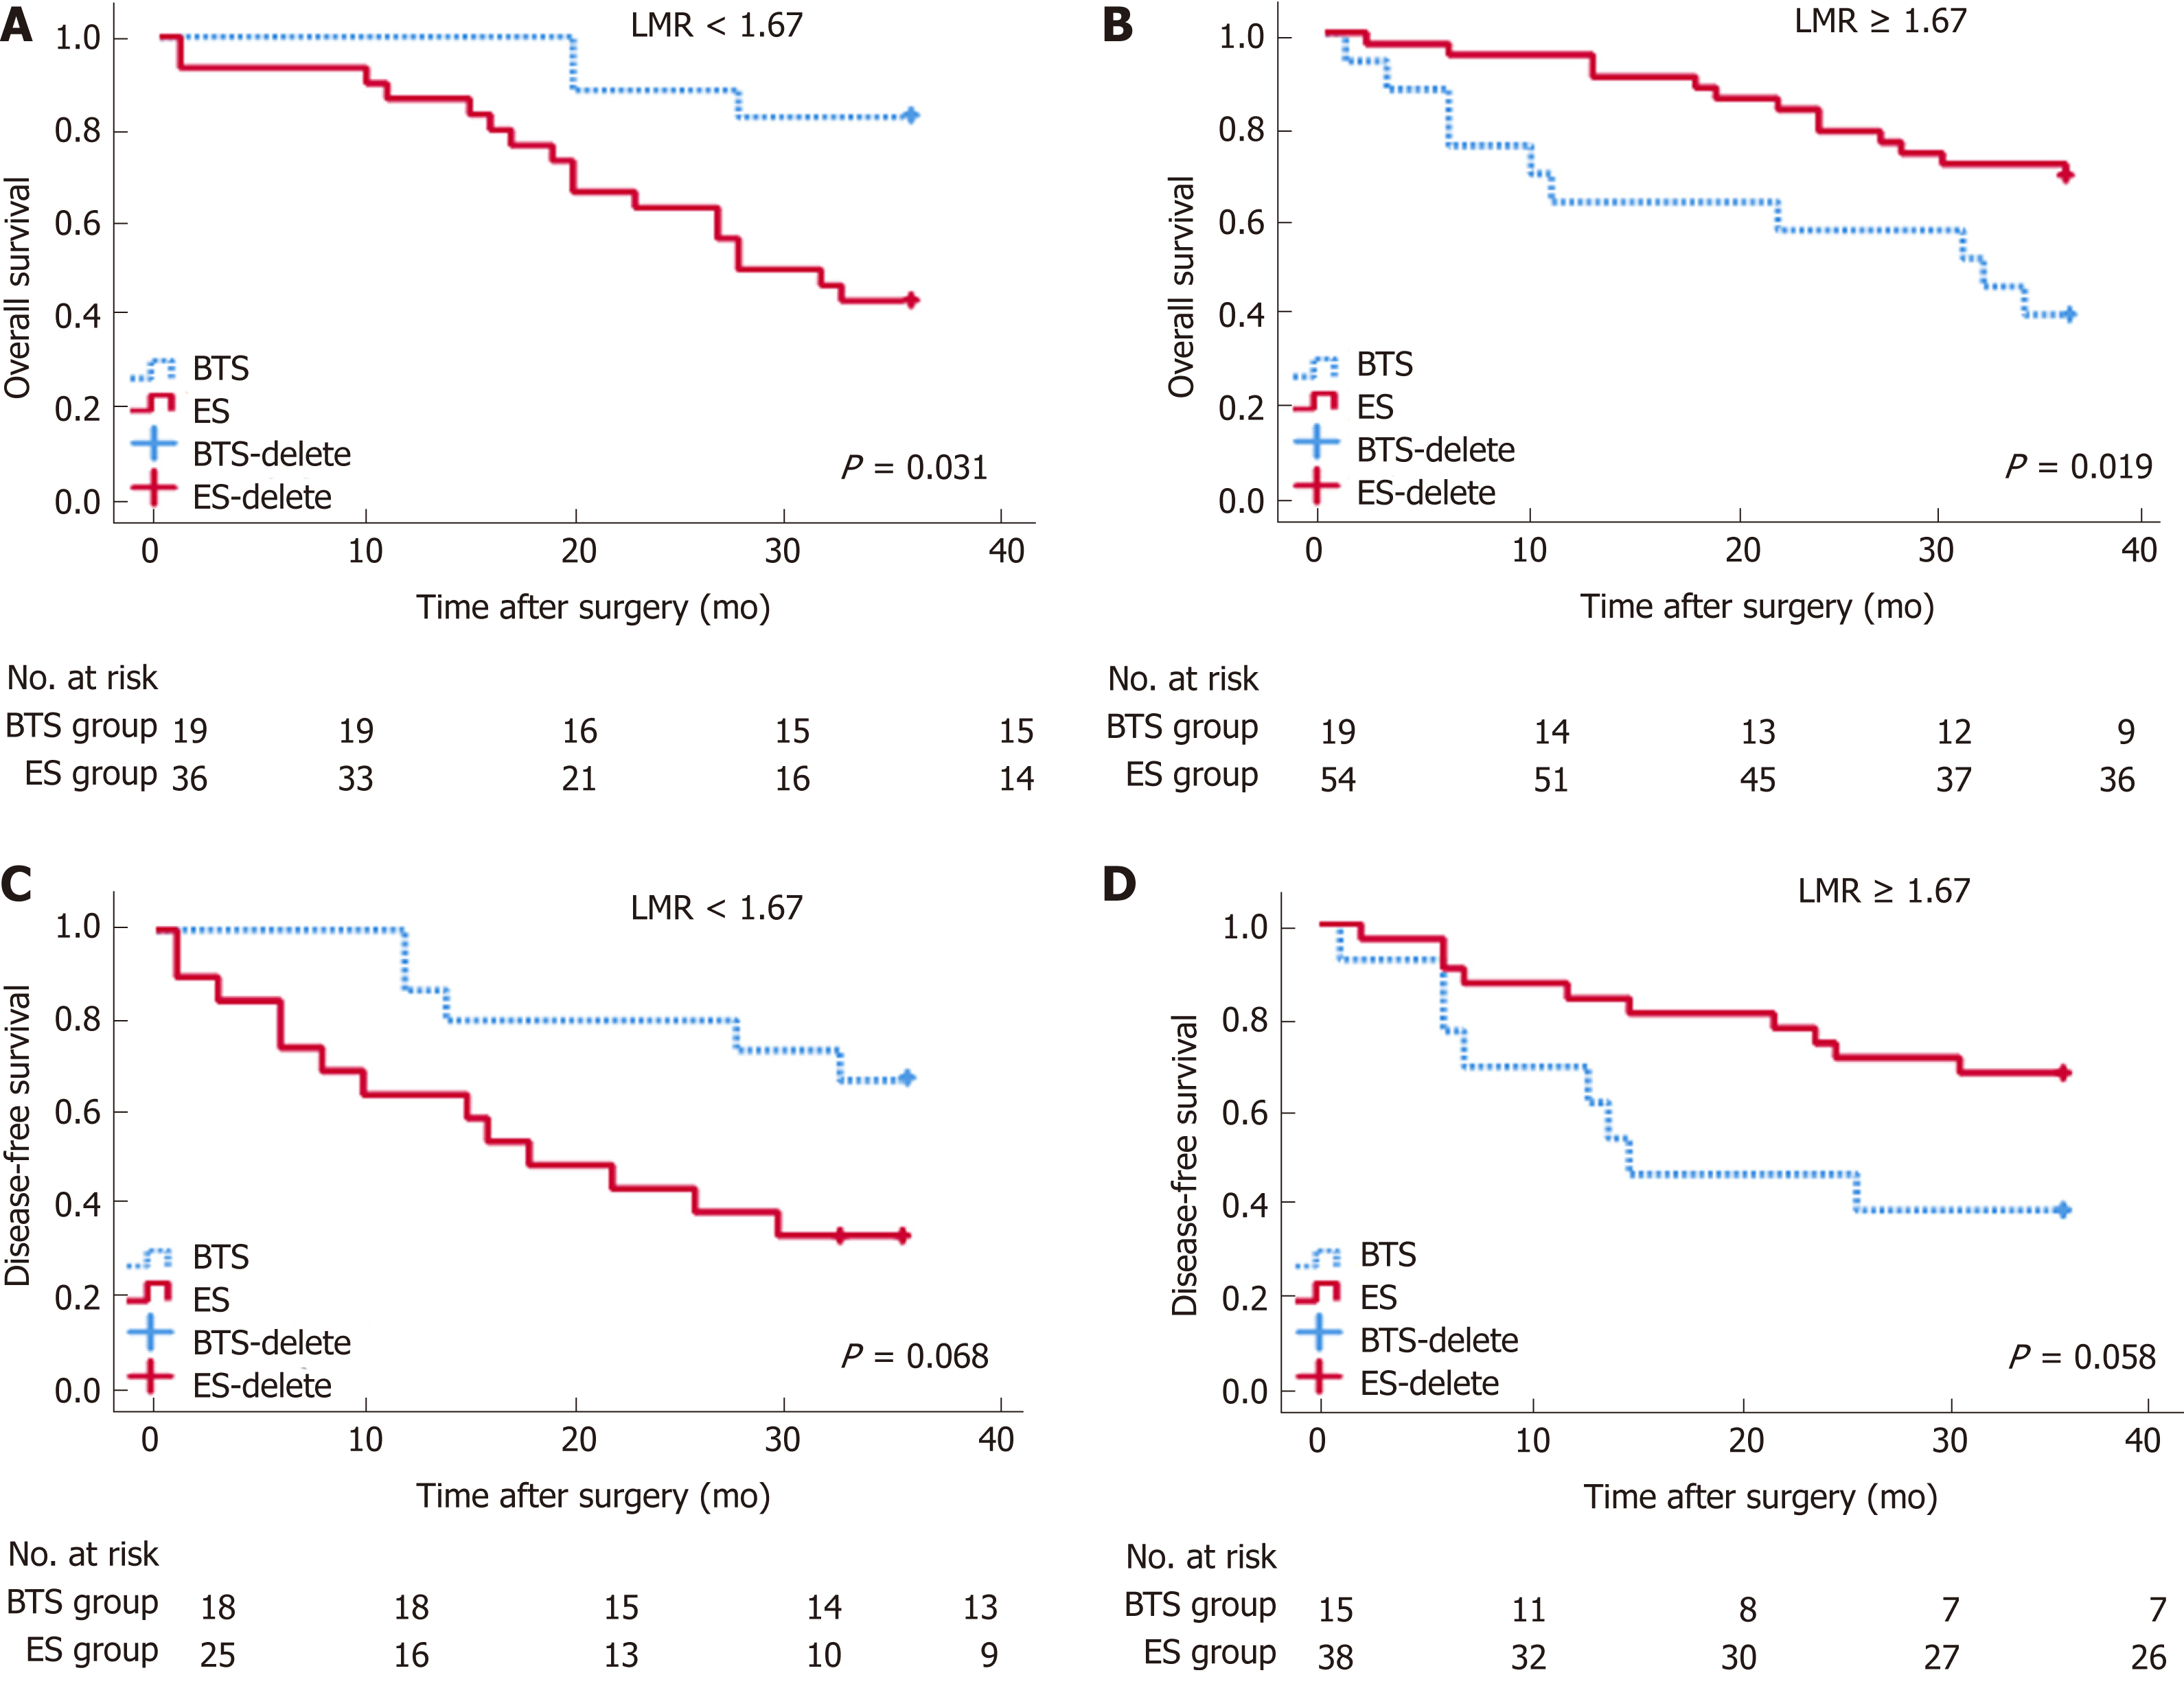
Figure 3 Analysis of 3-year overall survival and 3-year disease-free survival, by different lymphocyte-to-monocyte ratios between emergency surgery and bridge to surgery groups.
P < 0.05 (log-rank test). Low lymphocyte-to-monocyte ratio (LMR) (LMR < 1.67) indicated higher rates of 3-year OS (A) (HR = 0.40, 95%CI: 0.18-0.92, P = 0.031) and 3-year disease-free survival (DFS) (C) (HR = 0.42, 95%CI: 0.17-1.07, P = 0.068) in the bridge to surgery (BTS) group. Conversely, high LMR (LMR ≥ 1.67) showed lower proportions of 3-year OS (B) (HR = 4.32, 95%CI: 1.27-14.82, P = 0.019) and 3-year DFS (D) (HR = 2.72, 95%CI: 0.97-7.65, P = 0.058) in the BTS group.
- Citation: Chen XQ, Xue CR, Hou P, Lin BQ, Zhang JR. Lymphocyte-to-monocyte ratio effectively predicts survival outcome of patients with obstructive colorectal cancer. World J Gastroenterol 2019; 25(33): 4970-4984
- URL: https://www.wjgnet.com/1007-9327/full/v25/i33/4970.htm
- DOI: https://dx.doi.org/10.3748/wjg.v25.i33.4970


