Copyright
©The Author(s) 2019.
World J Gastroenterol. Jul 7, 2019; 25(25): 3256-3267
Published online Jul 7, 2019. doi: 10.3748/wjg.v25.i25.3256
Published online Jul 7, 2019. doi: 10.3748/wjg.v25.i25.3256
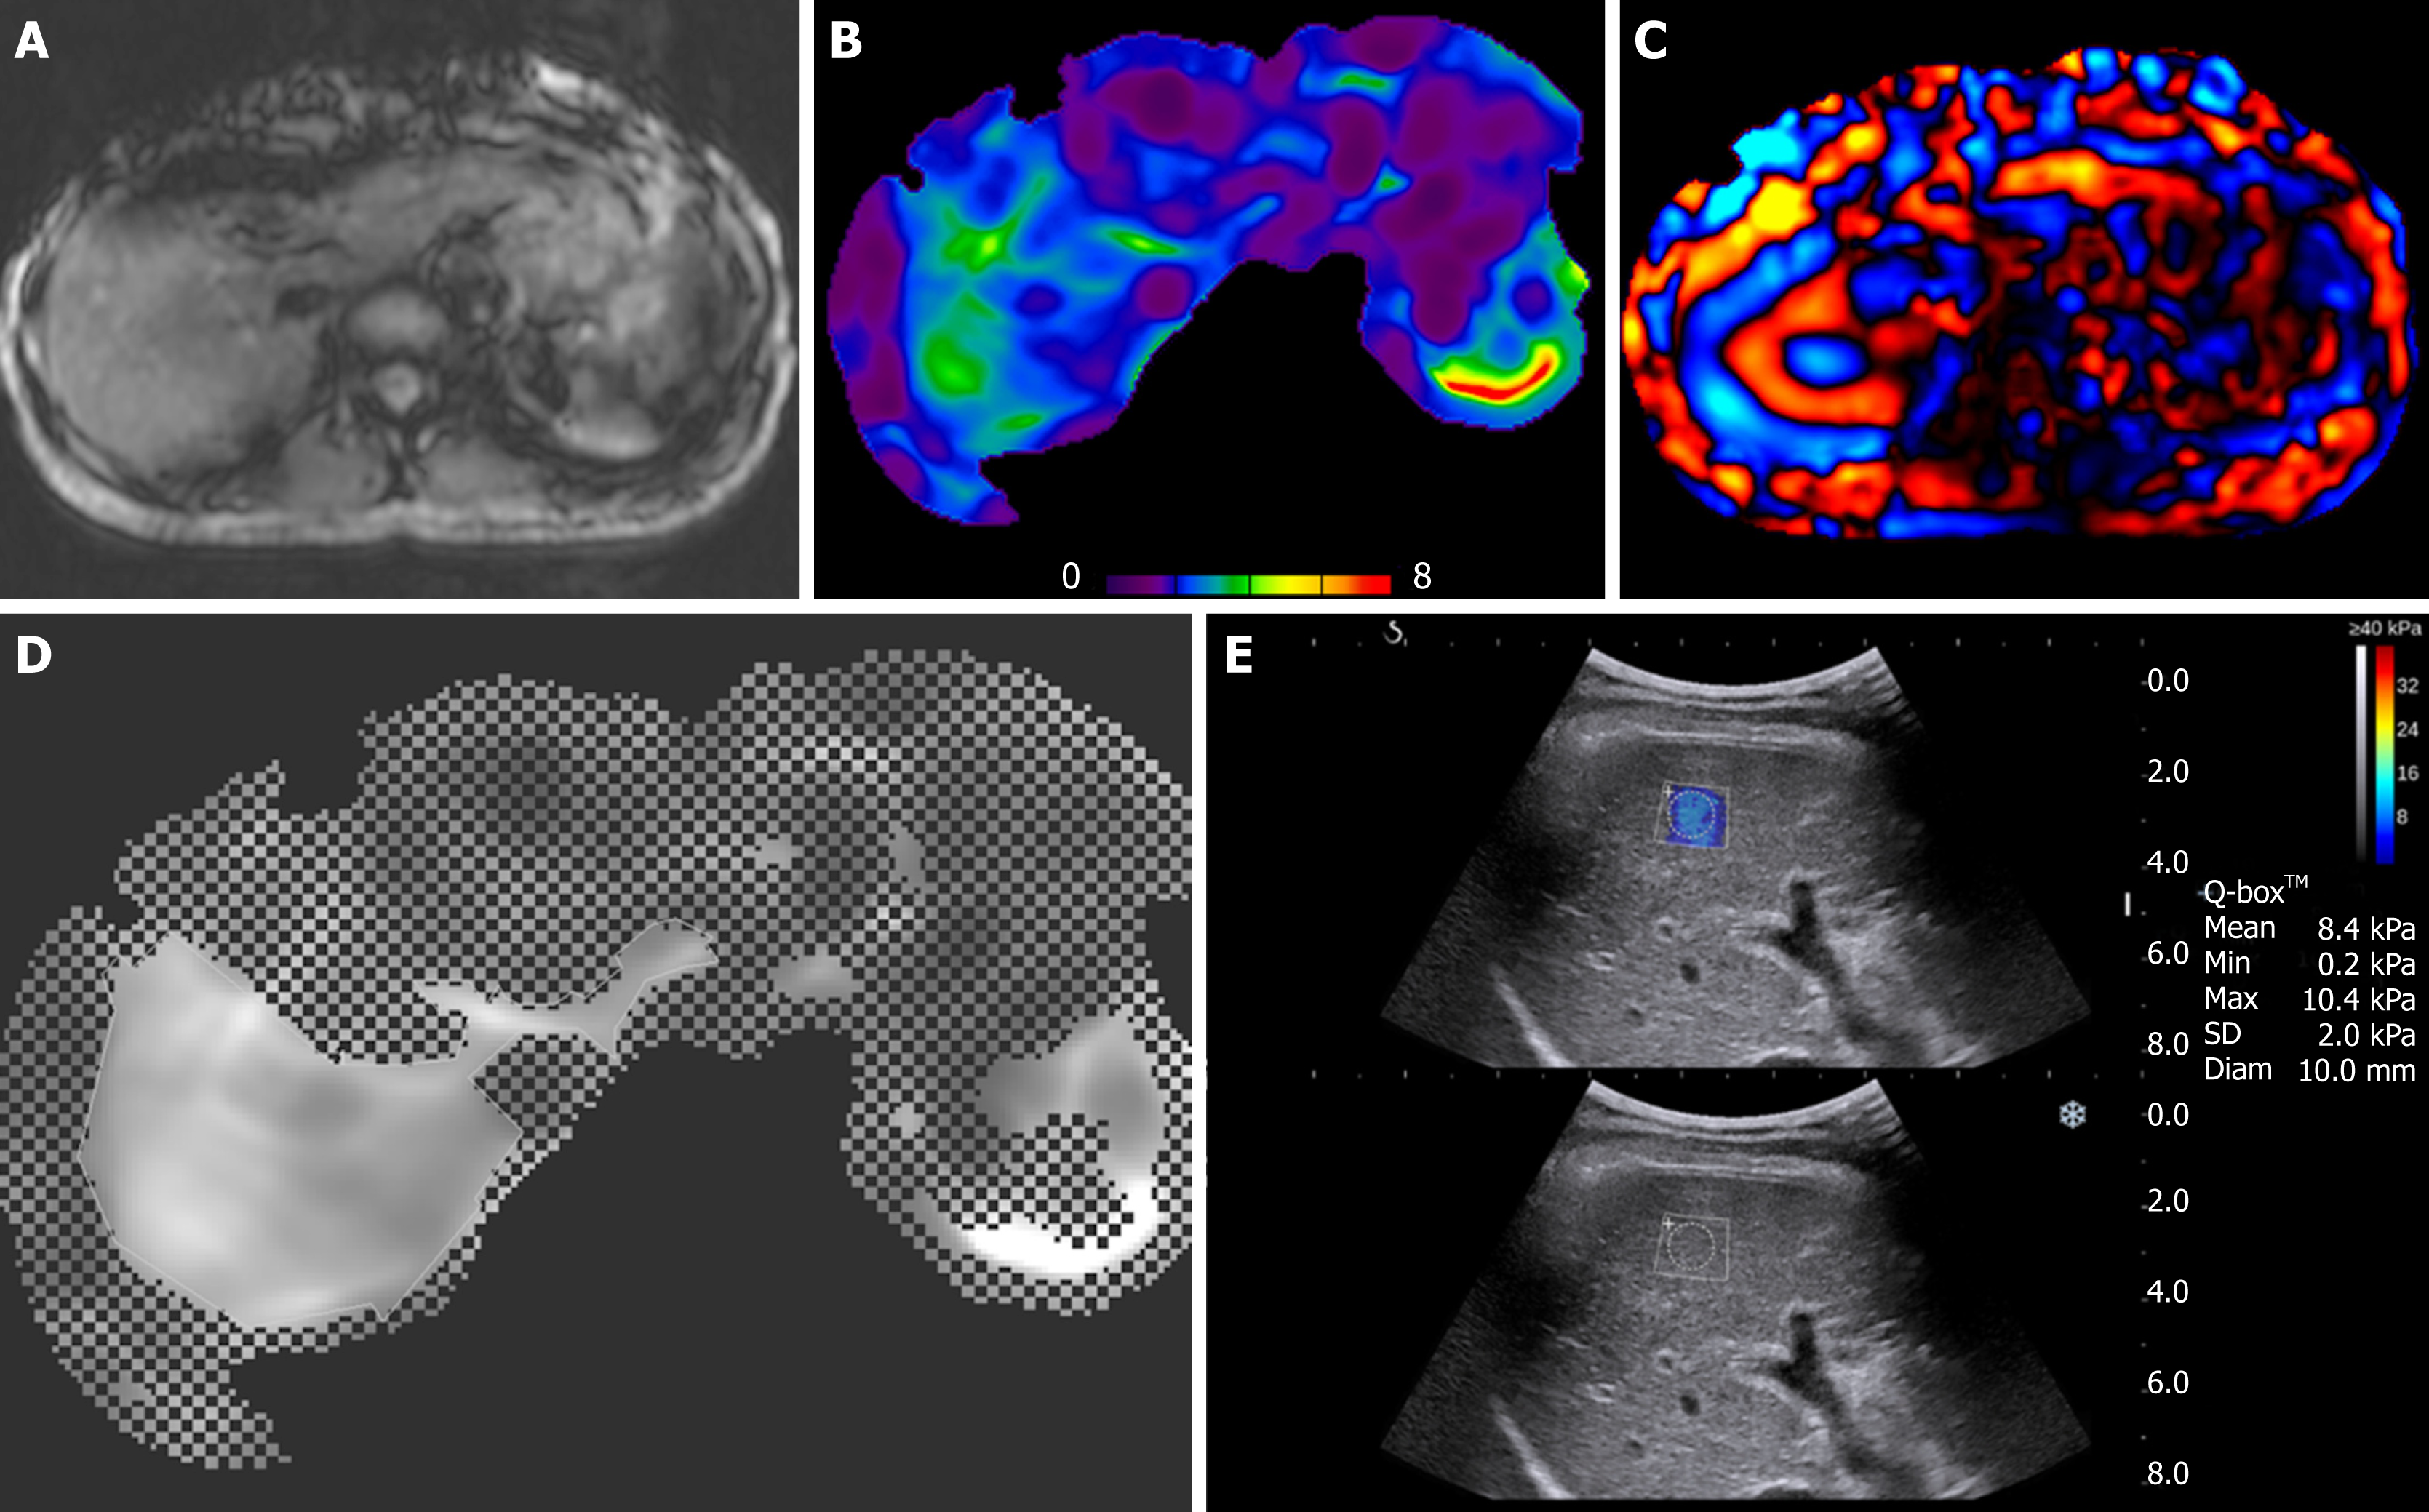
Figure 1 Images of magnetic resonance elastography (3A, 3B, 3C, 3D) and two-dimensional shear-wave elastography (3E) in 42-year old treatment-naïve chronic hepatitis B woman with fibrosis stage 3 on METAVIR score.
A: anatomic image, B: elastography with color mapping, C: wave image, D: confidence map of an elastography in right lobe of the liver, and E: two-dimensional shear-wave elastography (2D-SWE) (top) and gray-scale (bottom) images of the right hepatic lobe. Her liver stiffness values of magnetic resonance elastography and 2D-SWE were 2.66 kPa and 8.4 kPa, respectively.
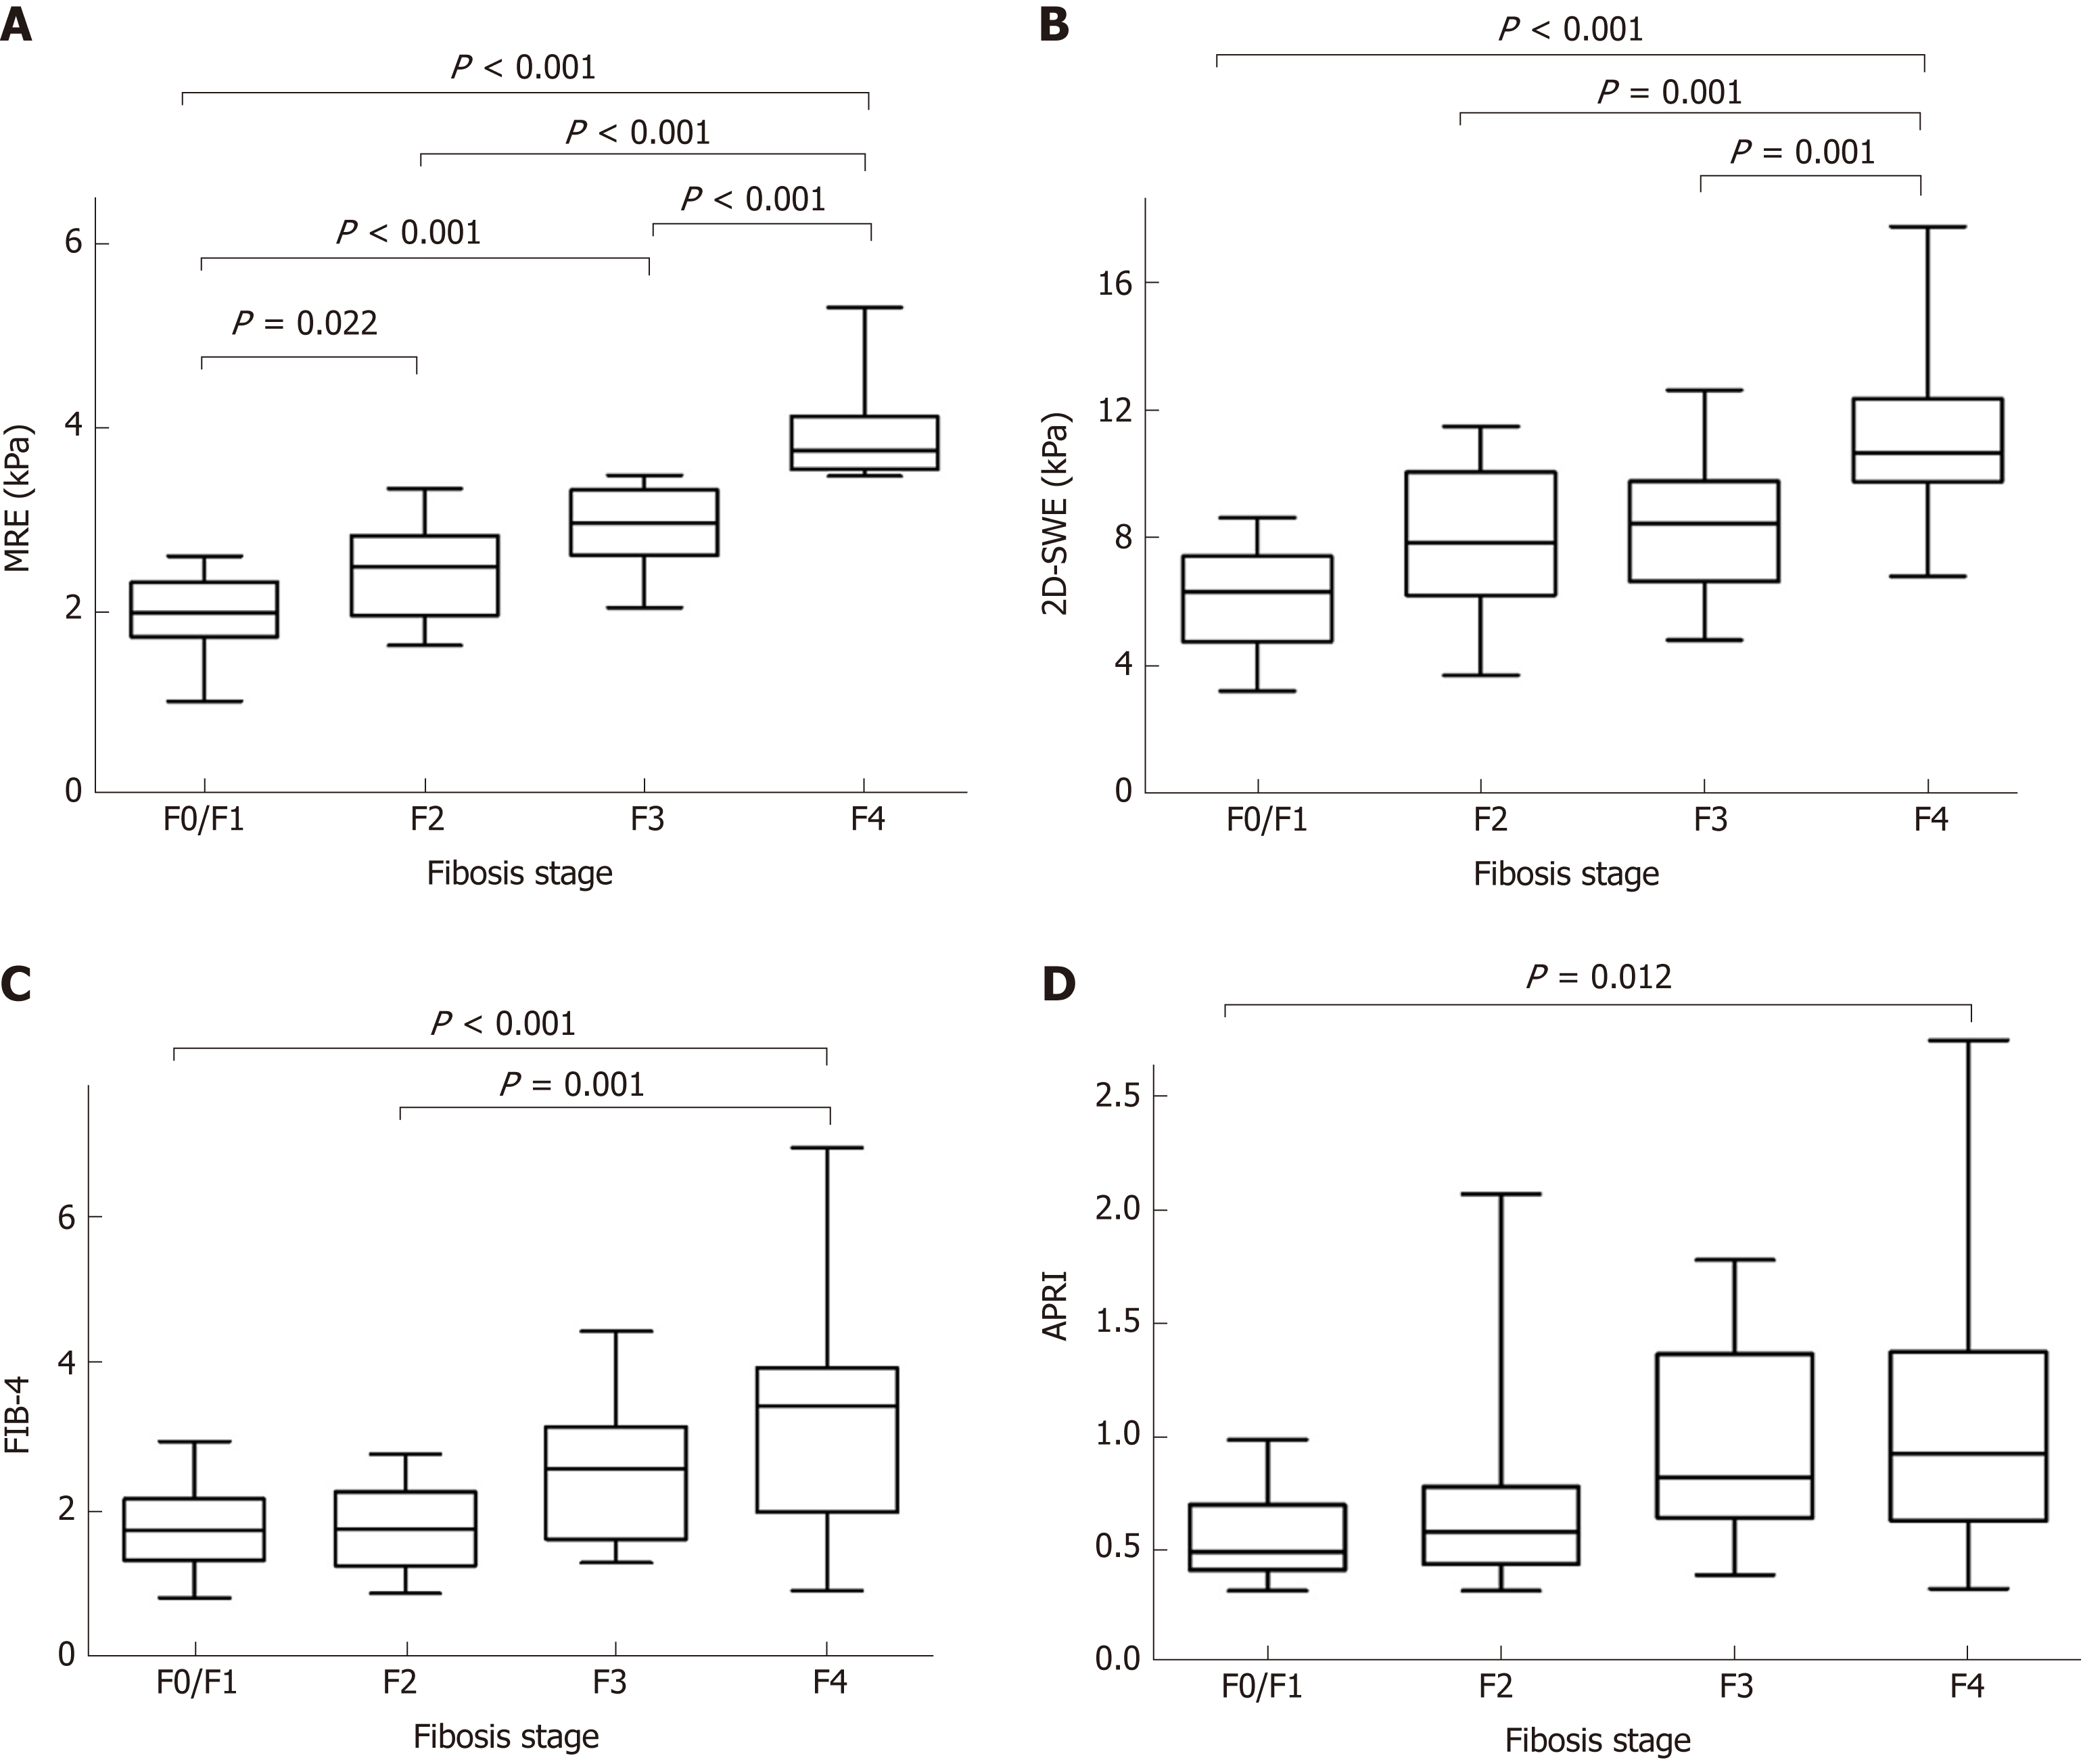
Figure 2 Box-and-whisker plots showing median and ranges for (A) magnetic resonance elastography, (B) two-dimensional shear-wave elastography, (C) fibrosis index based on four factors, (D) aspartate transaminase to platelet ratio index at different stages of liver fibrosis on METAVIR score.
MRE: Magnetic resonance elastography; 2D-SWE: Two-dimensional shear-wave elastography; APRI: Aspartate transaminase to platelet ratio index; FIB-4: Fibrosis index based on four factors.
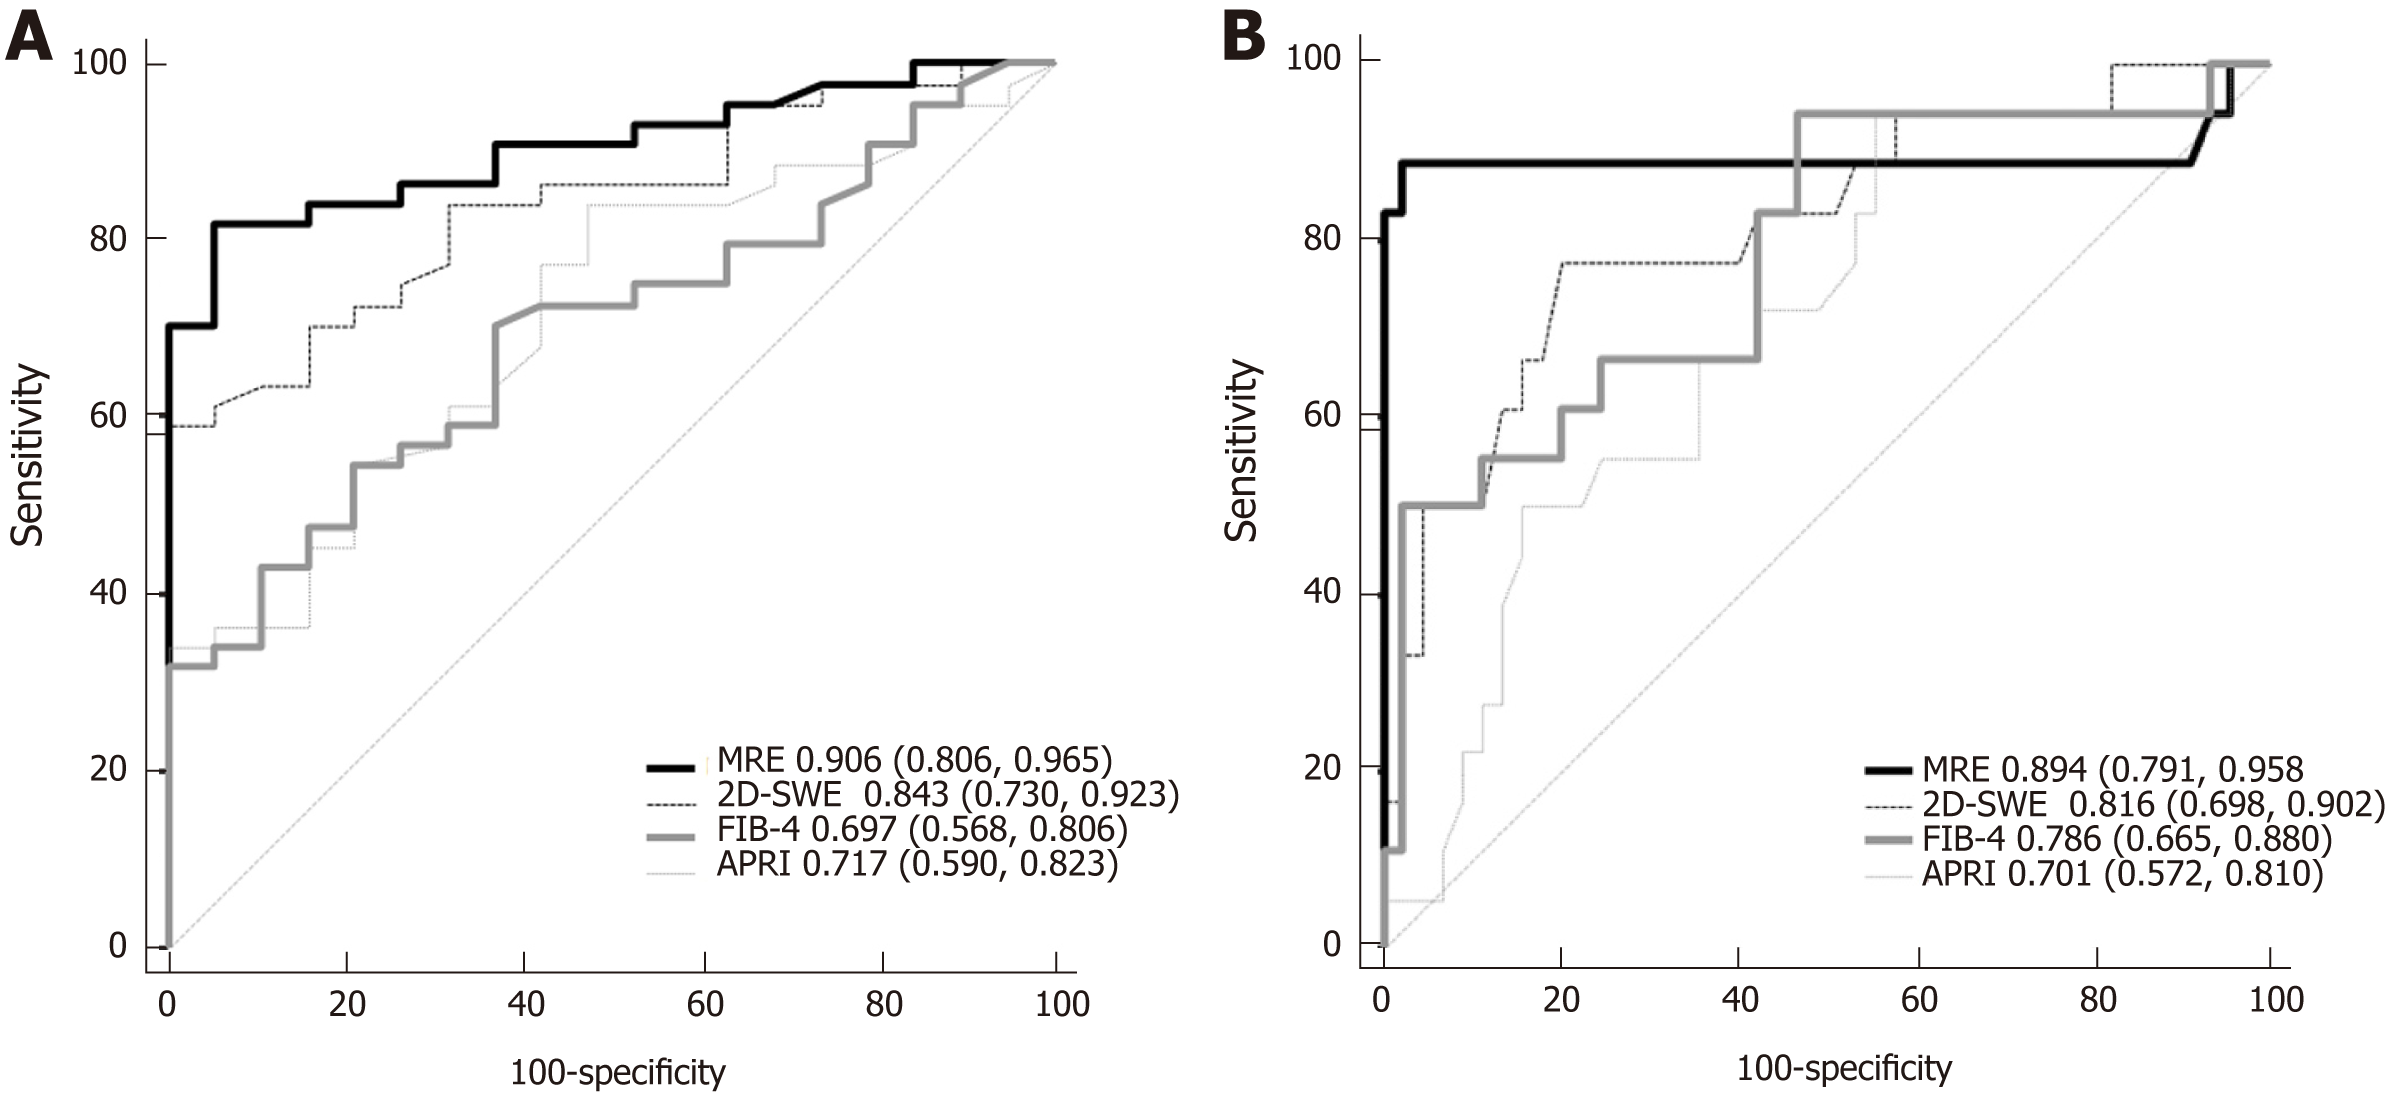
Figure 3 Graphs showing area under the receiver operating characteristic curves of magnetic resonance elastography, two-dimensional shear-wave elastography, fibrosis index based on four factors, and aspartate transaminase to platelet ratio index for prediction of significant fibrosis (A) and cirrhosis (B) in trea-tment-naive chronic hepatitis B patients with normal or mildly elevated alanine aminotransferase.
MRE: Magnetic resonance elastography; 2D-SWE: Two-dimensional shear-wave elastography; APRI: Aspartate transaminase to platelet ratio index; FIB-4: Fibrosis index based on four factors.
- Citation: Park HS, Choe WH, Han HS, Yu MH, Kim YJ, Jung SI, Kim JH, Kwon SY. Assessing significant fibrosis using imaging-based elastography in chronic hepatitis B patients: Pilot study. World J Gastroenterol 2019; 25(25): 3256-3267
- URL: https://www.wjgnet.com/1007-9327/full/v25/i25/3256.htm
- DOI: https://dx.doi.org/10.3748/wjg.v25.i25.3256


