Copyright
©The Author(s) 2019.
World J Gastroenterol. Jul 7, 2019; 25(25): 3207-3217
Published online Jul 7, 2019. doi: 10.3748/wjg.v25.i25.3207
Published online Jul 7, 2019. doi: 10.3748/wjg.v25.i25.3207
Figure 1 Photographs of the fully opened silicon coated magnesium-stent (A) and molecular formula of cross-linked silica gel (B).
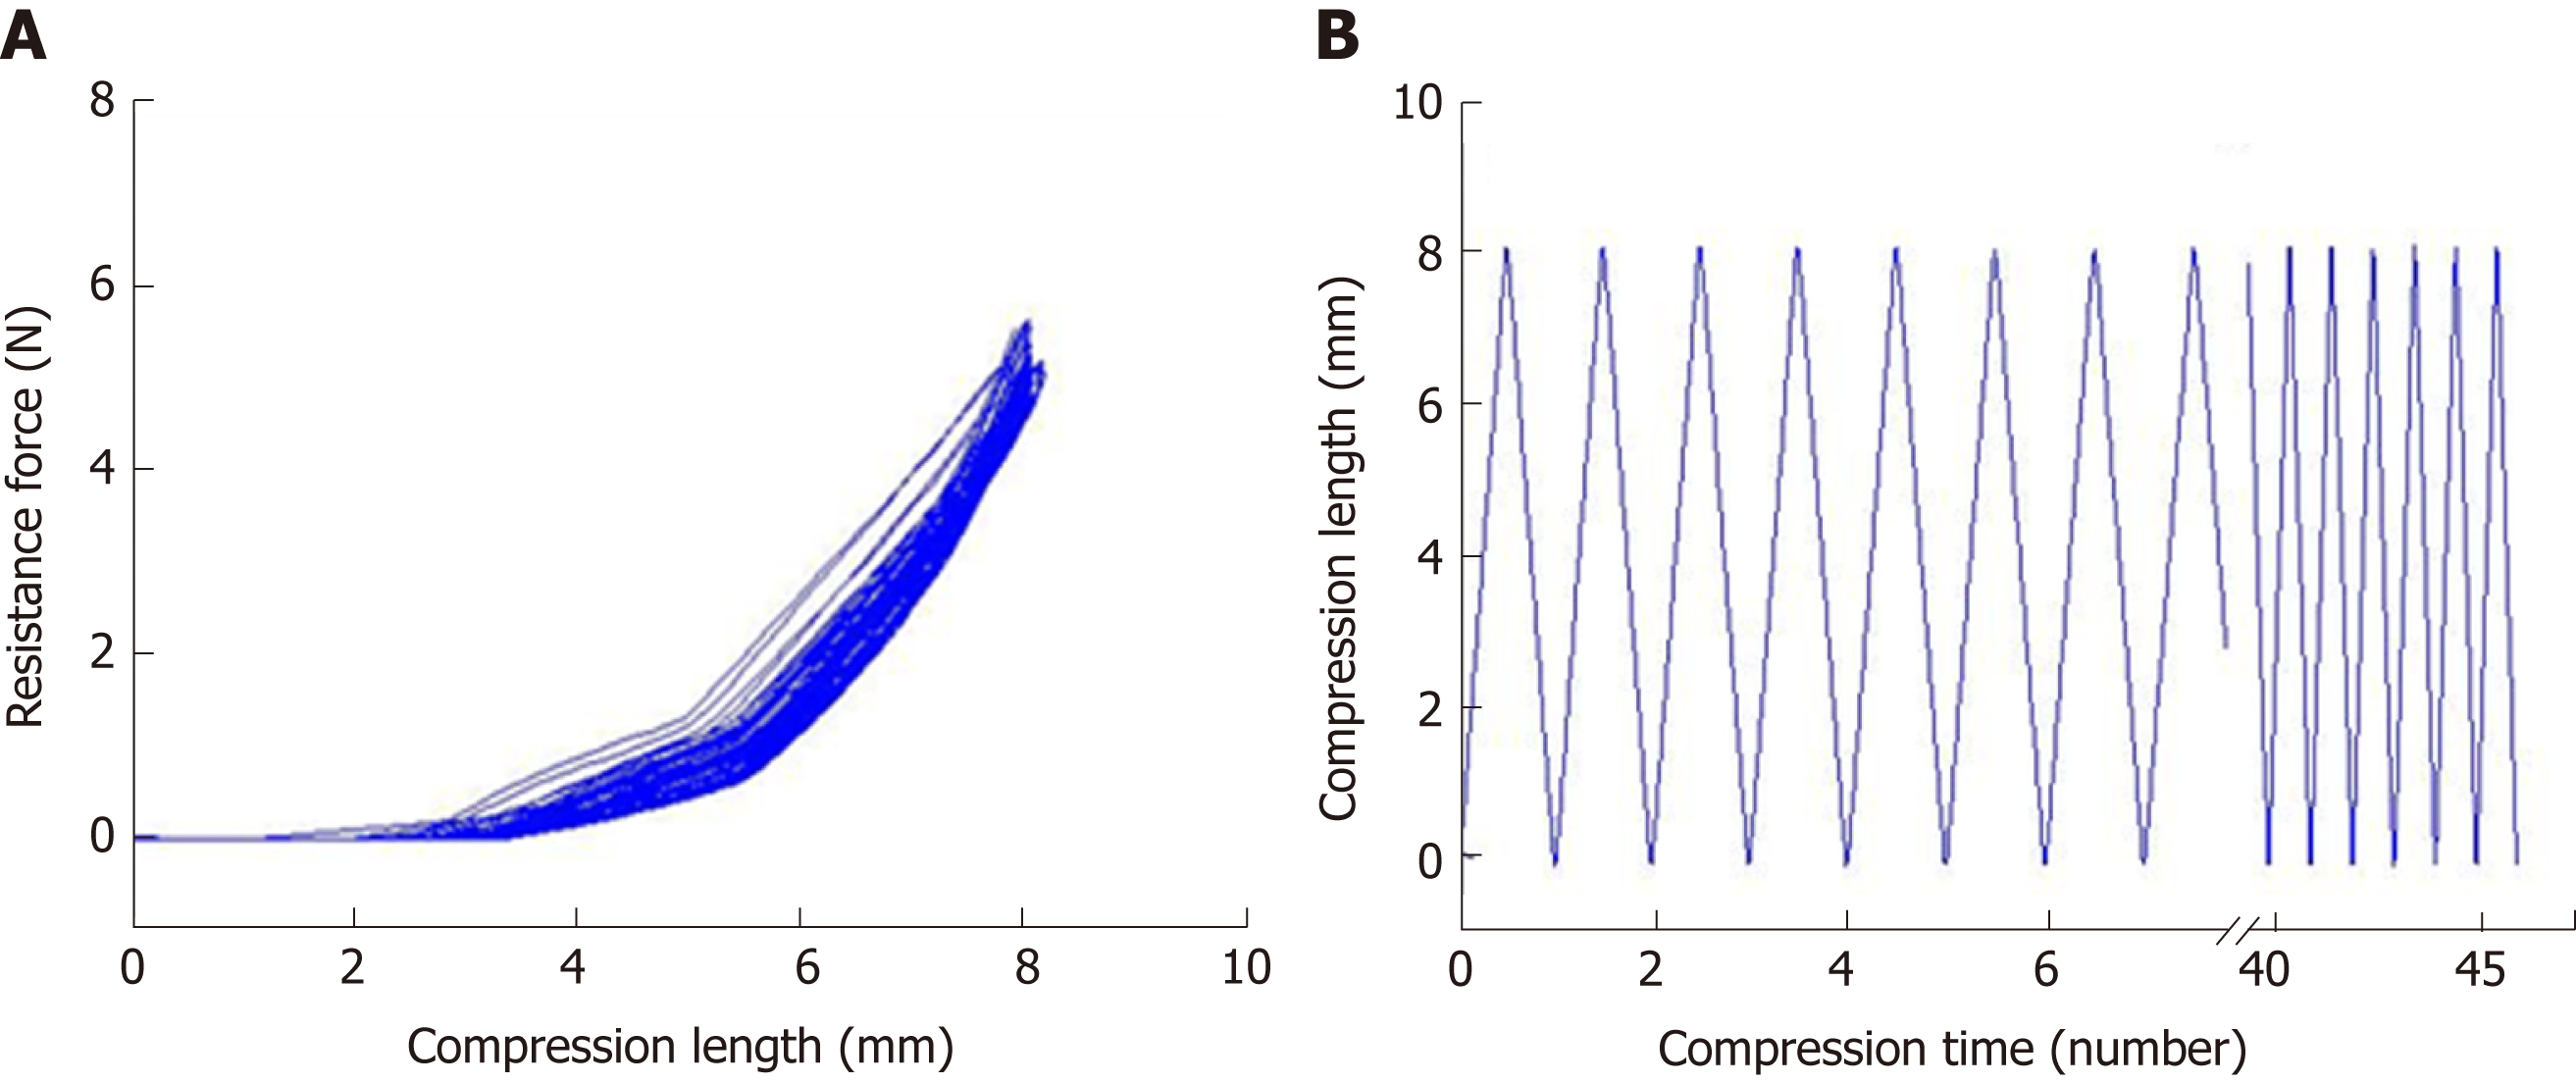
Figure 2 Evaluation of the mechanical properties of the silicone-coated magnesium stent.
A: Mechanical compression curve analysis of the stent; B: compression-recovery curves of length and time in repeated compression tests (n = 5, constant pressure = 10 N).
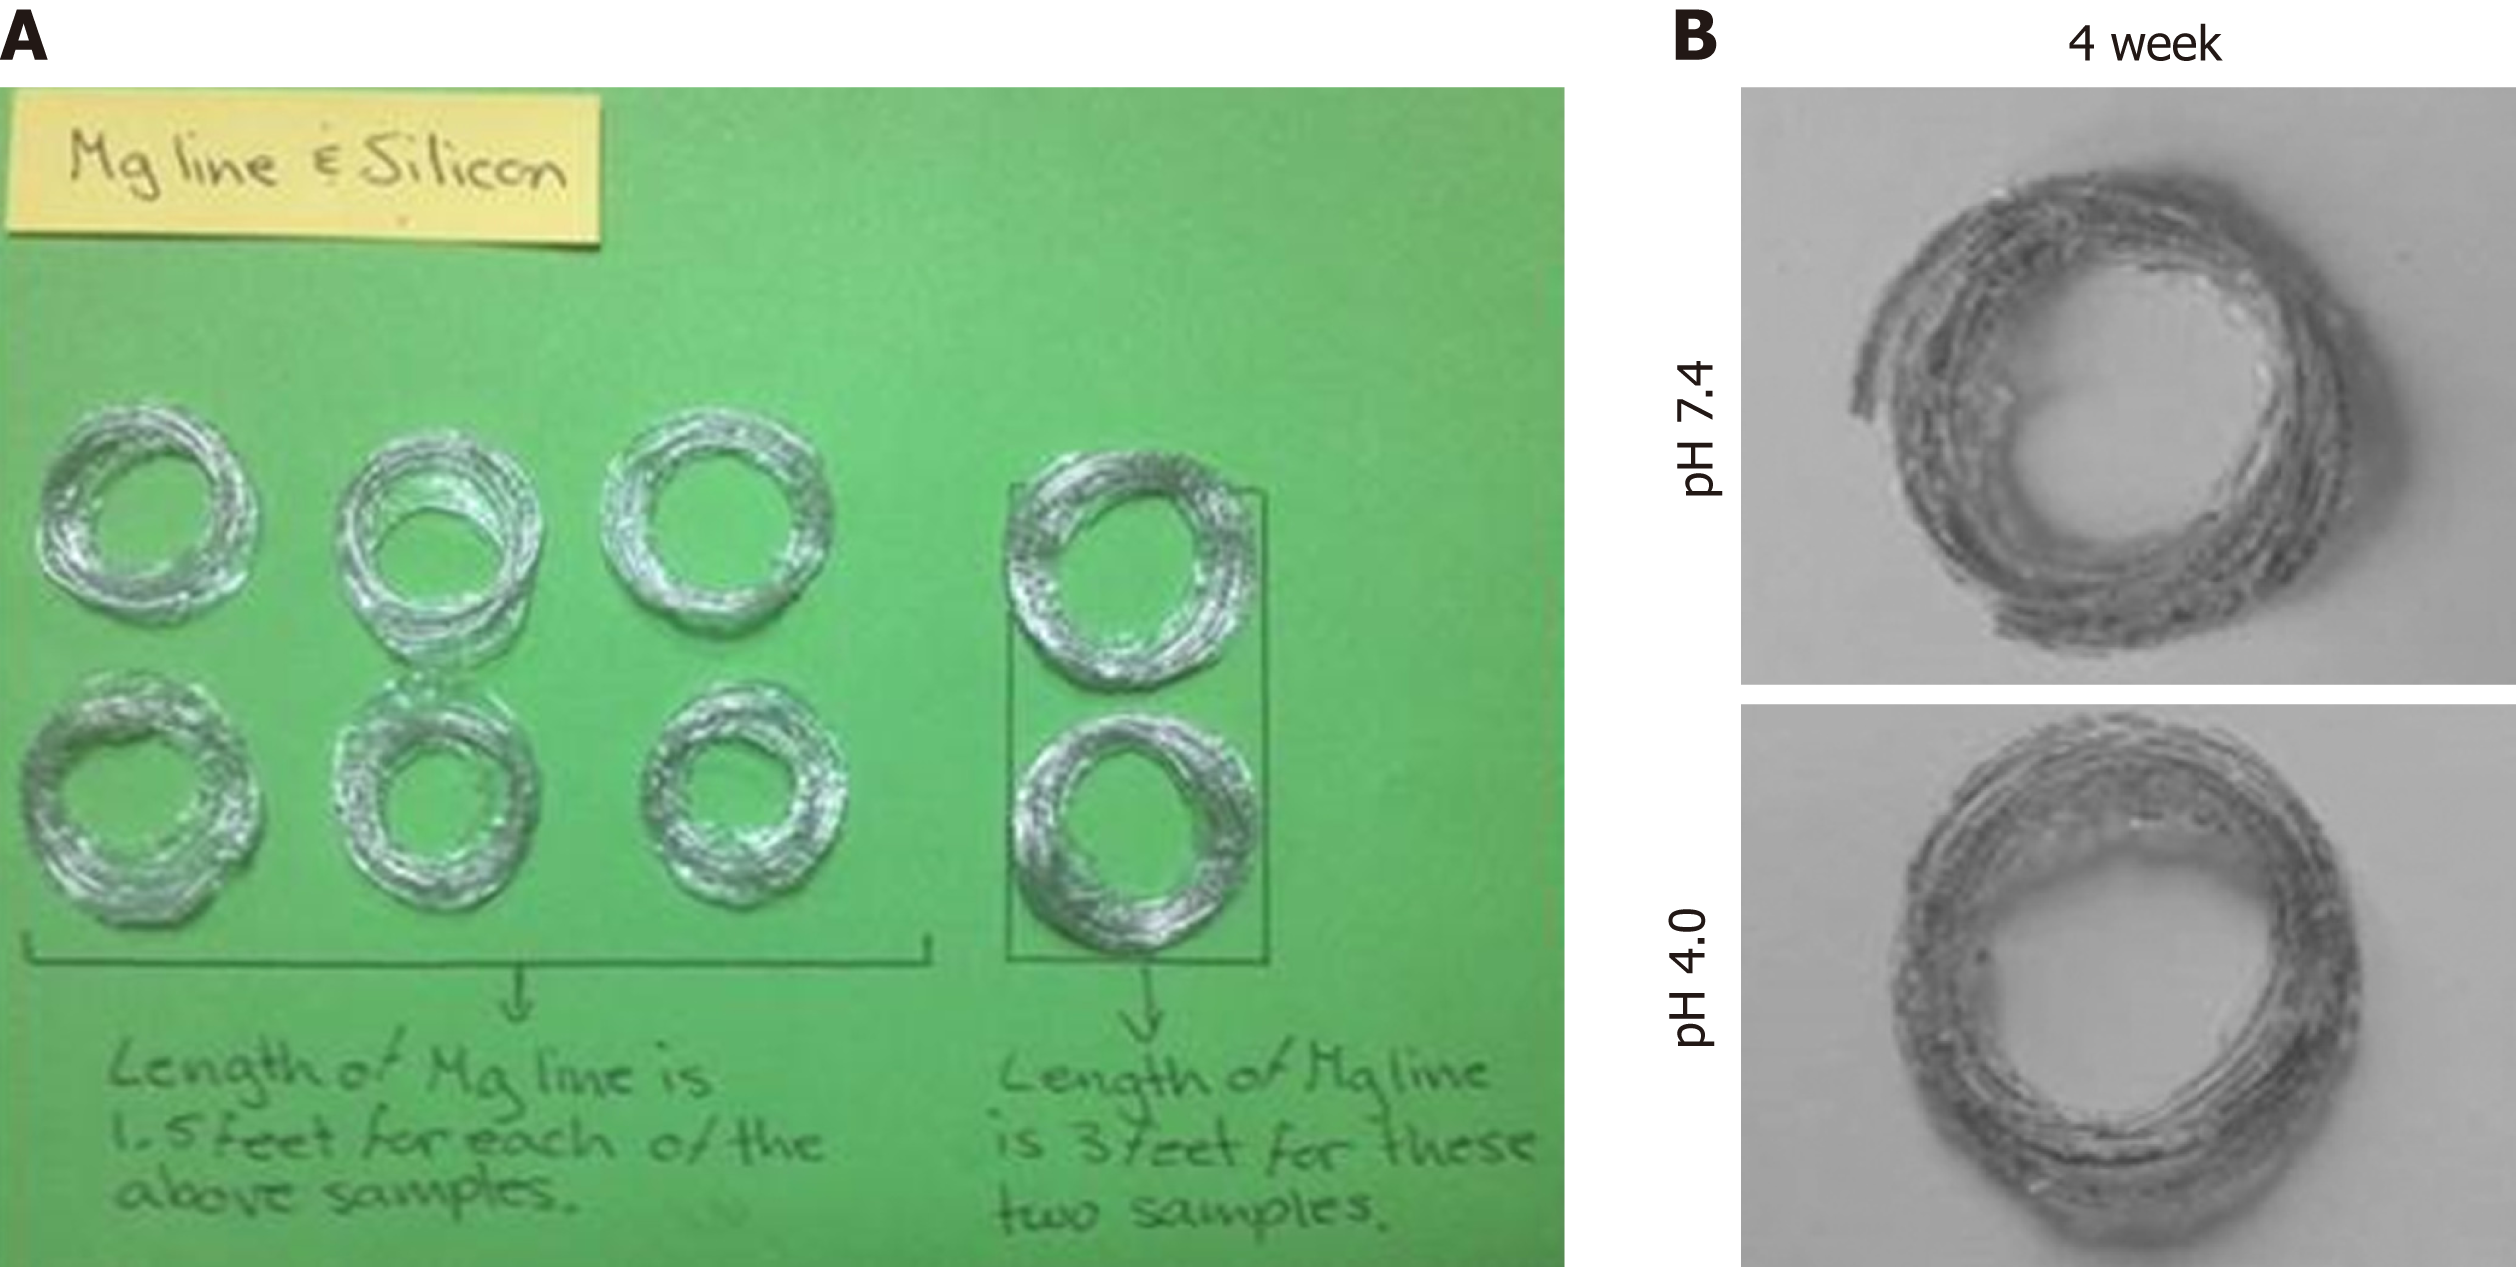
Figure 3 Evaluation of the degradation behaviors of the magnesium alloy wire.
A: Topography of magnesium alloy wire with indicated length (left, 1.5 feet; and right, 3 feet); B and C: Degradation topography of magnesium alloy wire at 4 weeks after incubation in phosphate-buffered saline with pH values of 7.4 (B) and 4.0 (C).
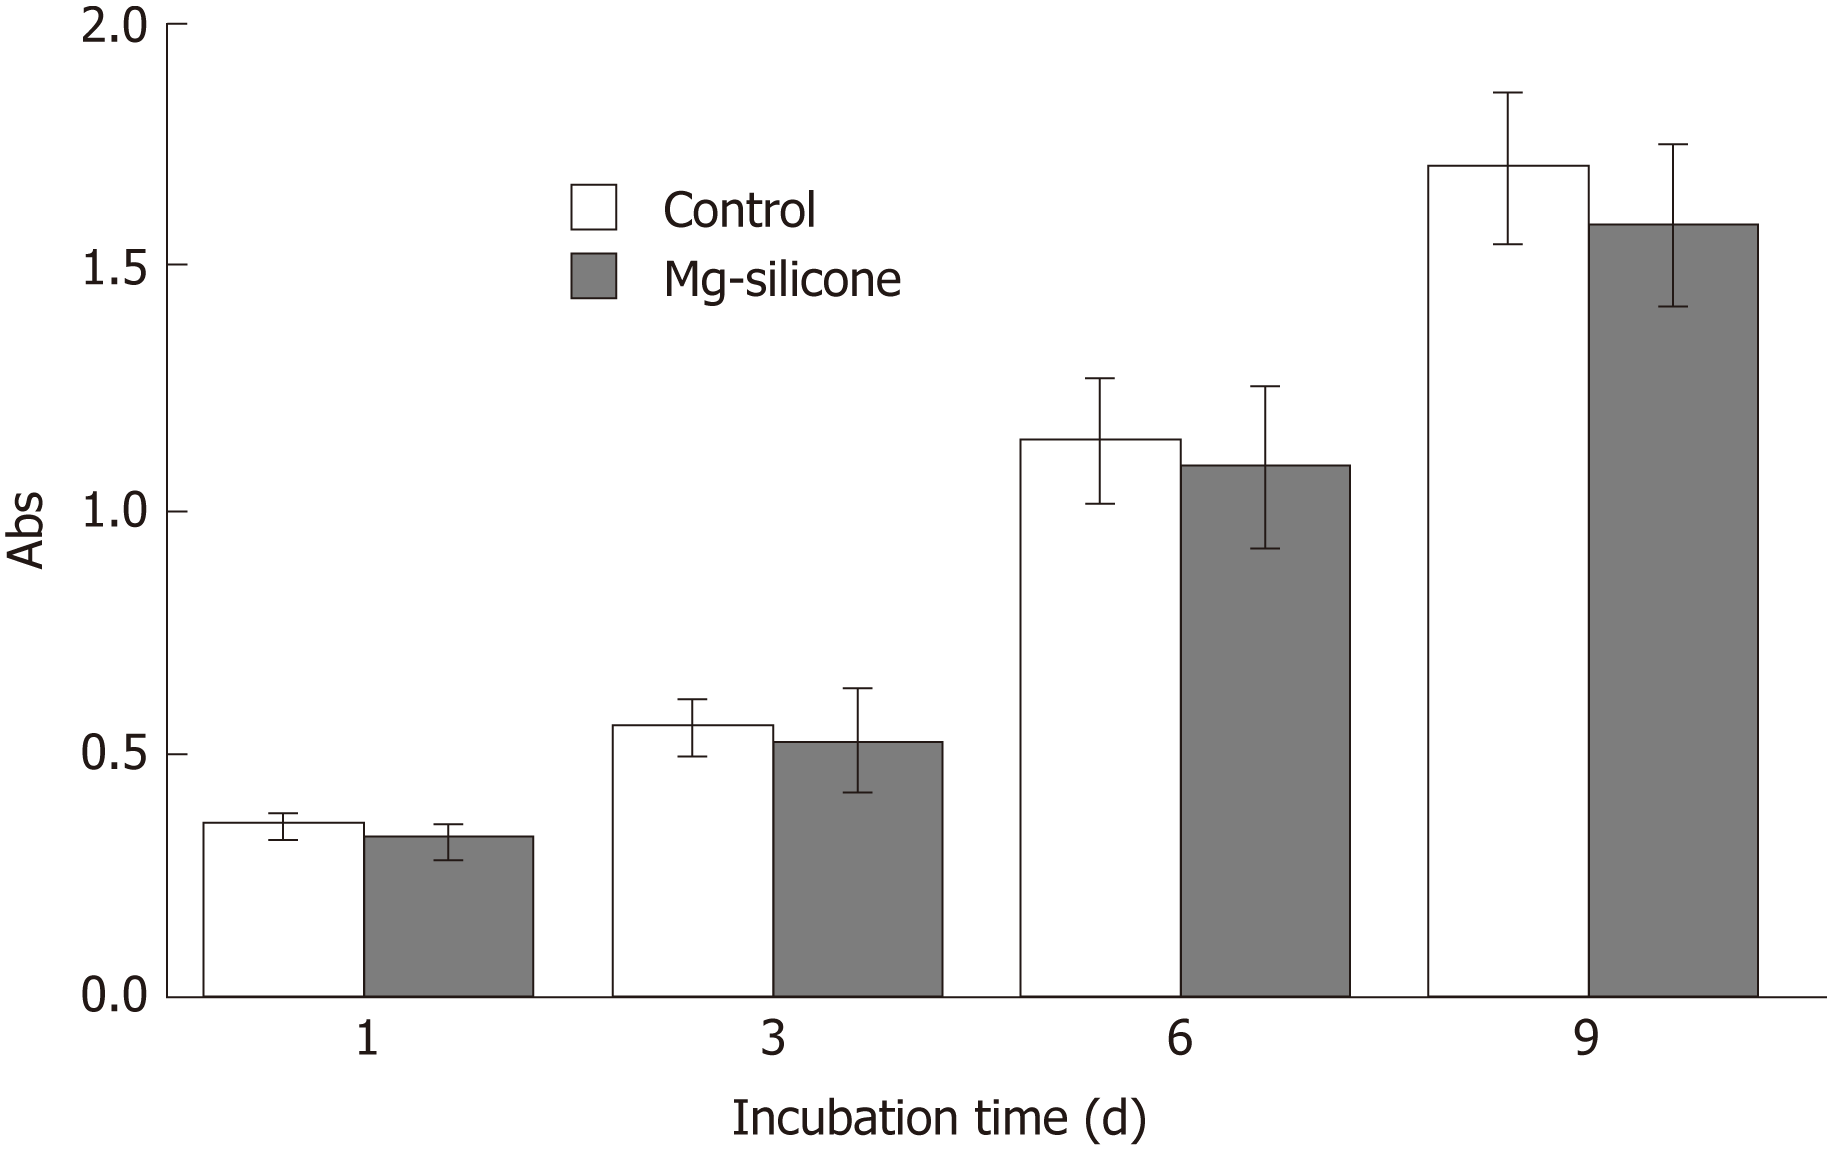
Figure 4 Biological safety evaluation of the magnesium-silicone material by testing the impact on proliferation of human smooth muscle cells.
Smooth muscle cells were cultured in the presence and absence of silicone-magnesium gel, and cell proliferation was assayed at 1, 3, 6, and 9 d after culturing (n = 3 for each group at each time point). Control, cultured without silicon-magnesium gel; Mg-silicone, cultured with silicone-magnesium gel.
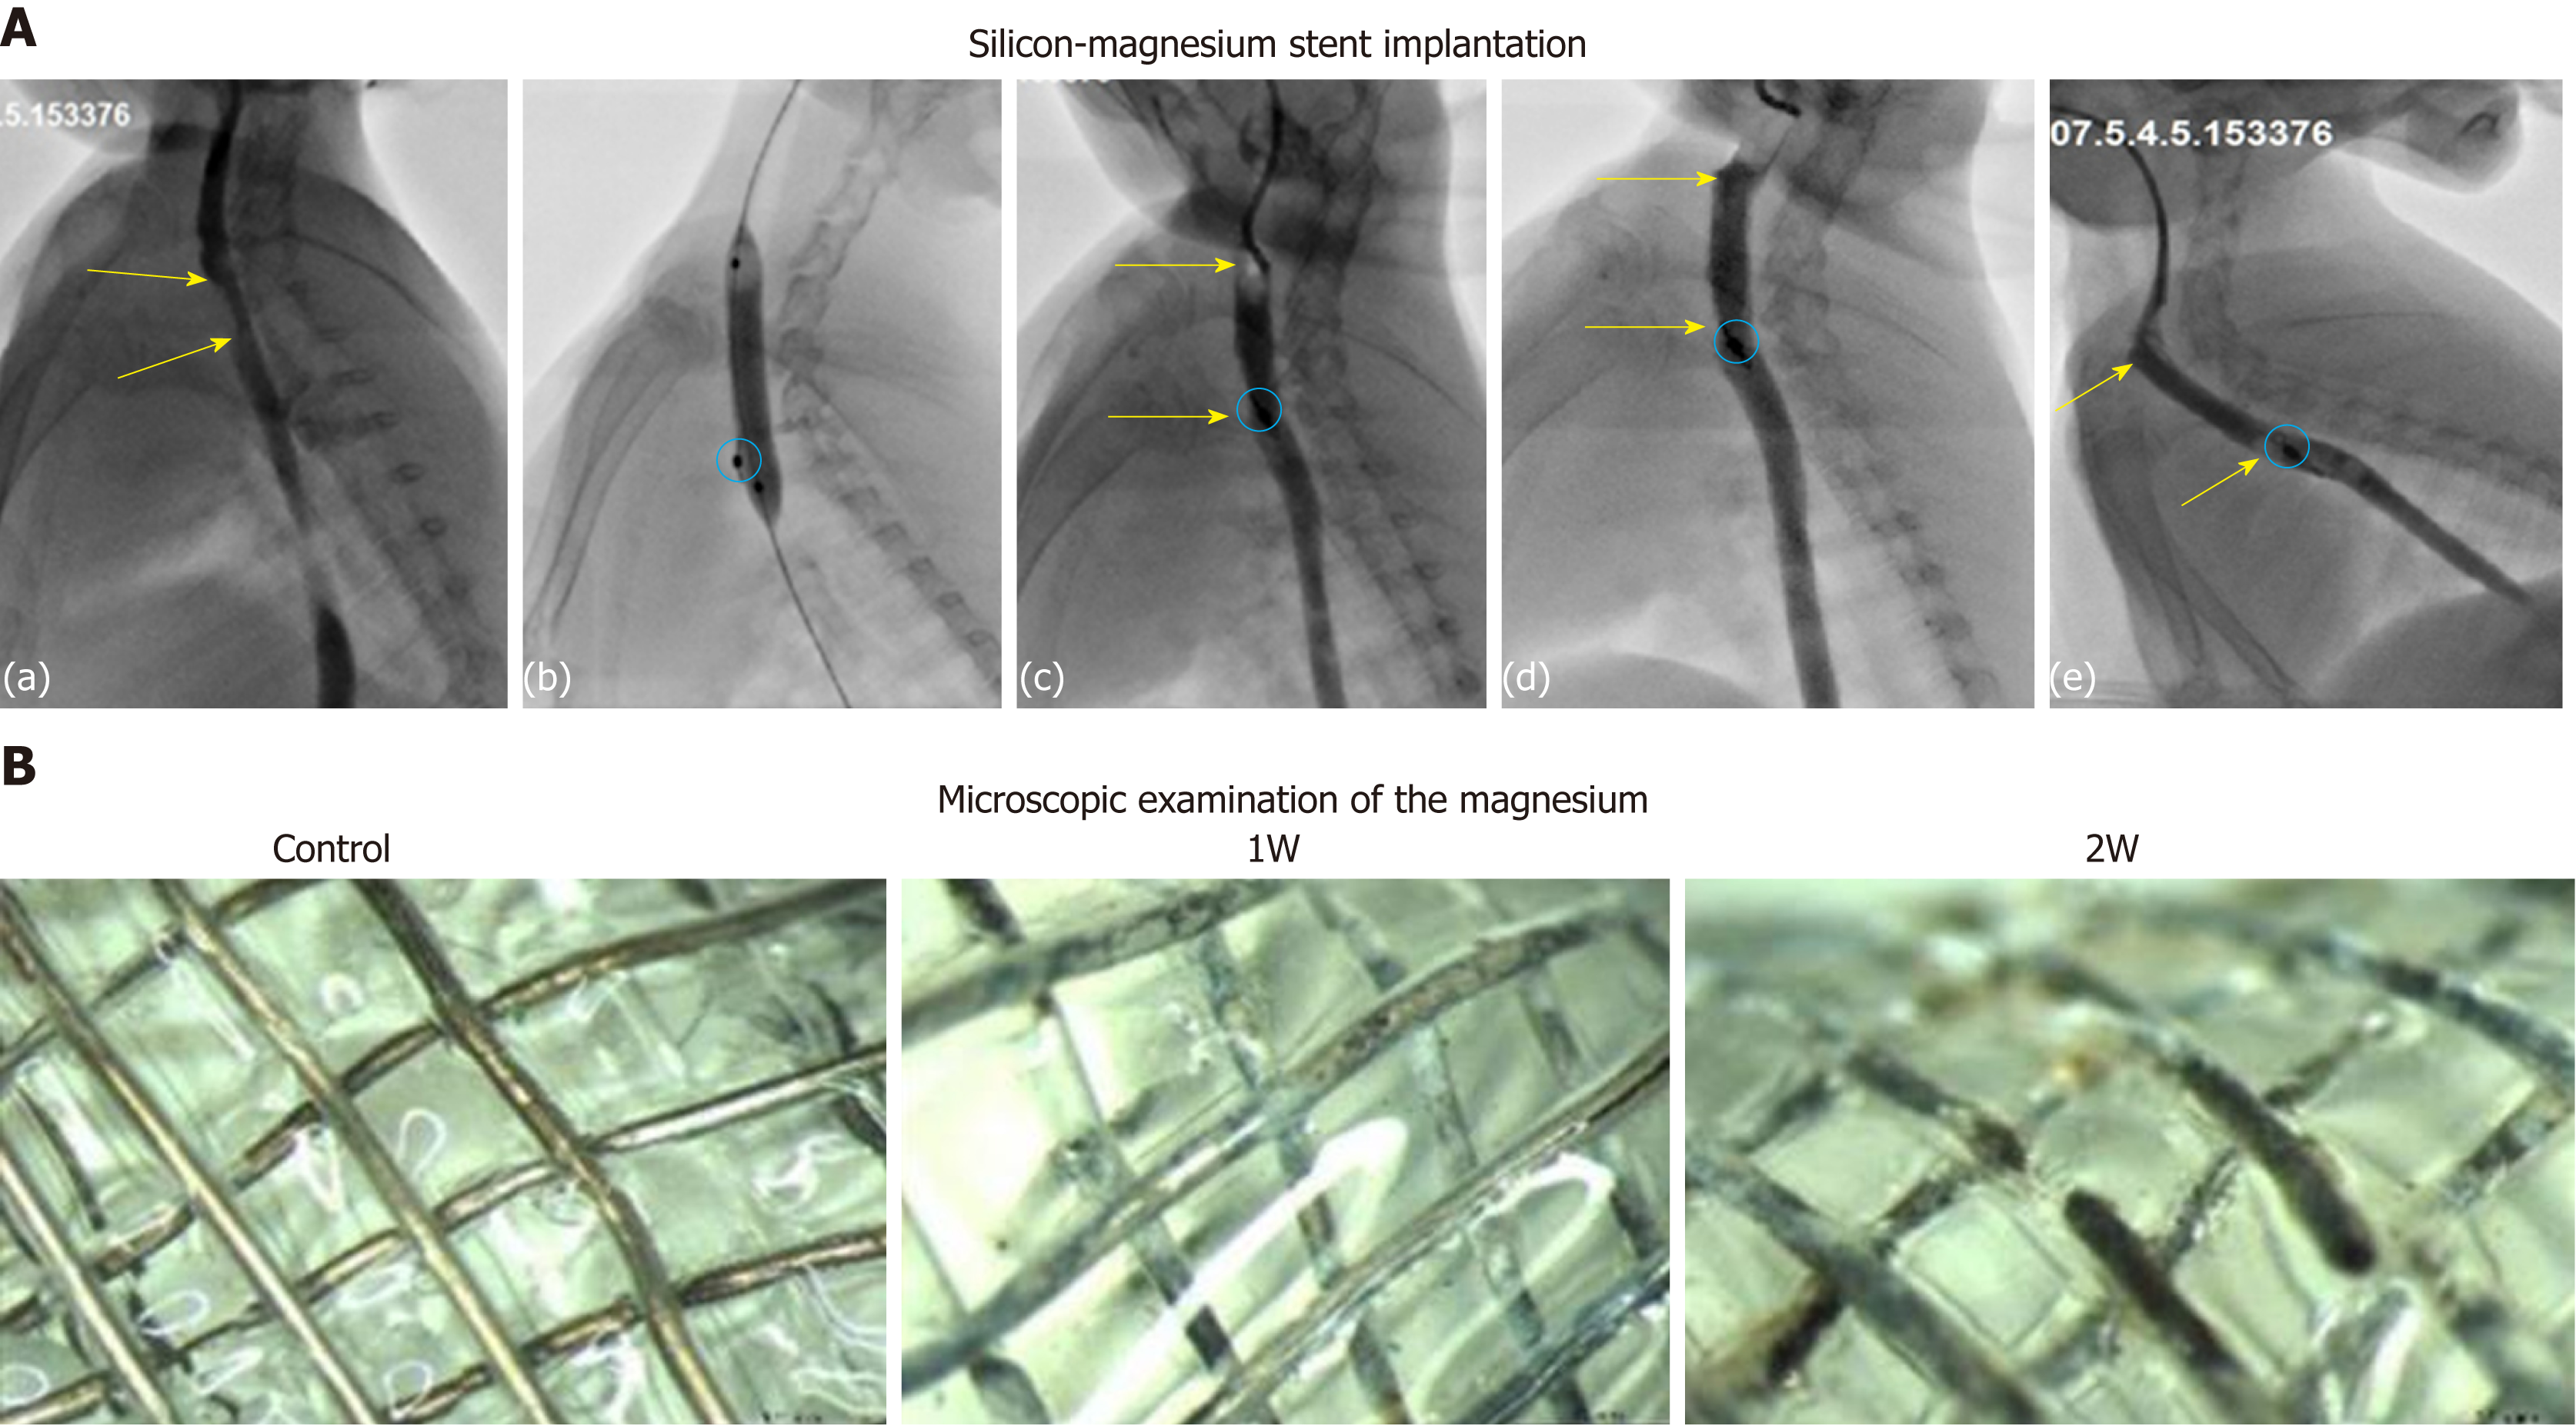
Figure 5 Implantation, follow-up, and in vivo degradation of silicone-coated magnesium stents.
A: Representative esophagography images show the procedure of stent insertion in rabbits. (a) Upper-middle esophageal stenosis (yellow arrow); (b) Balloon expansion before stent implantation; (c) Esophagography after stent implantation. Stenotic esophagus expansion and in place (yellow arrow) are shown, and positioning mark in the bottom of stent is clearly visible (red oval); (d-e) Follow-up at 1 wk (d) and 2 wk (e) after stent insertion. Stenotic esophagus expansion and in place (yellow arrow) are shown, with positioning mark clearly visible (red oval). B: Microscopic examination of the magnesium to track its retention before (control) and at 1 wk (1W) and 2 wk (2W) after stent implantation.
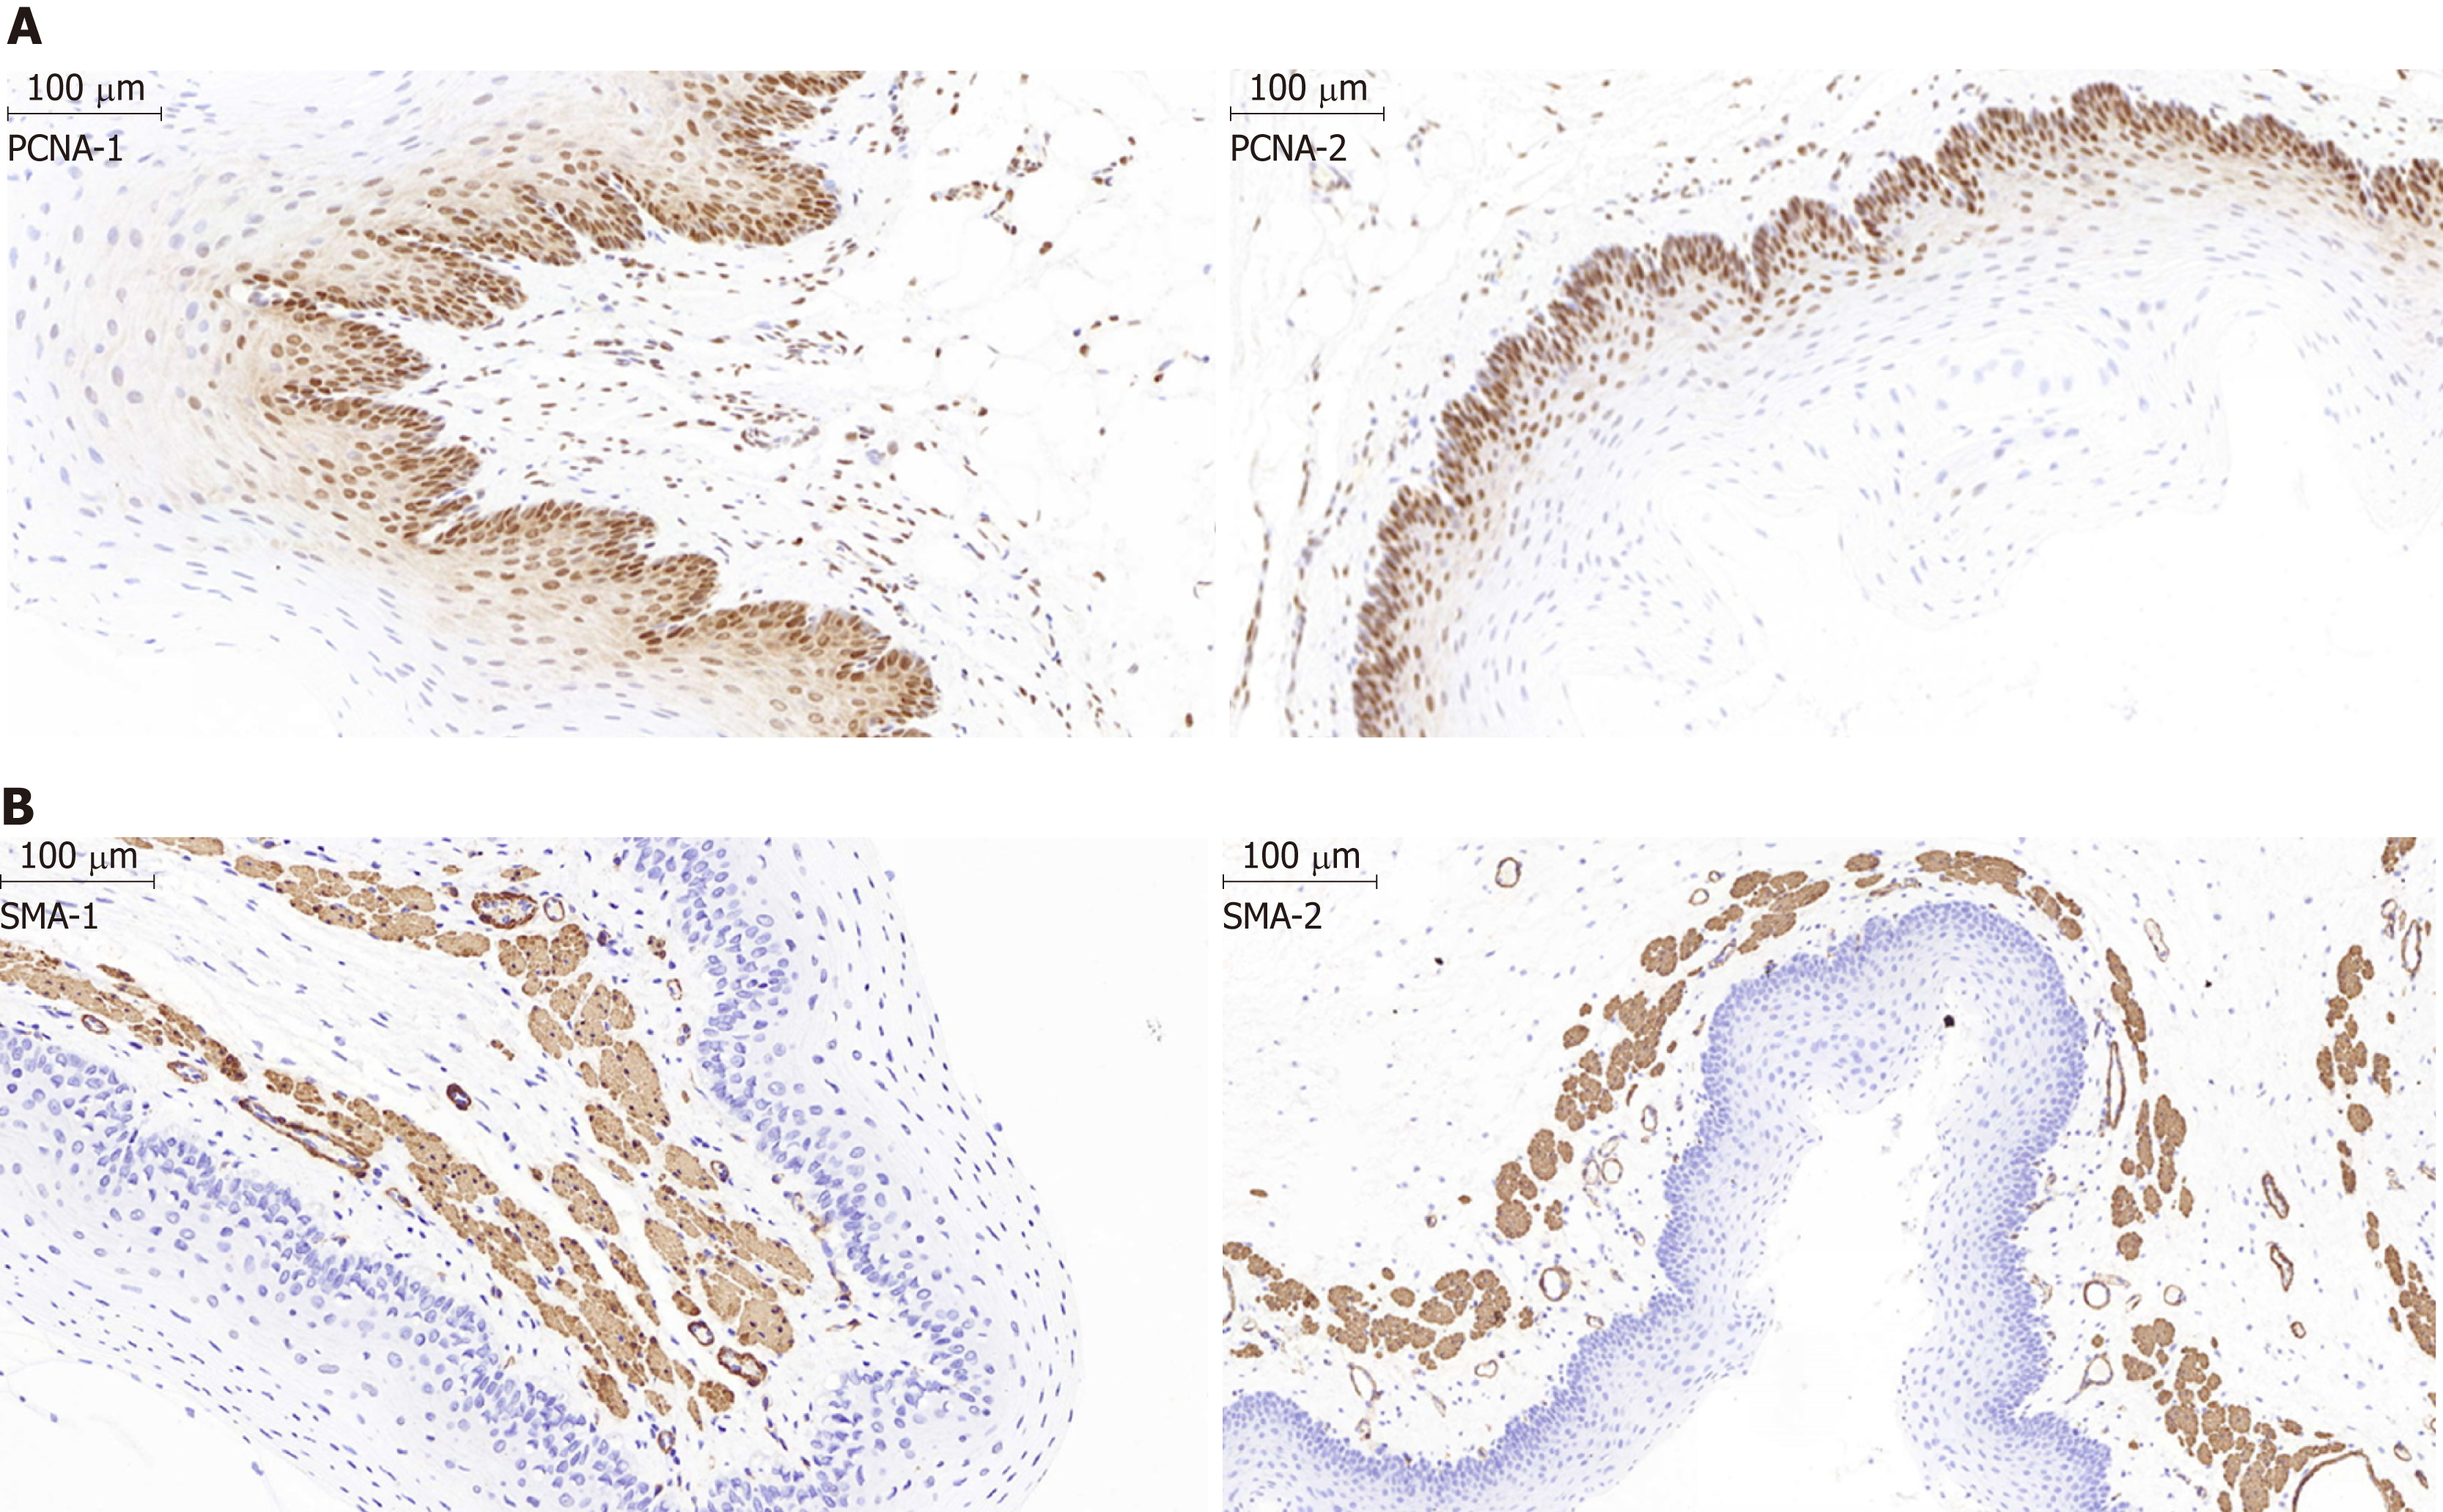
Figure 6 Histological examination of the epithelial layer and the α-smooth muscle layer of the esophagus after stent insertion.
A: Representative images show the proliferating cell nuclear antigen (PCNA) staining in the epithelial layer of the esophagus from the stent group and the normal control group. The percentage of PCNA-positive proliferating cells in the epithelial layer in the control group (PCNA-1) was similar to that in the magnesium-silicone stent group (PCNA-2) (magnification, ×100). B: Representative images showing the α-smooth muscle (SMA) staining. The thickness of the epithelial and SMA-positive layers did not differ between the normal control group (SMA-1) and magnesium-silicone stent group (SMA-2) (magnification, ×200).
- Citation: Yang K, Cao J, Yuan TW, Zhu YQ, Zhou B, Cheng YS. Silicone-covered biodegradable magnesium stent for treating benign esophageal stricture in a rabbit model. World J Gastroenterol 2019; 25(25): 3207-3217
- URL: https://www.wjgnet.com/1007-9327/full/v25/i25/3207.htm
- DOI: https://dx.doi.org/10.3748/wjg.v25.i25.3207


