Copyright
©The Author(s) 2019.
World J Gastroenterol. Jun 21, 2019; 25(23): 2961-2972
Published online Jun 21, 2019. doi: 10.3748/wjg.v25.i23.2961
Published online Jun 21, 2019. doi: 10.3748/wjg.v25.i23.2961
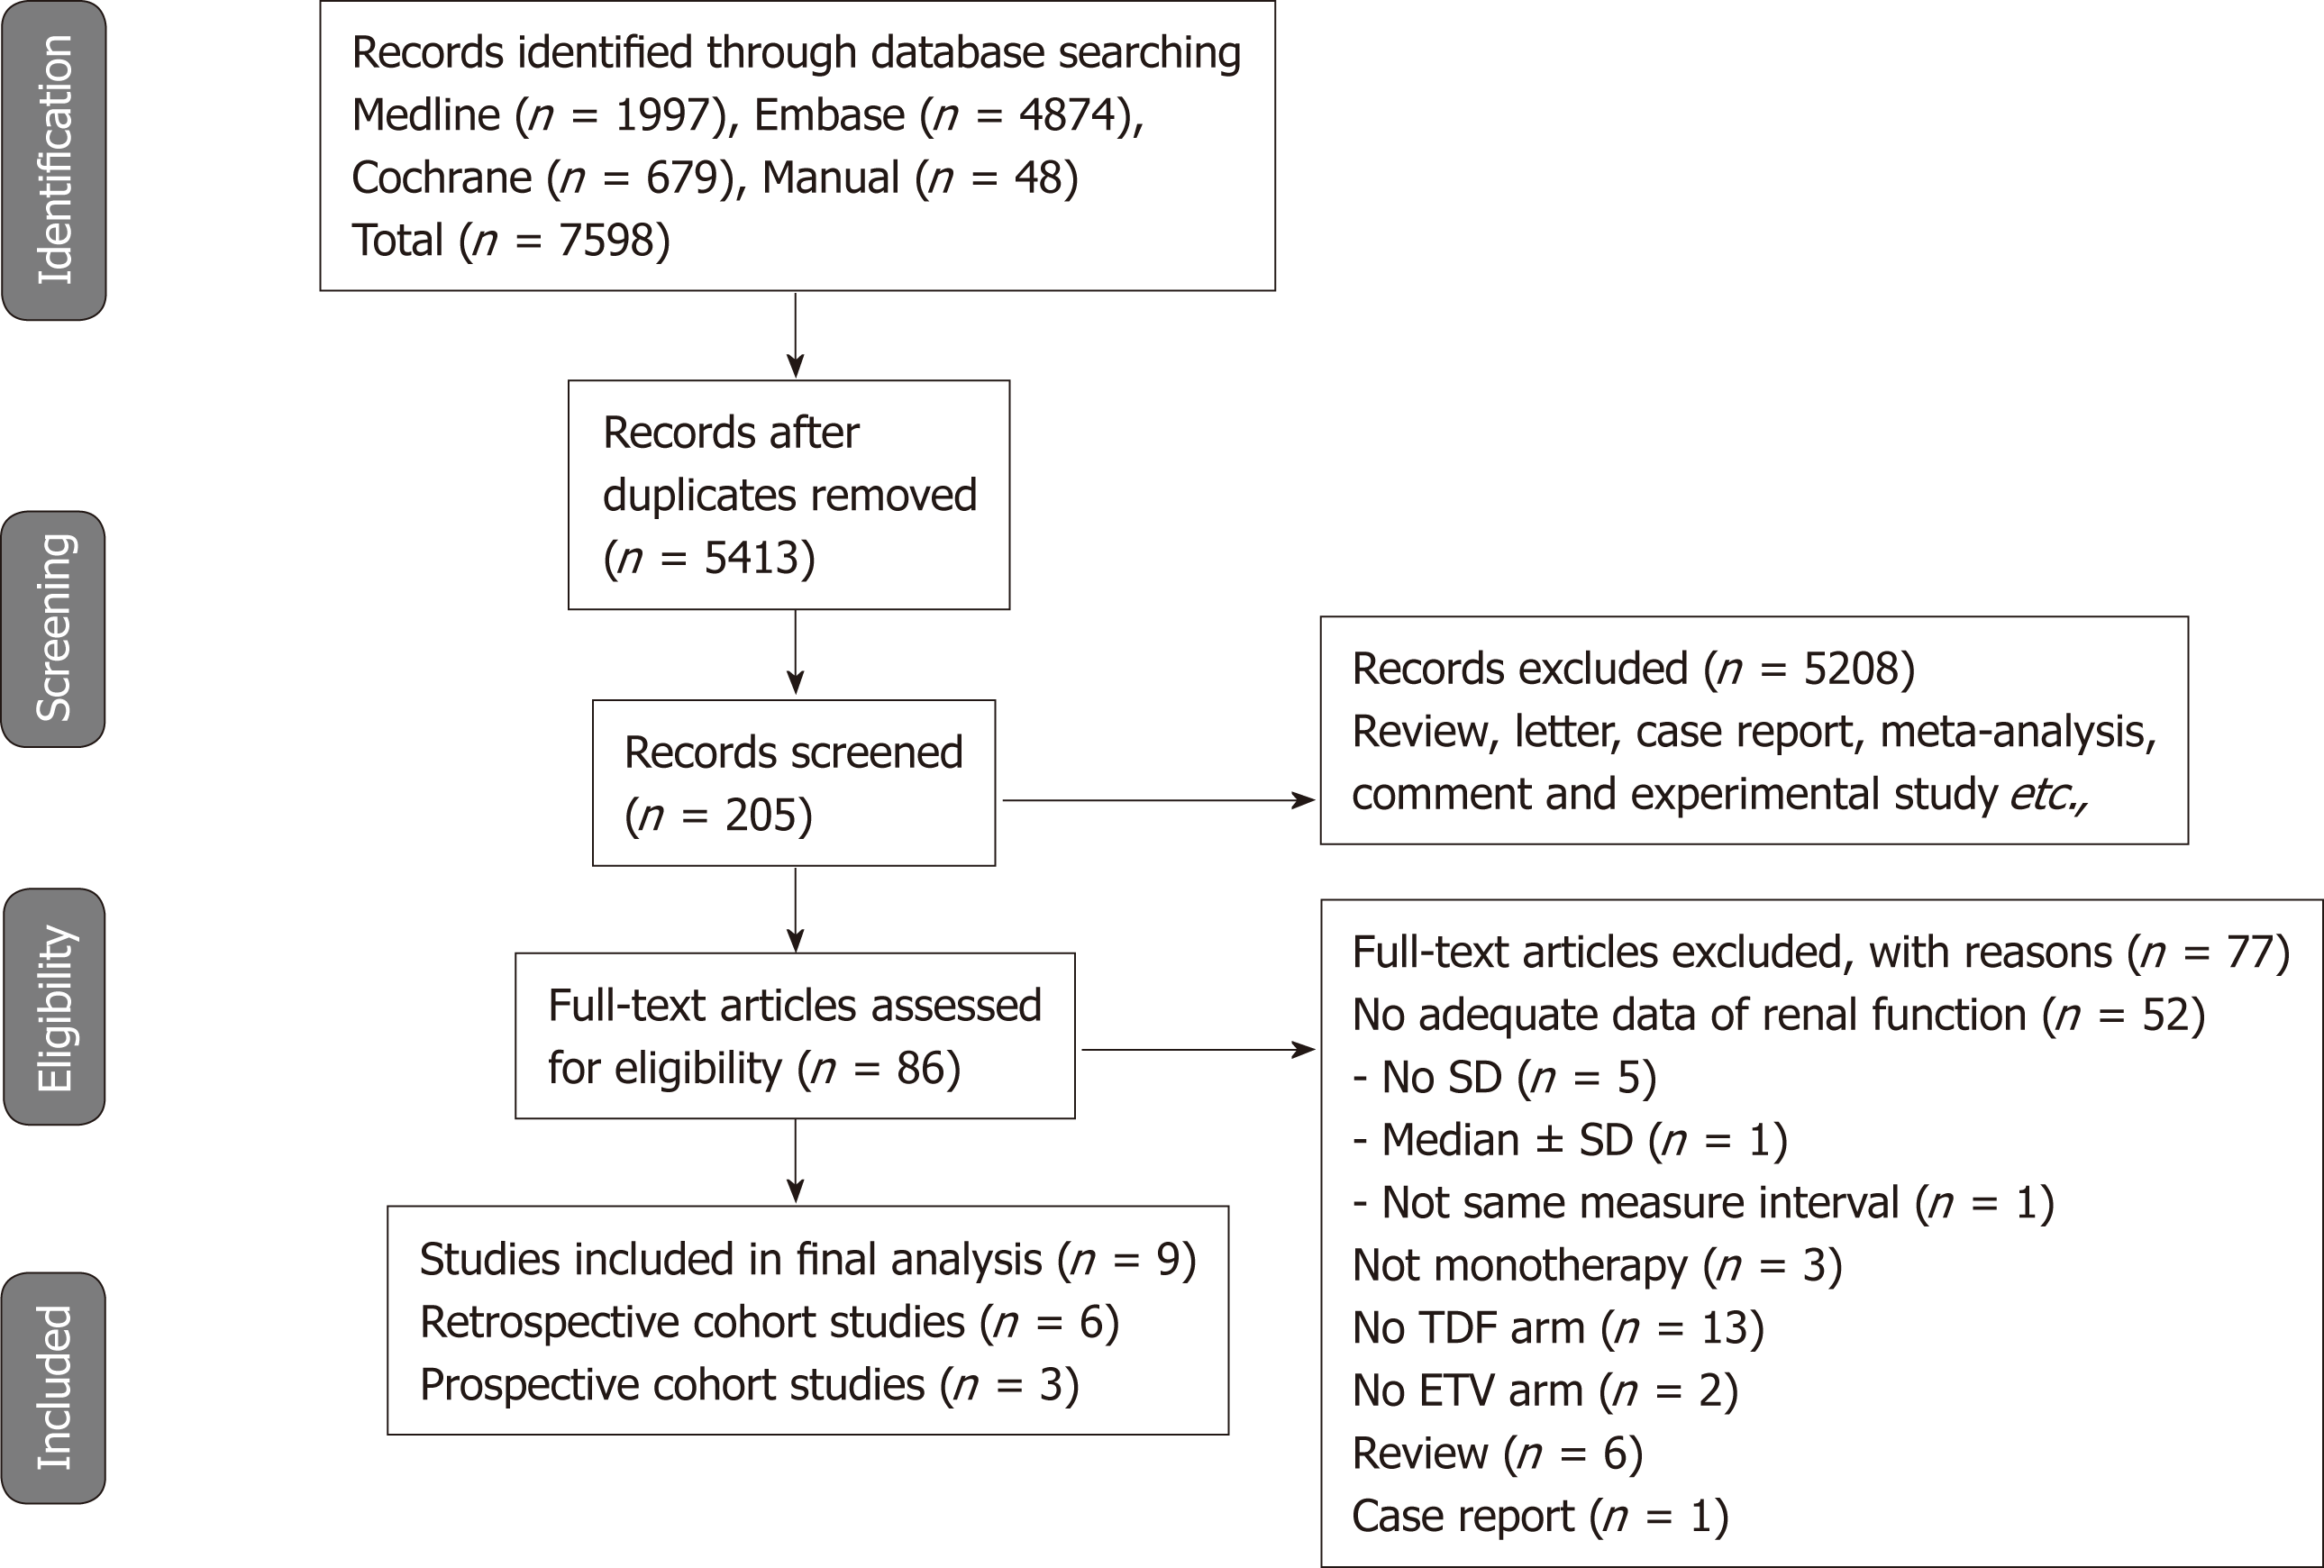
Figure 1 PRISMA diagram of the literature search.
TDF: Tenofovir; ETV: Entecavir; SD: Standard deviation.
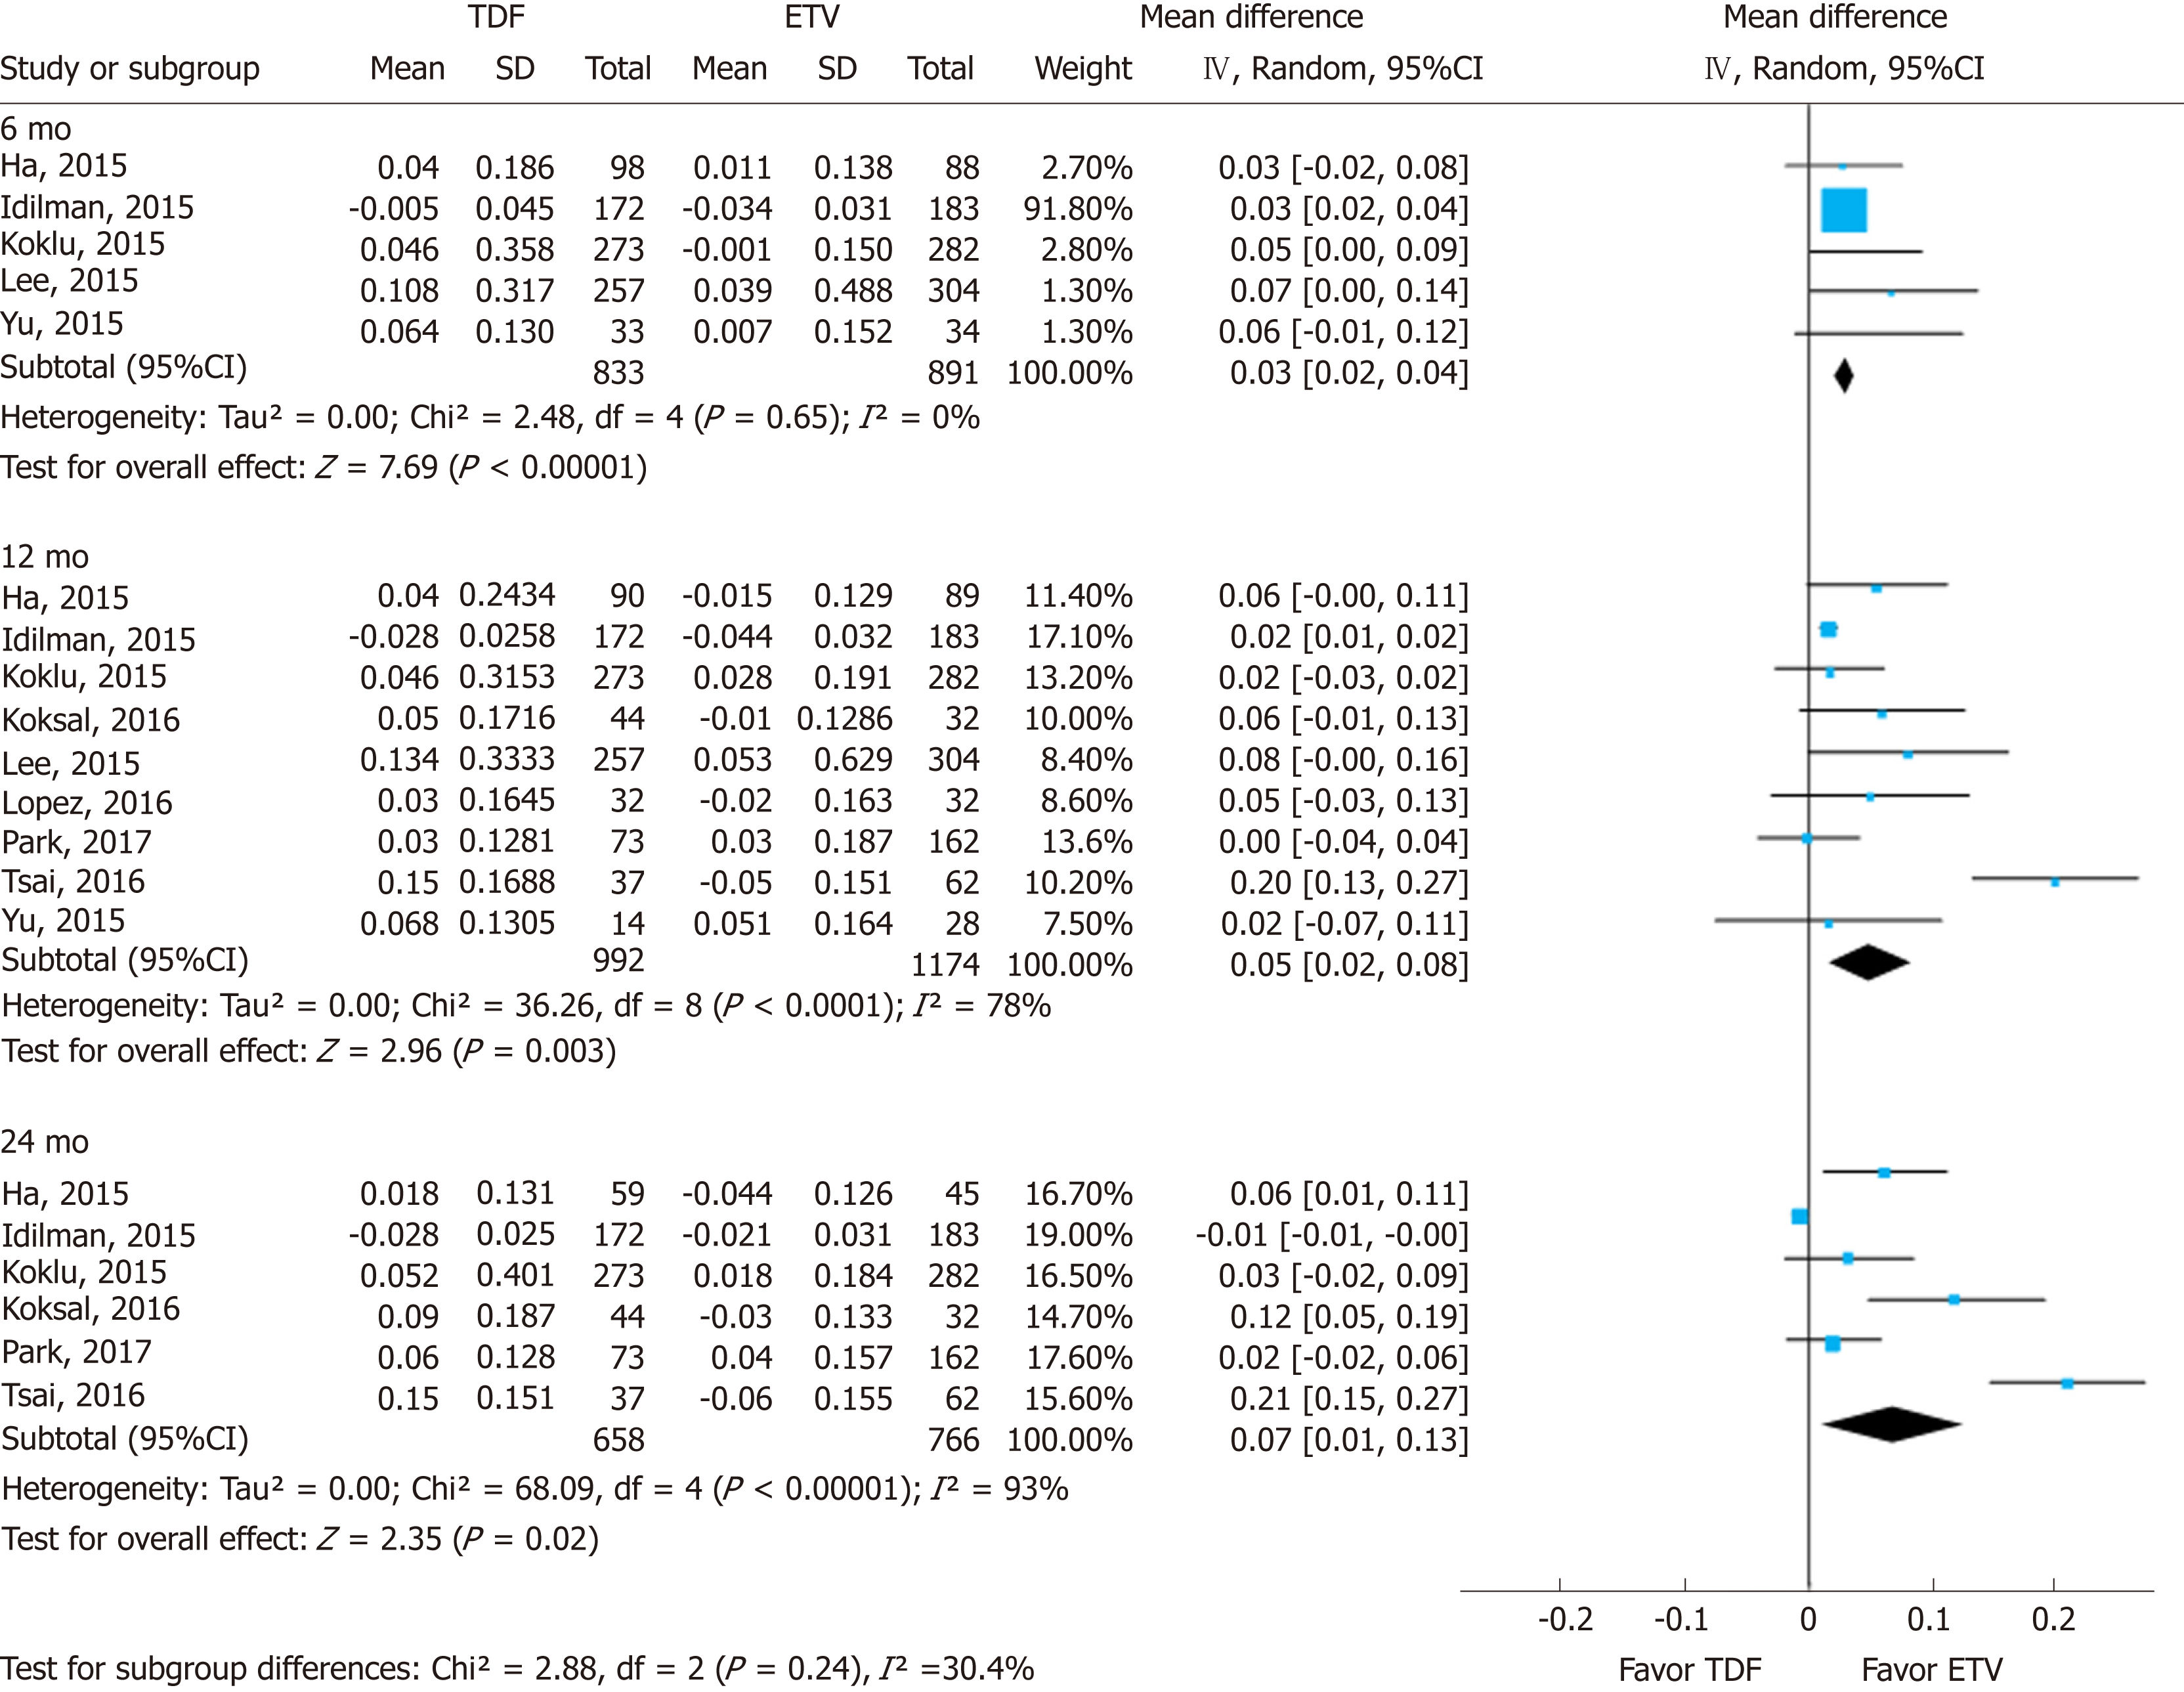
Figure 2 Forest plot for the change of serum creatinine.
In each enrolled study, the change (between post-treatment and baseline) is calculated in each arm [tenofovir (TDF) vs entecavir (ETV)]. The difference in mean change between the two changes (δ TDF - δ ETV) is then calculated. TDF: Tenofovir; ETV: Entecavir; SD: Standard deviation; CI: Confidence interval.
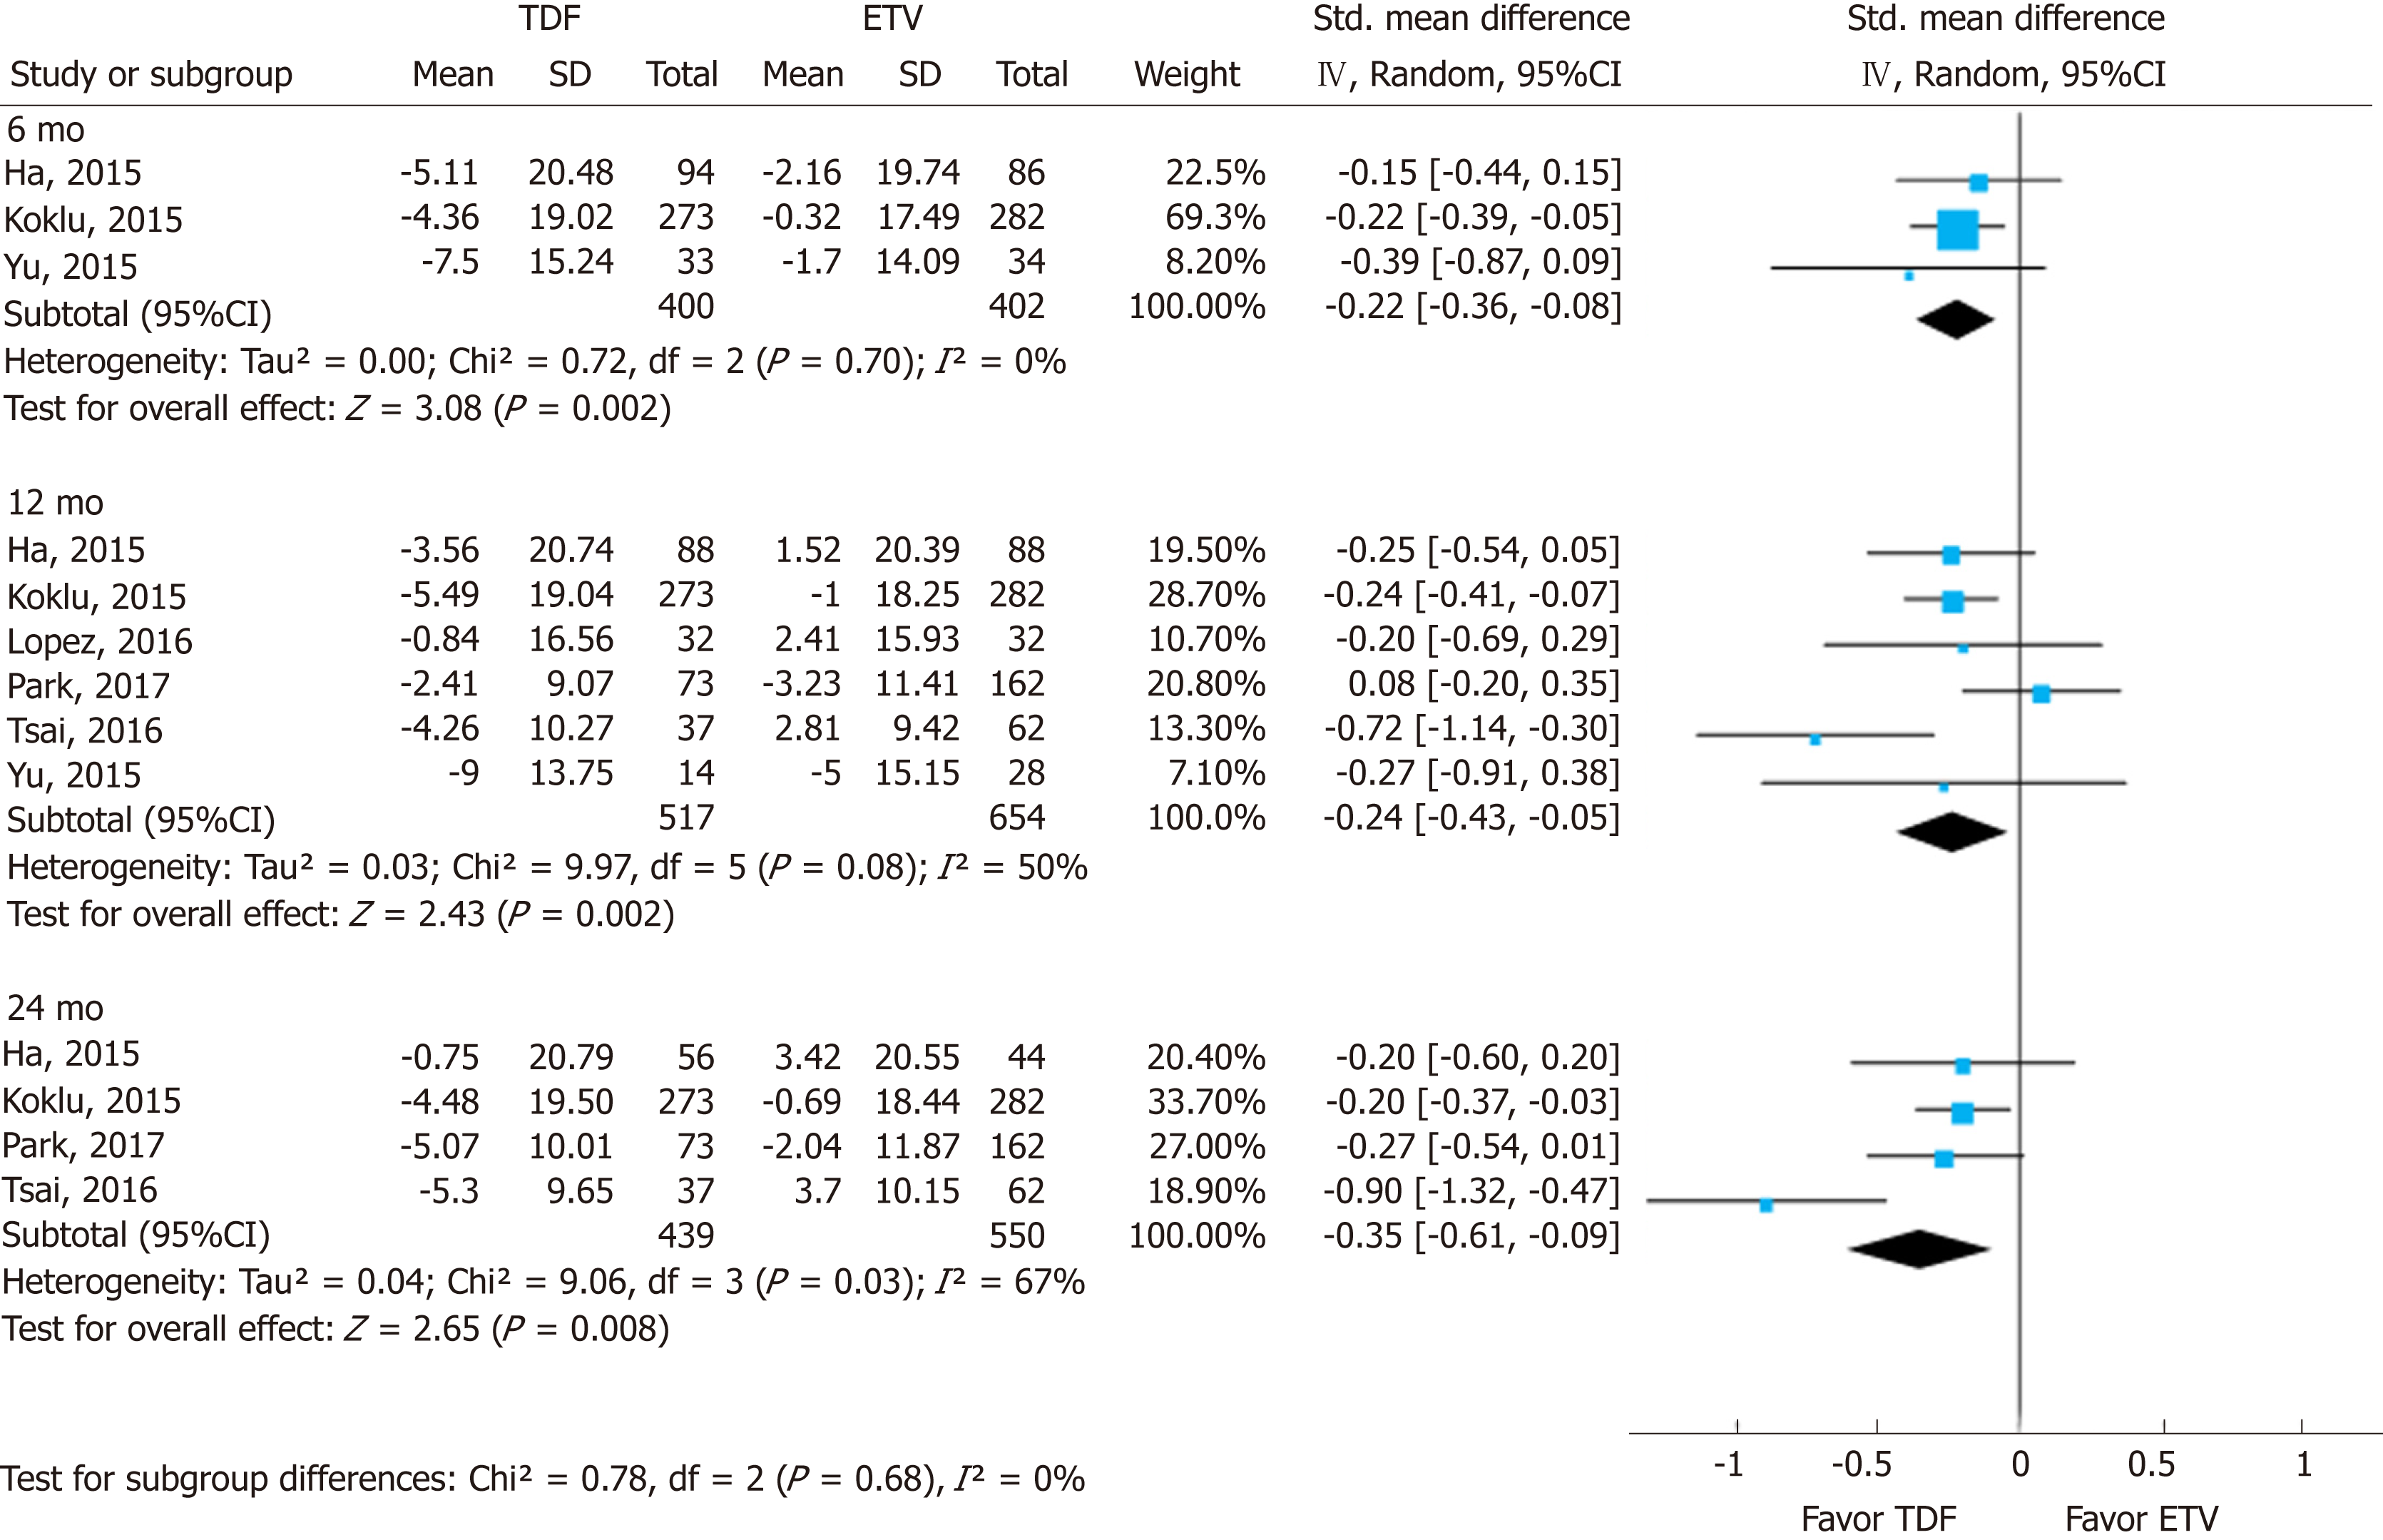
Figure 3 Forest plot for the change of estimated glomerular filtration rate.
In each enrolled study, the change (between post-treatment and baseline) is calculated in each arm [tenofovir (TDF) vs entecavir (ETV)]. The difference in standardized mean change between the two changes (δ TDF - δ ETV) is then calculated, since each study utilized different formulas. TDF: Tenofovir; ETV: Entecavir; SD: Standard deviation; CI: Confidence interval.
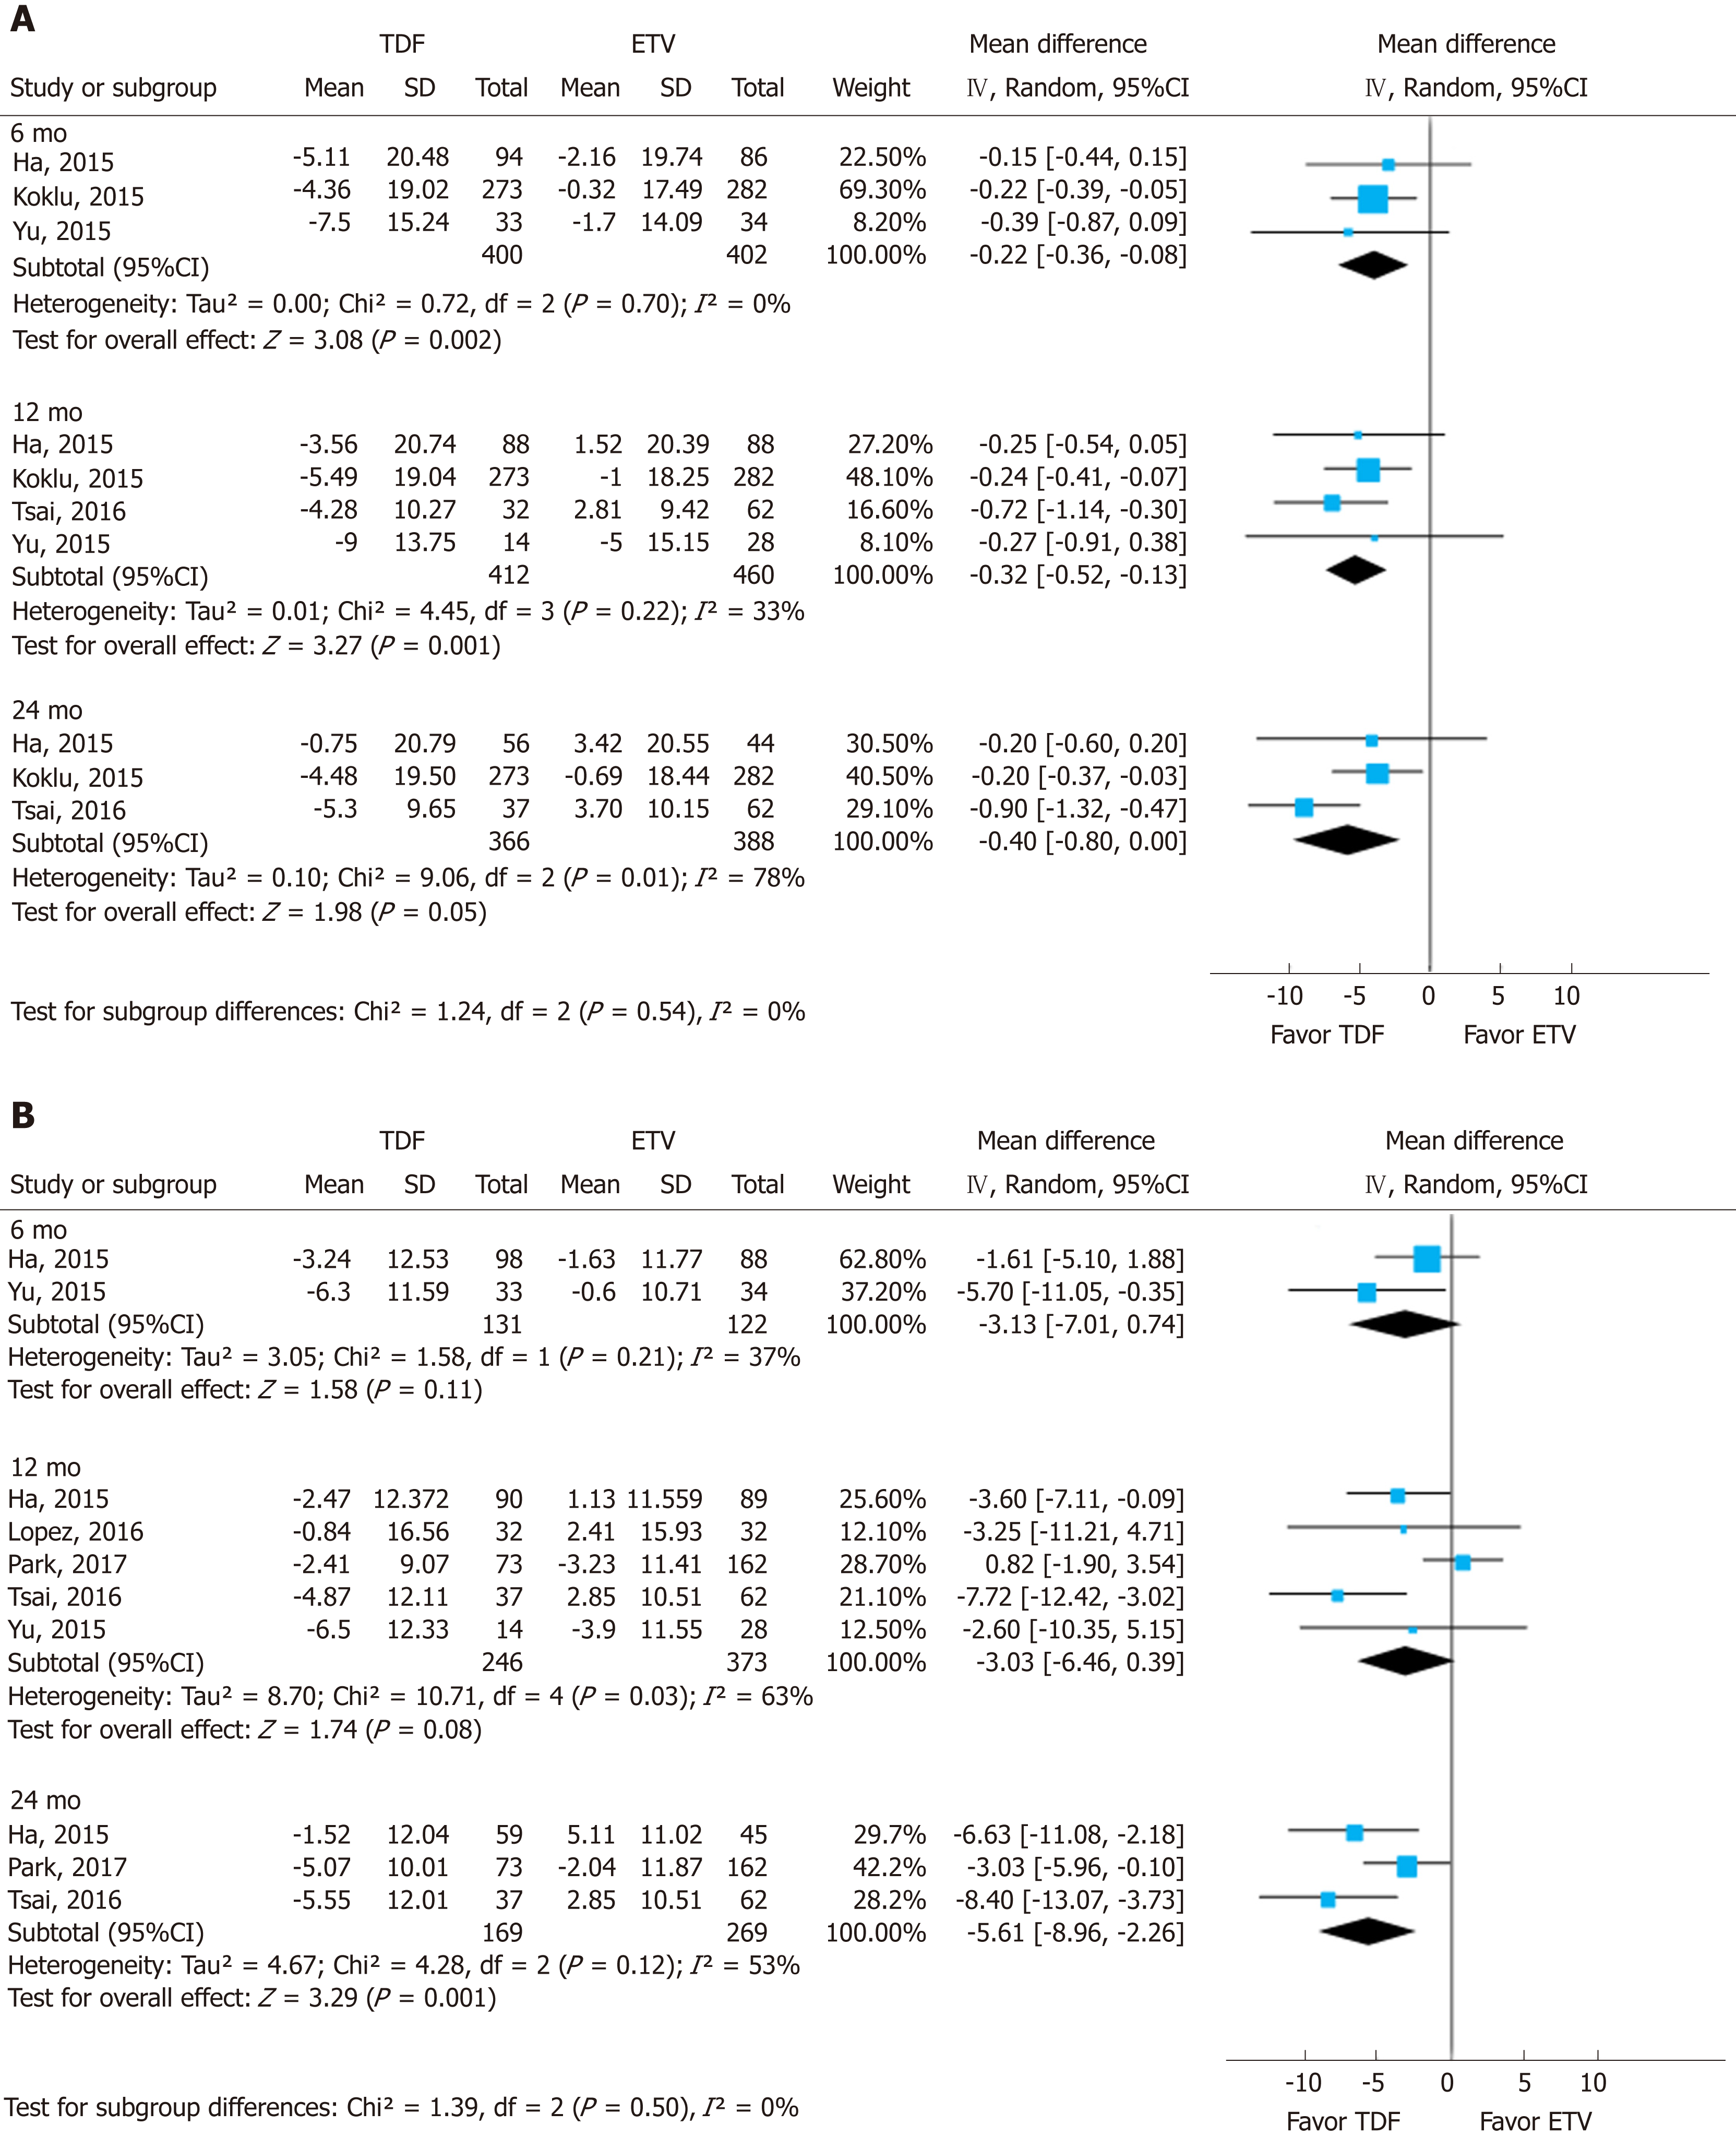
Figure 4 Subgroup analysis.
Likewise, the change is calculated using a common formula in each arm to assess the effect size. A: Modification of diet in renal disease, B: Chronic kidney disease epidemiology collaboration. TDF: Tenofovir; ETV: Entecavir; SD: Standard deviation; CI: Confidence interval.
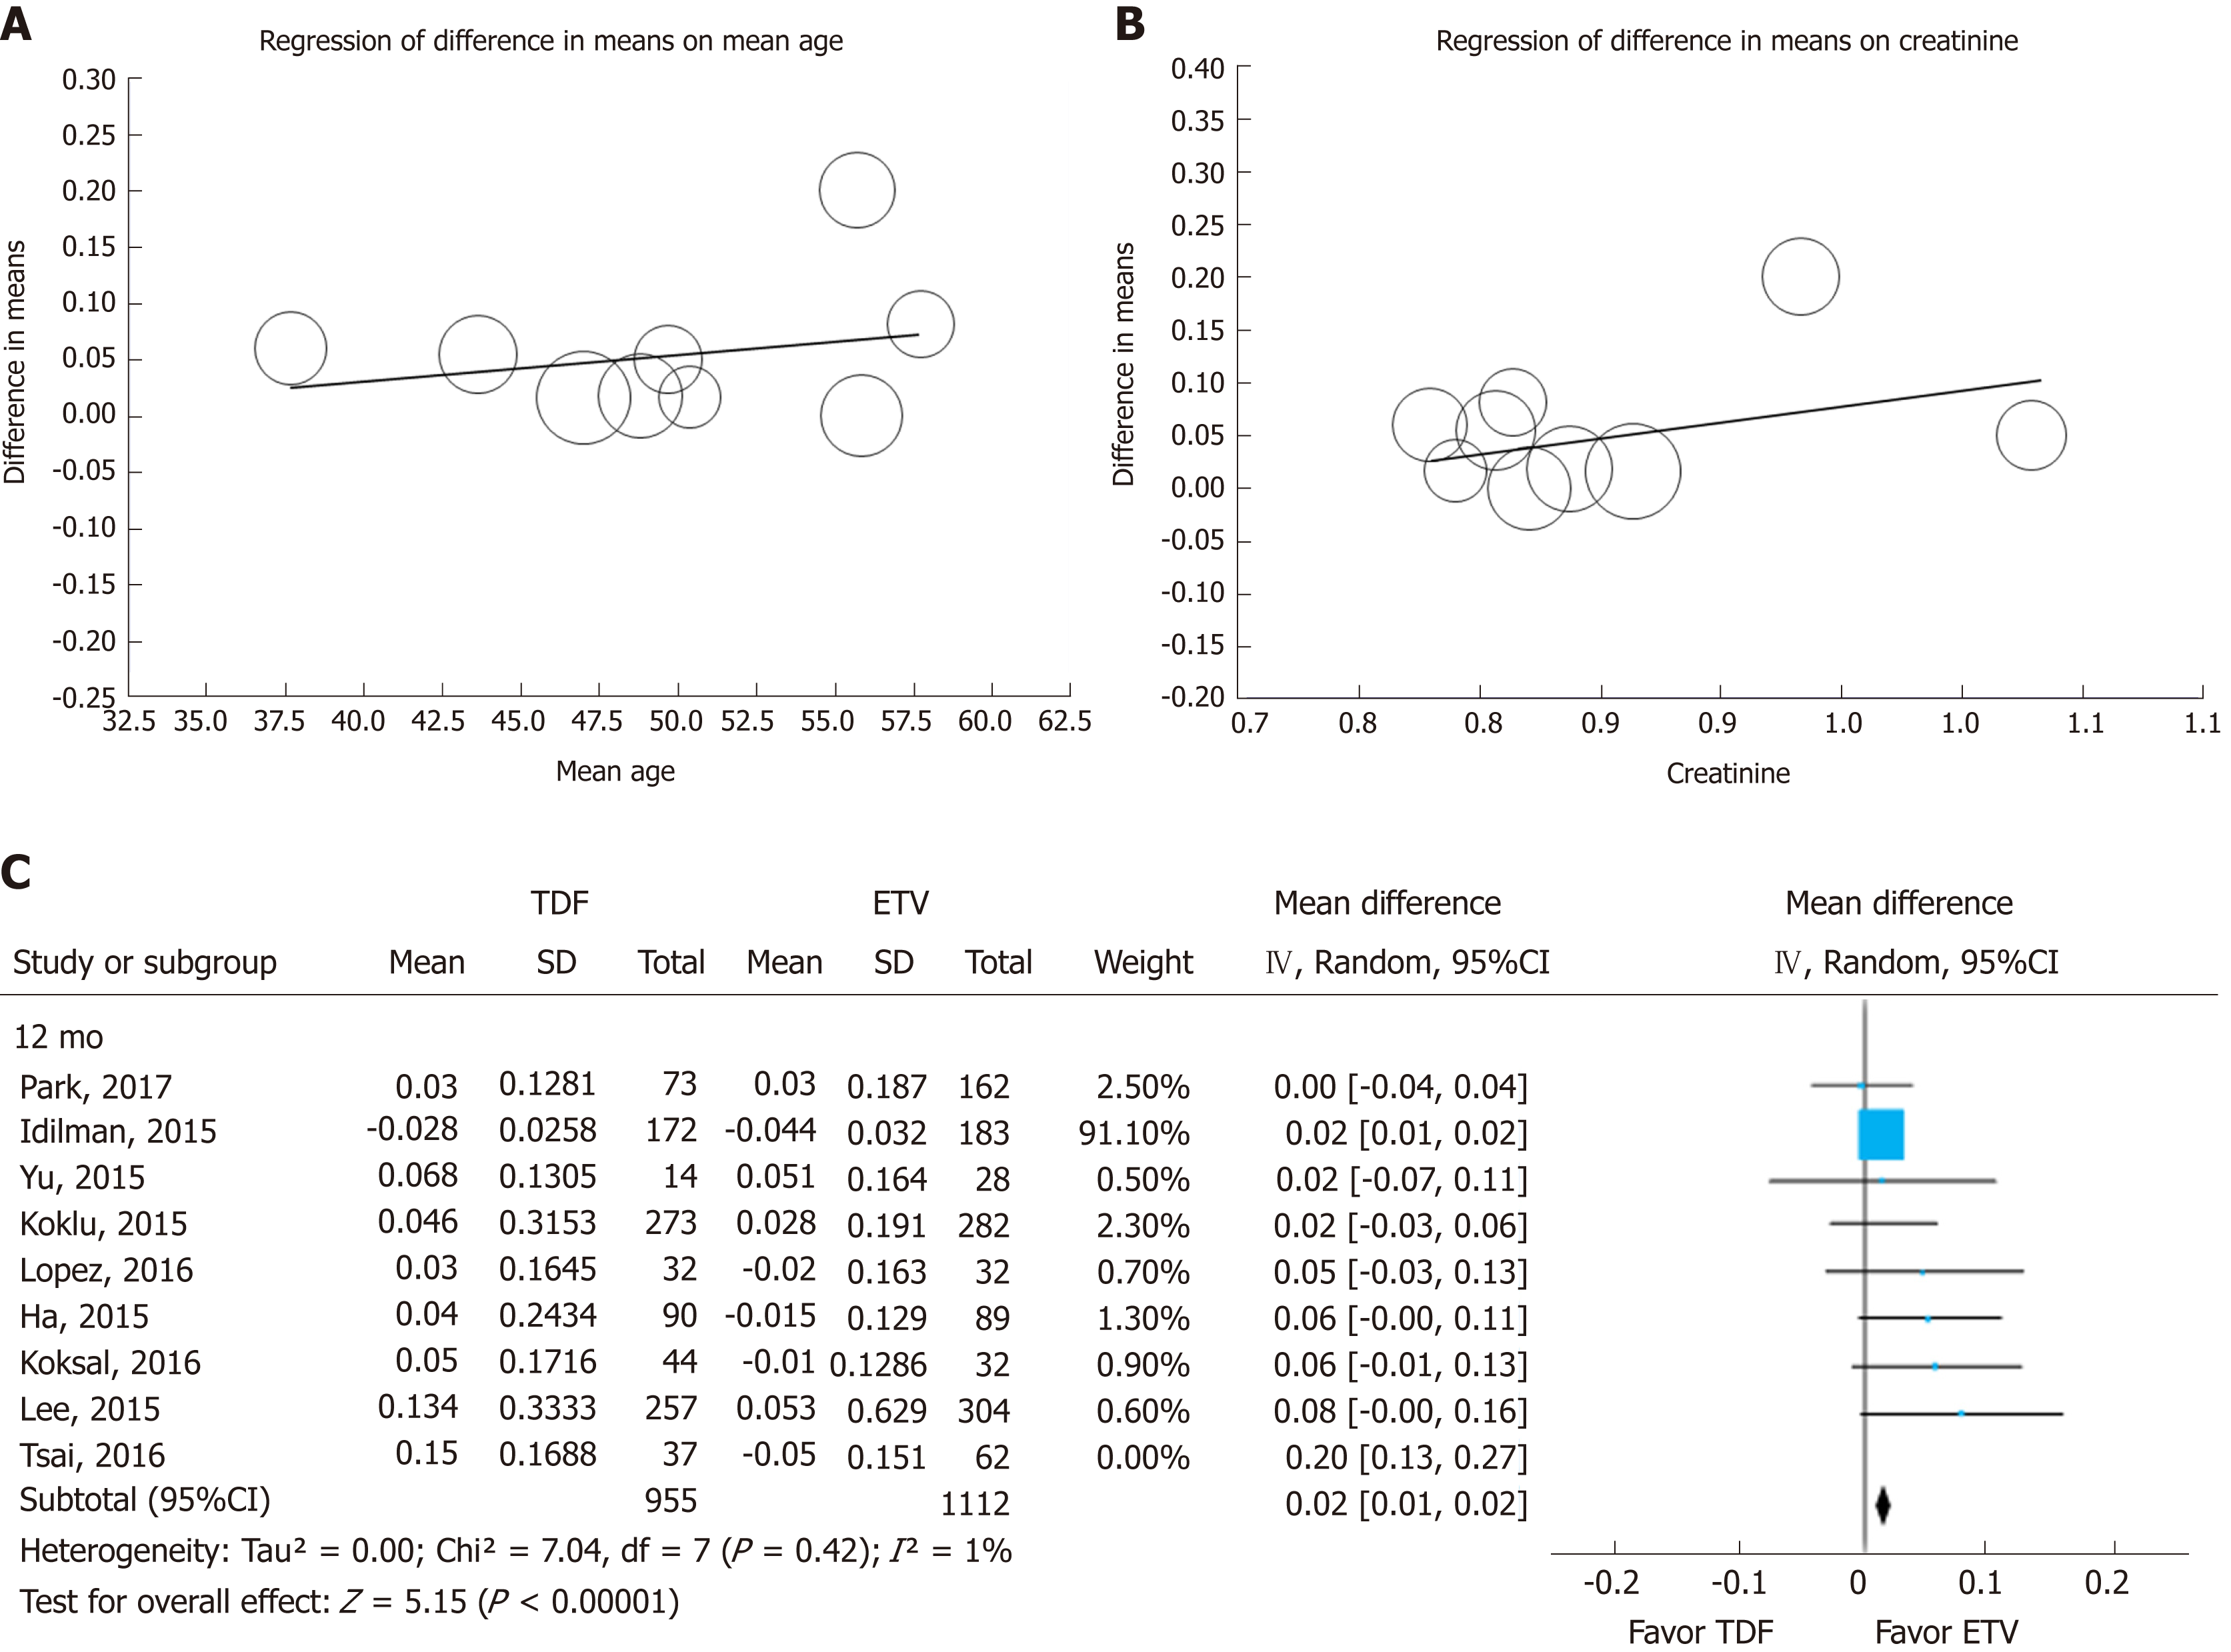
Figure 5 Sensitivity analysis.
Meta-regression of difference in mean age (A) and creatinine (B). The circles on the graph represent included studies; the size of the circle indicates the weight of each study. To check the robustness of this study, we tentatively excluded one heterogeneous study[19] (C). TDF: Tenofovir; ETV: Entecavir; SD: Standard deviation; CI: Confidence interval.
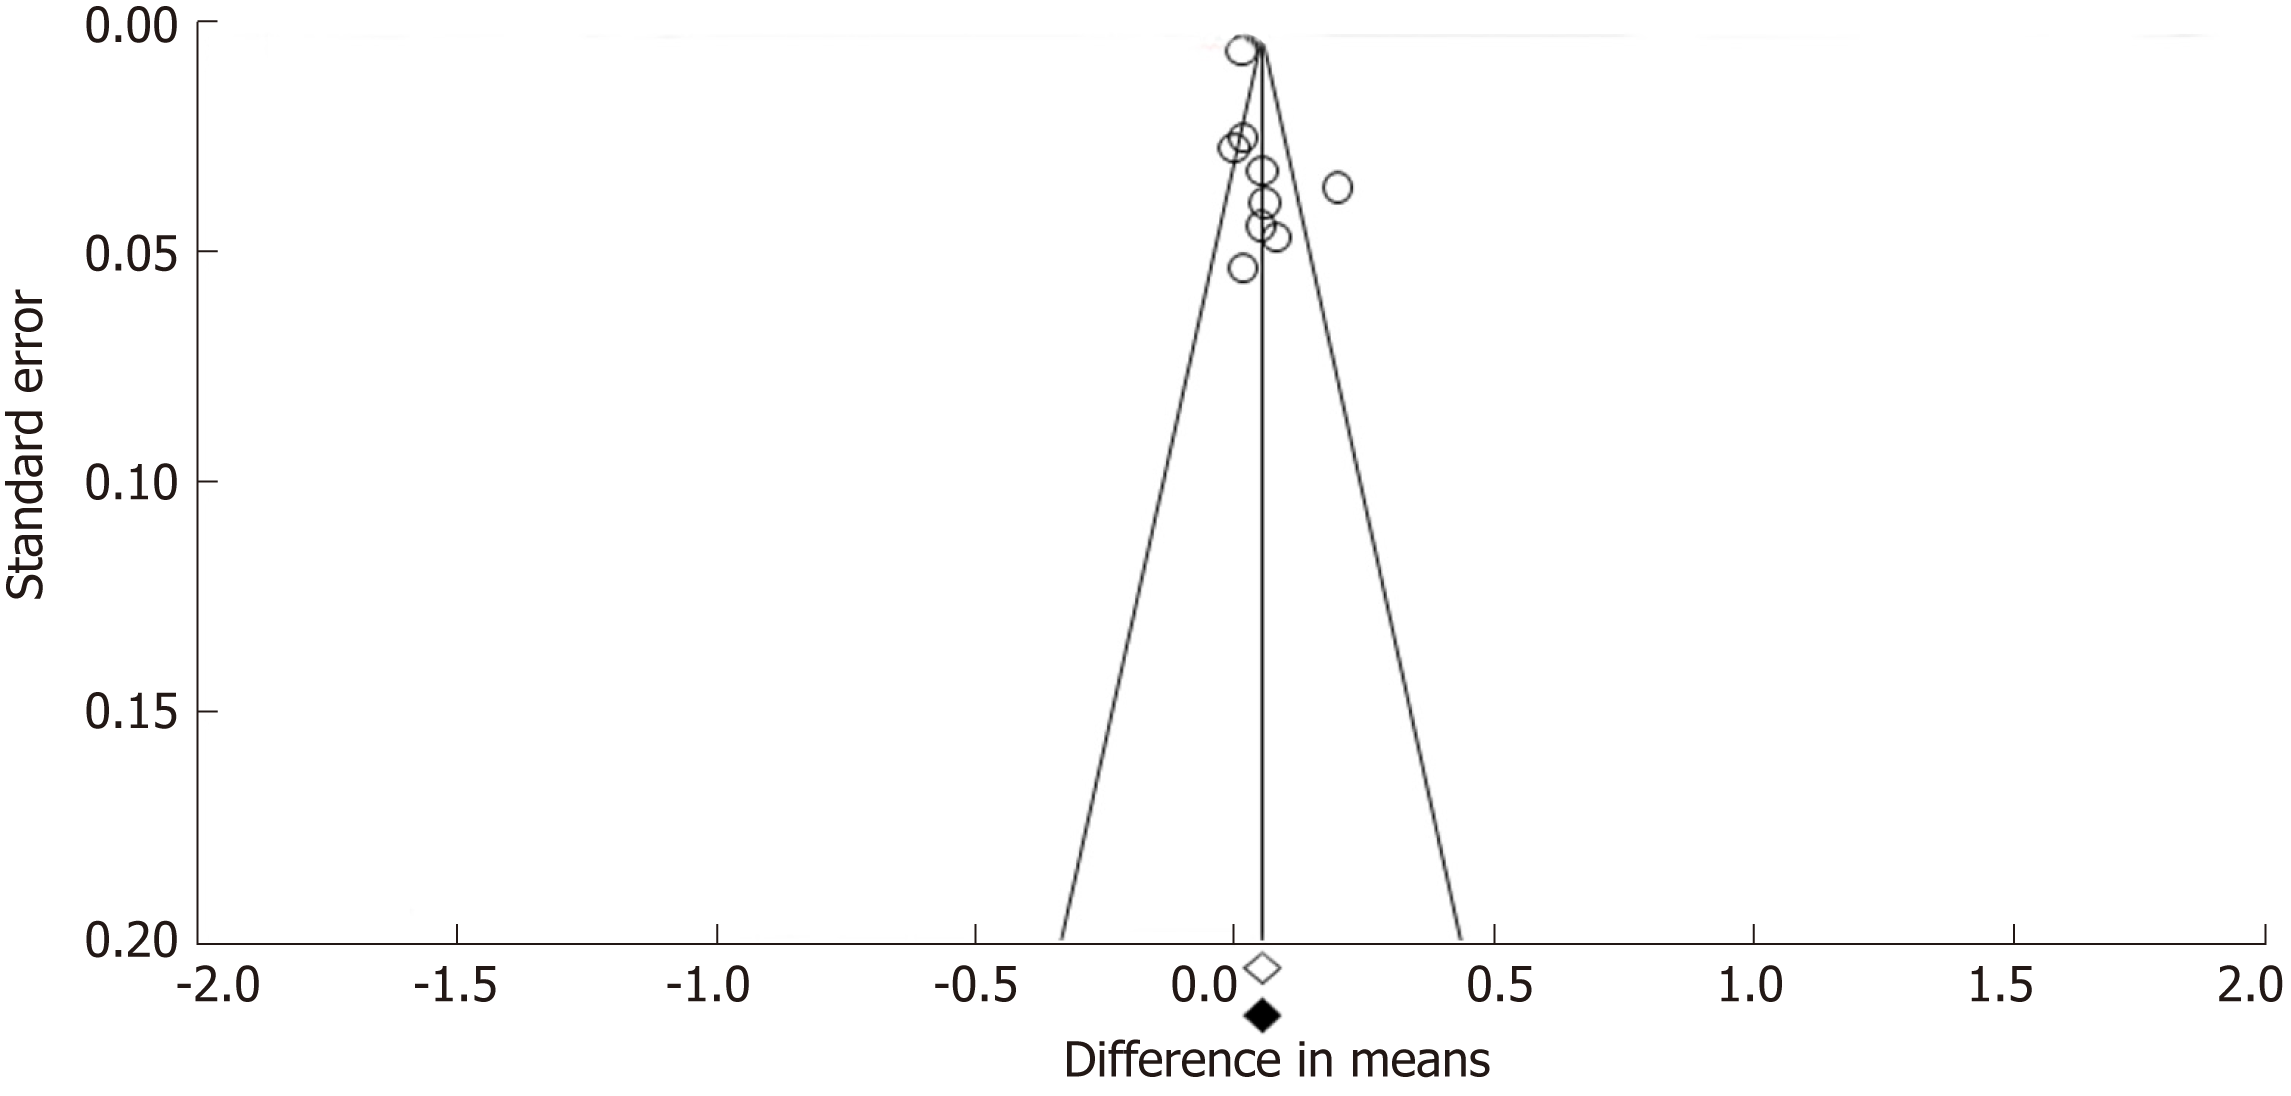
Figure 6 Funnel plot for publication bias in all included studies.
The empty circles represent the observed studies and empty and black-filled diamonds represent the overall random effects means and 95% confidence intervals of the observed studies.
- Citation: Lee HY, Oh H, Park CH, Yeo YH, Nguyen MH, Jun DW. Comparison of renal safety of tenofovir and entecavir in patients with chronic hepatitis B: Systematic review with meta-analysis. World J Gastroenterol 2019; 25(23): 2961-2972
- URL: https://www.wjgnet.com/1007-9327/full/v25/i23/2961.htm
- DOI: https://dx.doi.org/10.3748/wjg.v25.i23.2961


