Copyright
©The Author(s) 2019.
World J Gastroenterol. Jun 7, 2019; 25(21): 2683-2698
Published online Jun 7, 2019. doi: 10.3748/wjg.v25.i21.2683
Published online Jun 7, 2019. doi: 10.3748/wjg.v25.i21.2683
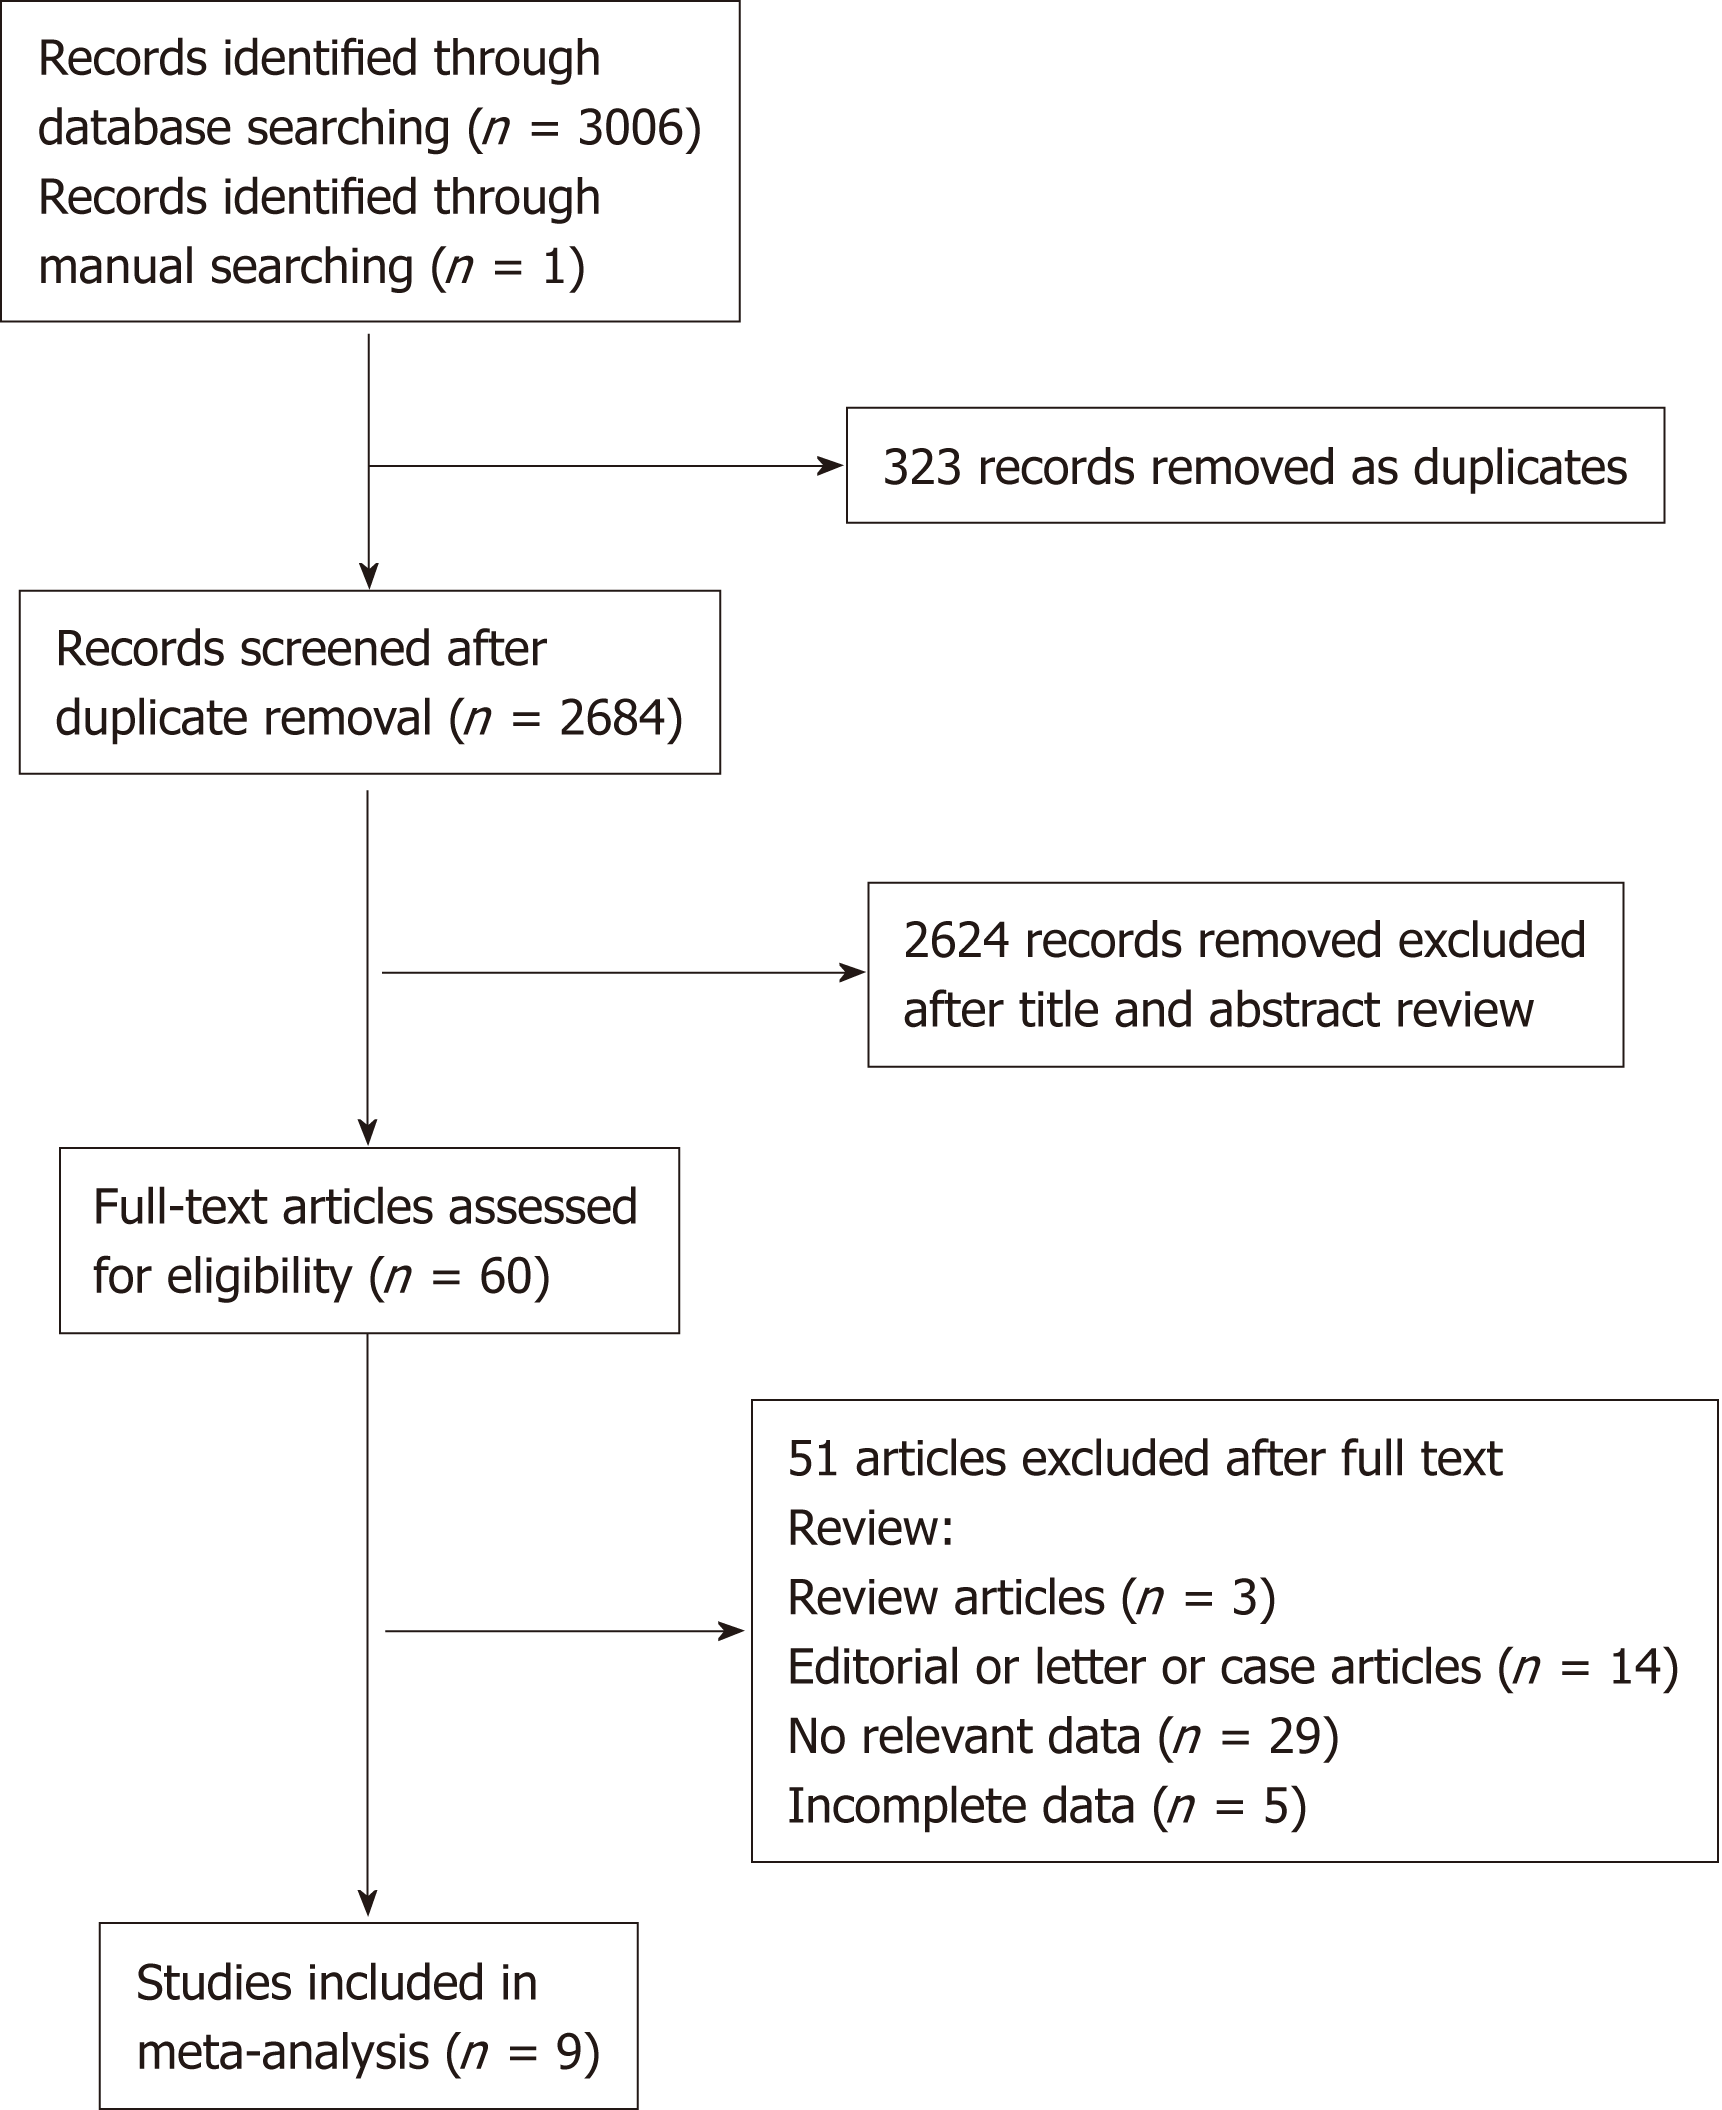
Figure 1 Flowchart of the literature search.
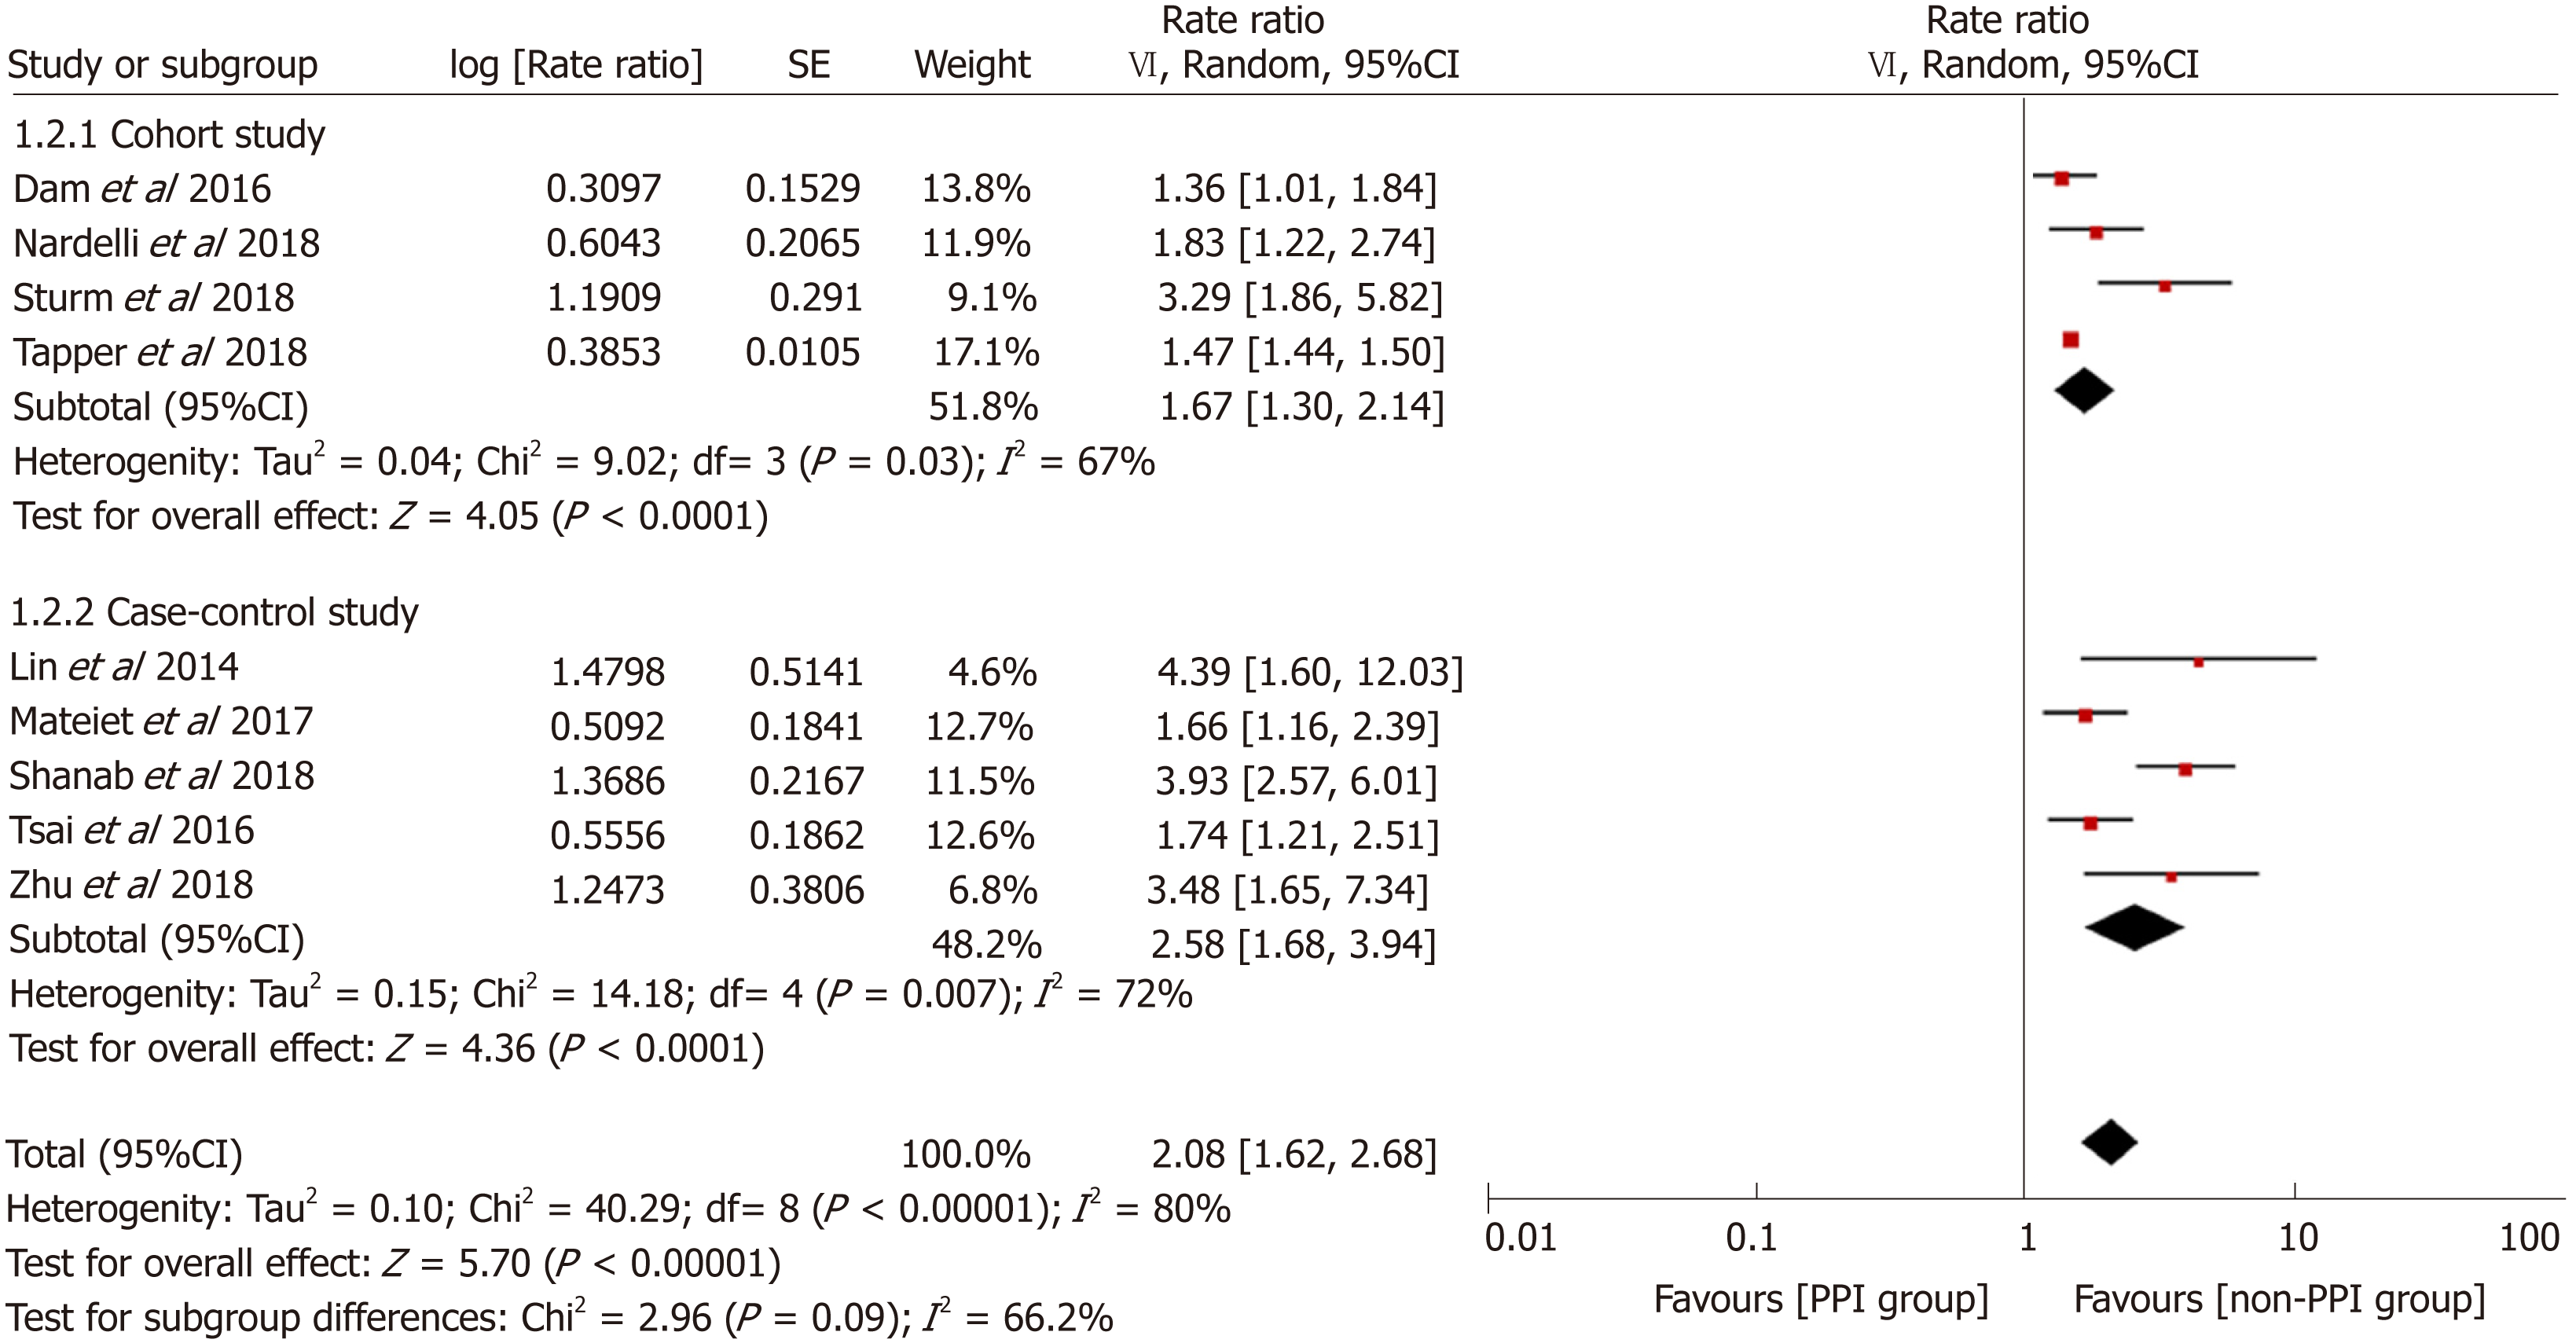
Figure 2 Forest plot to evaluate the association between proton pump inhibitor use and hepatic encephalopathy with a subgroup analysis based on study design.
CI: Confidence interval; PPI: Proton pump inhibitor.
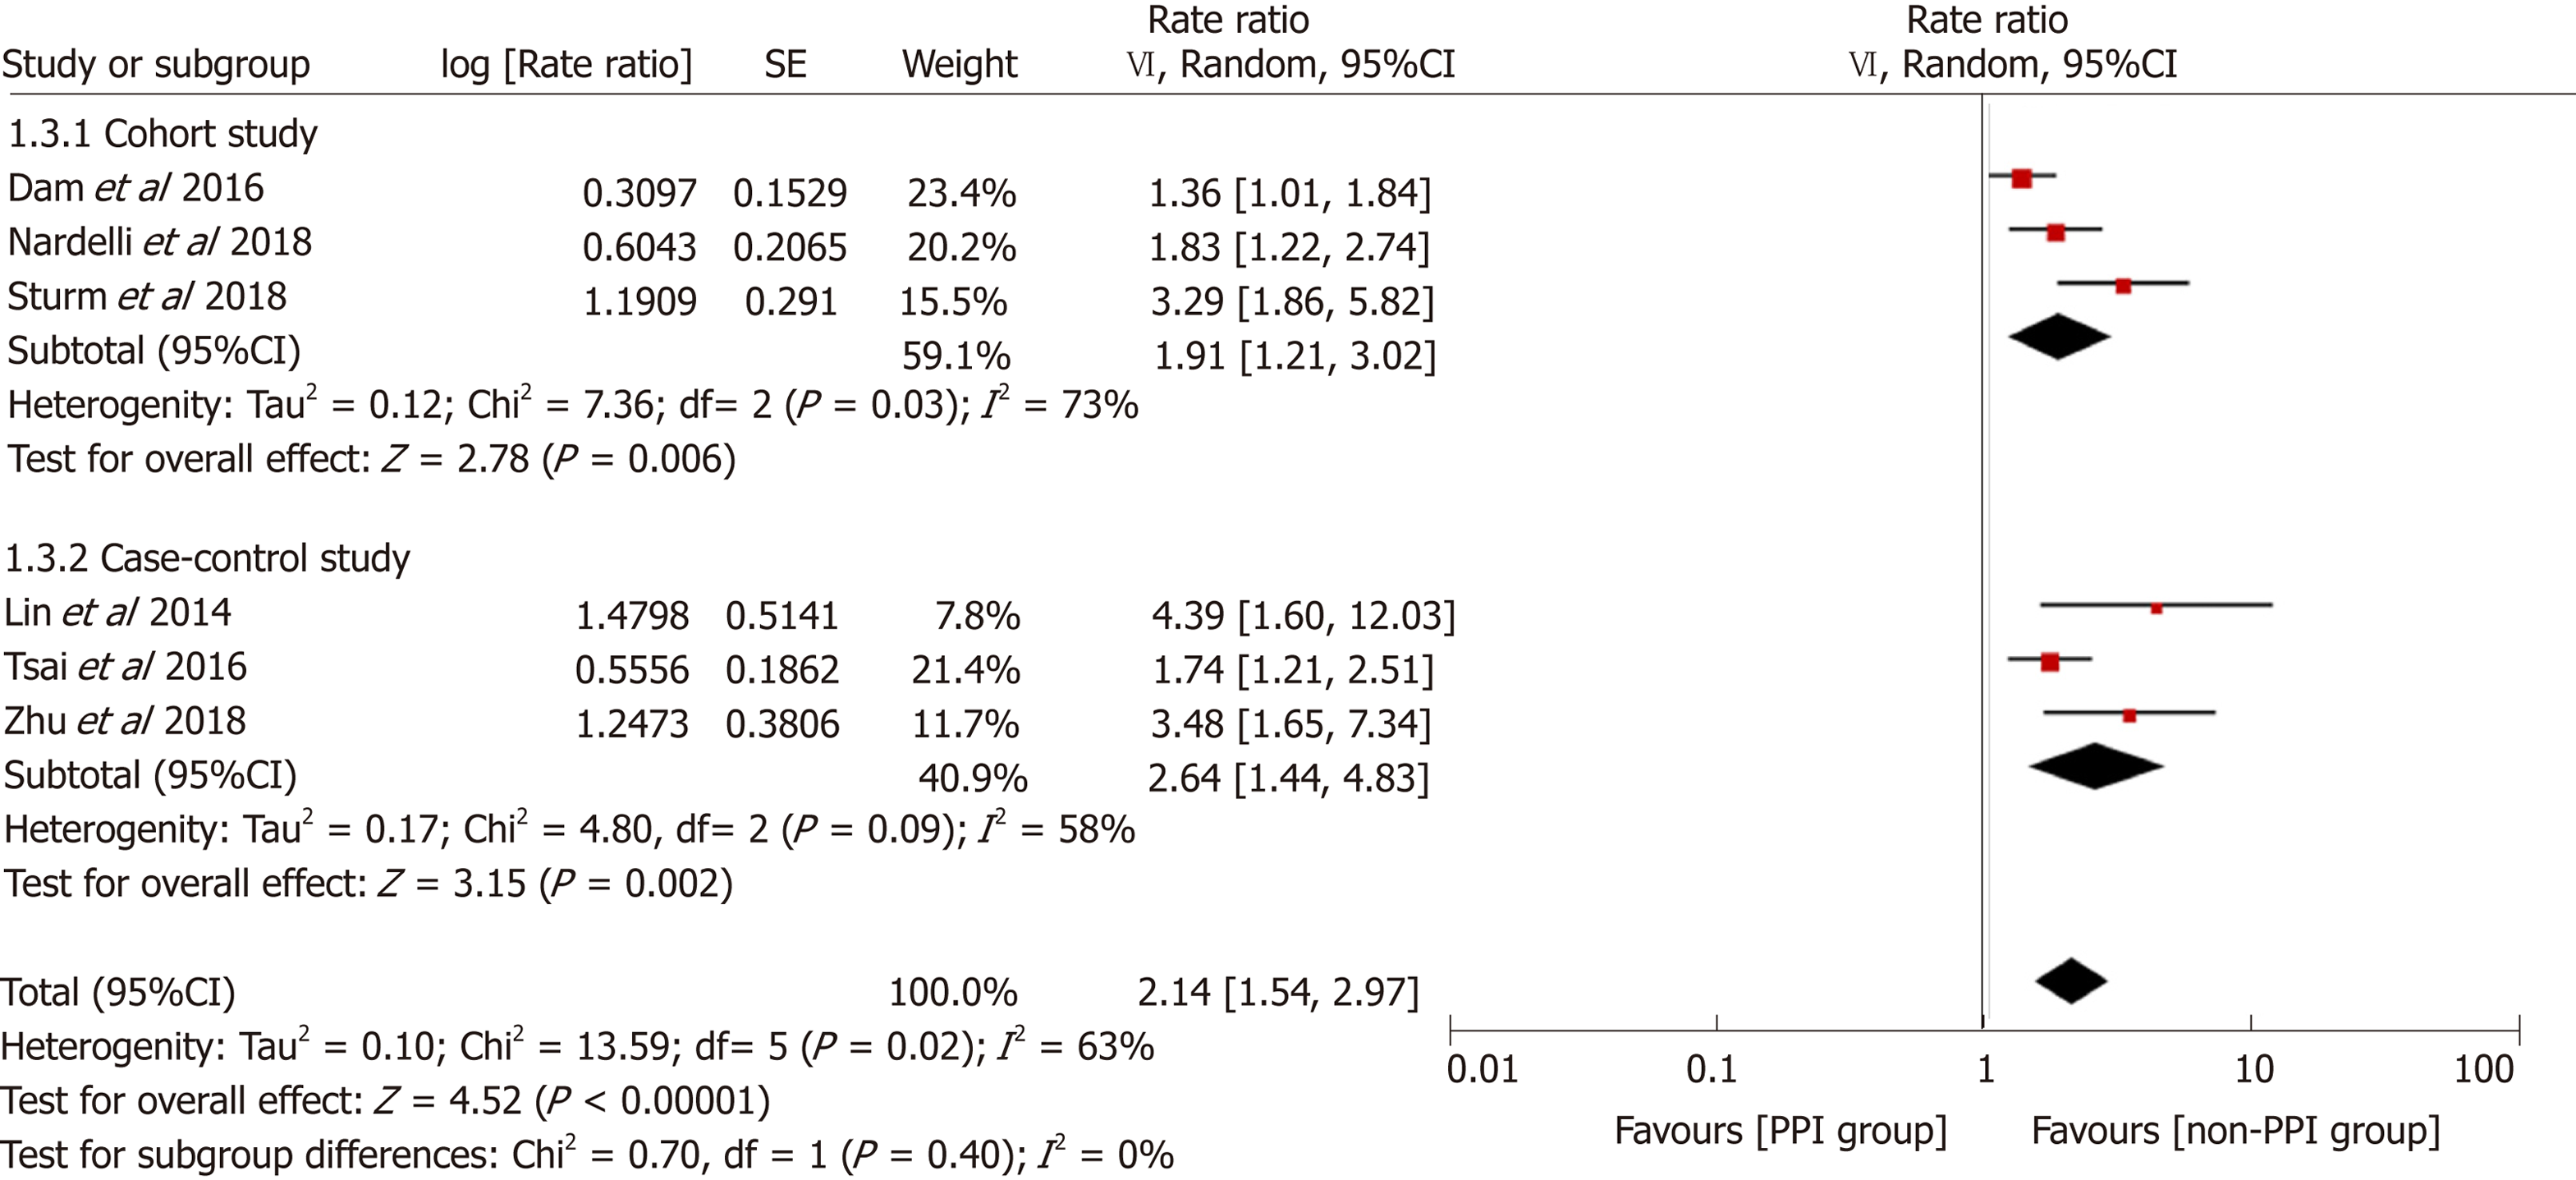
Figure 3 Sensitivity analysis excluding data from conference abstracts.
CI: Confidence interval; PPI: Proton pump inhibitor.
Figure 4 Sensitivity analysis focusing on patients without past hepatic encephalopathy episodes.
CI: Confidence interval; PPI: Proton pump inhibitor.
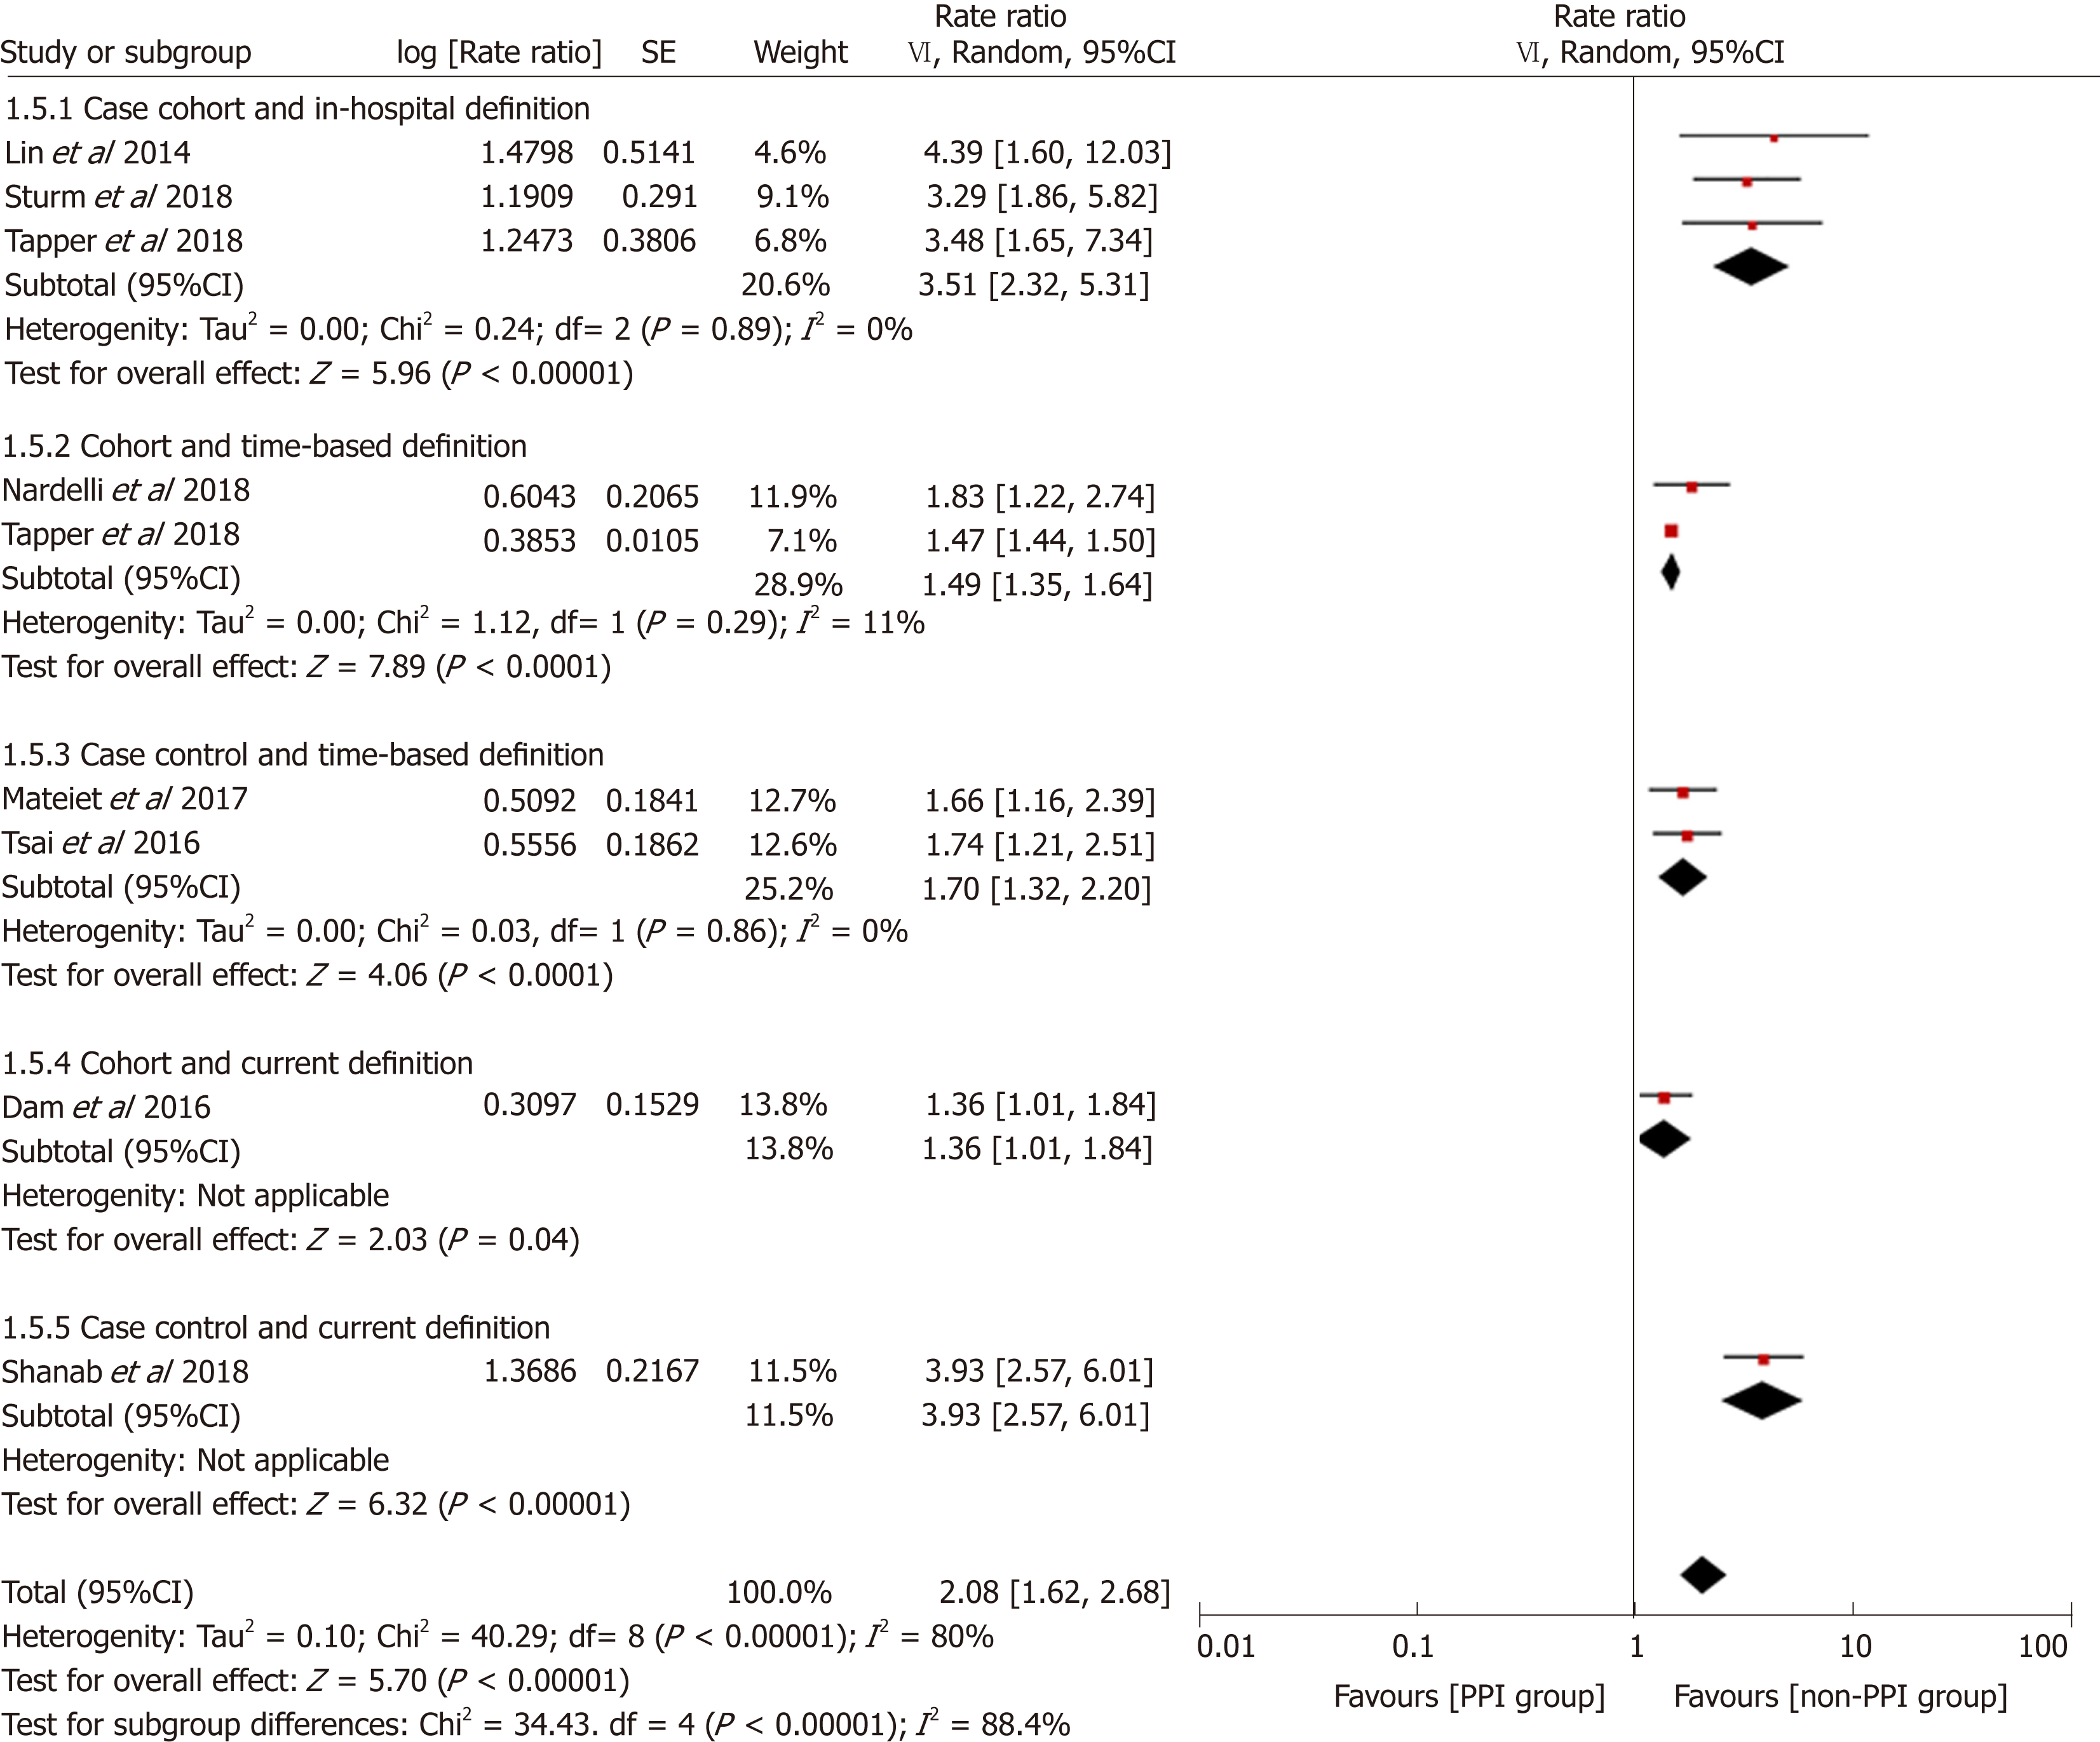
Figure 5 Forest plot to evaluate the association between proton pump inhibitor use and hepatic encephalopathy with stratification analyses based on study design and definition of proton pump inhibitor use.
CI: Confidence interval; PPI: Proton pump inhibitor.
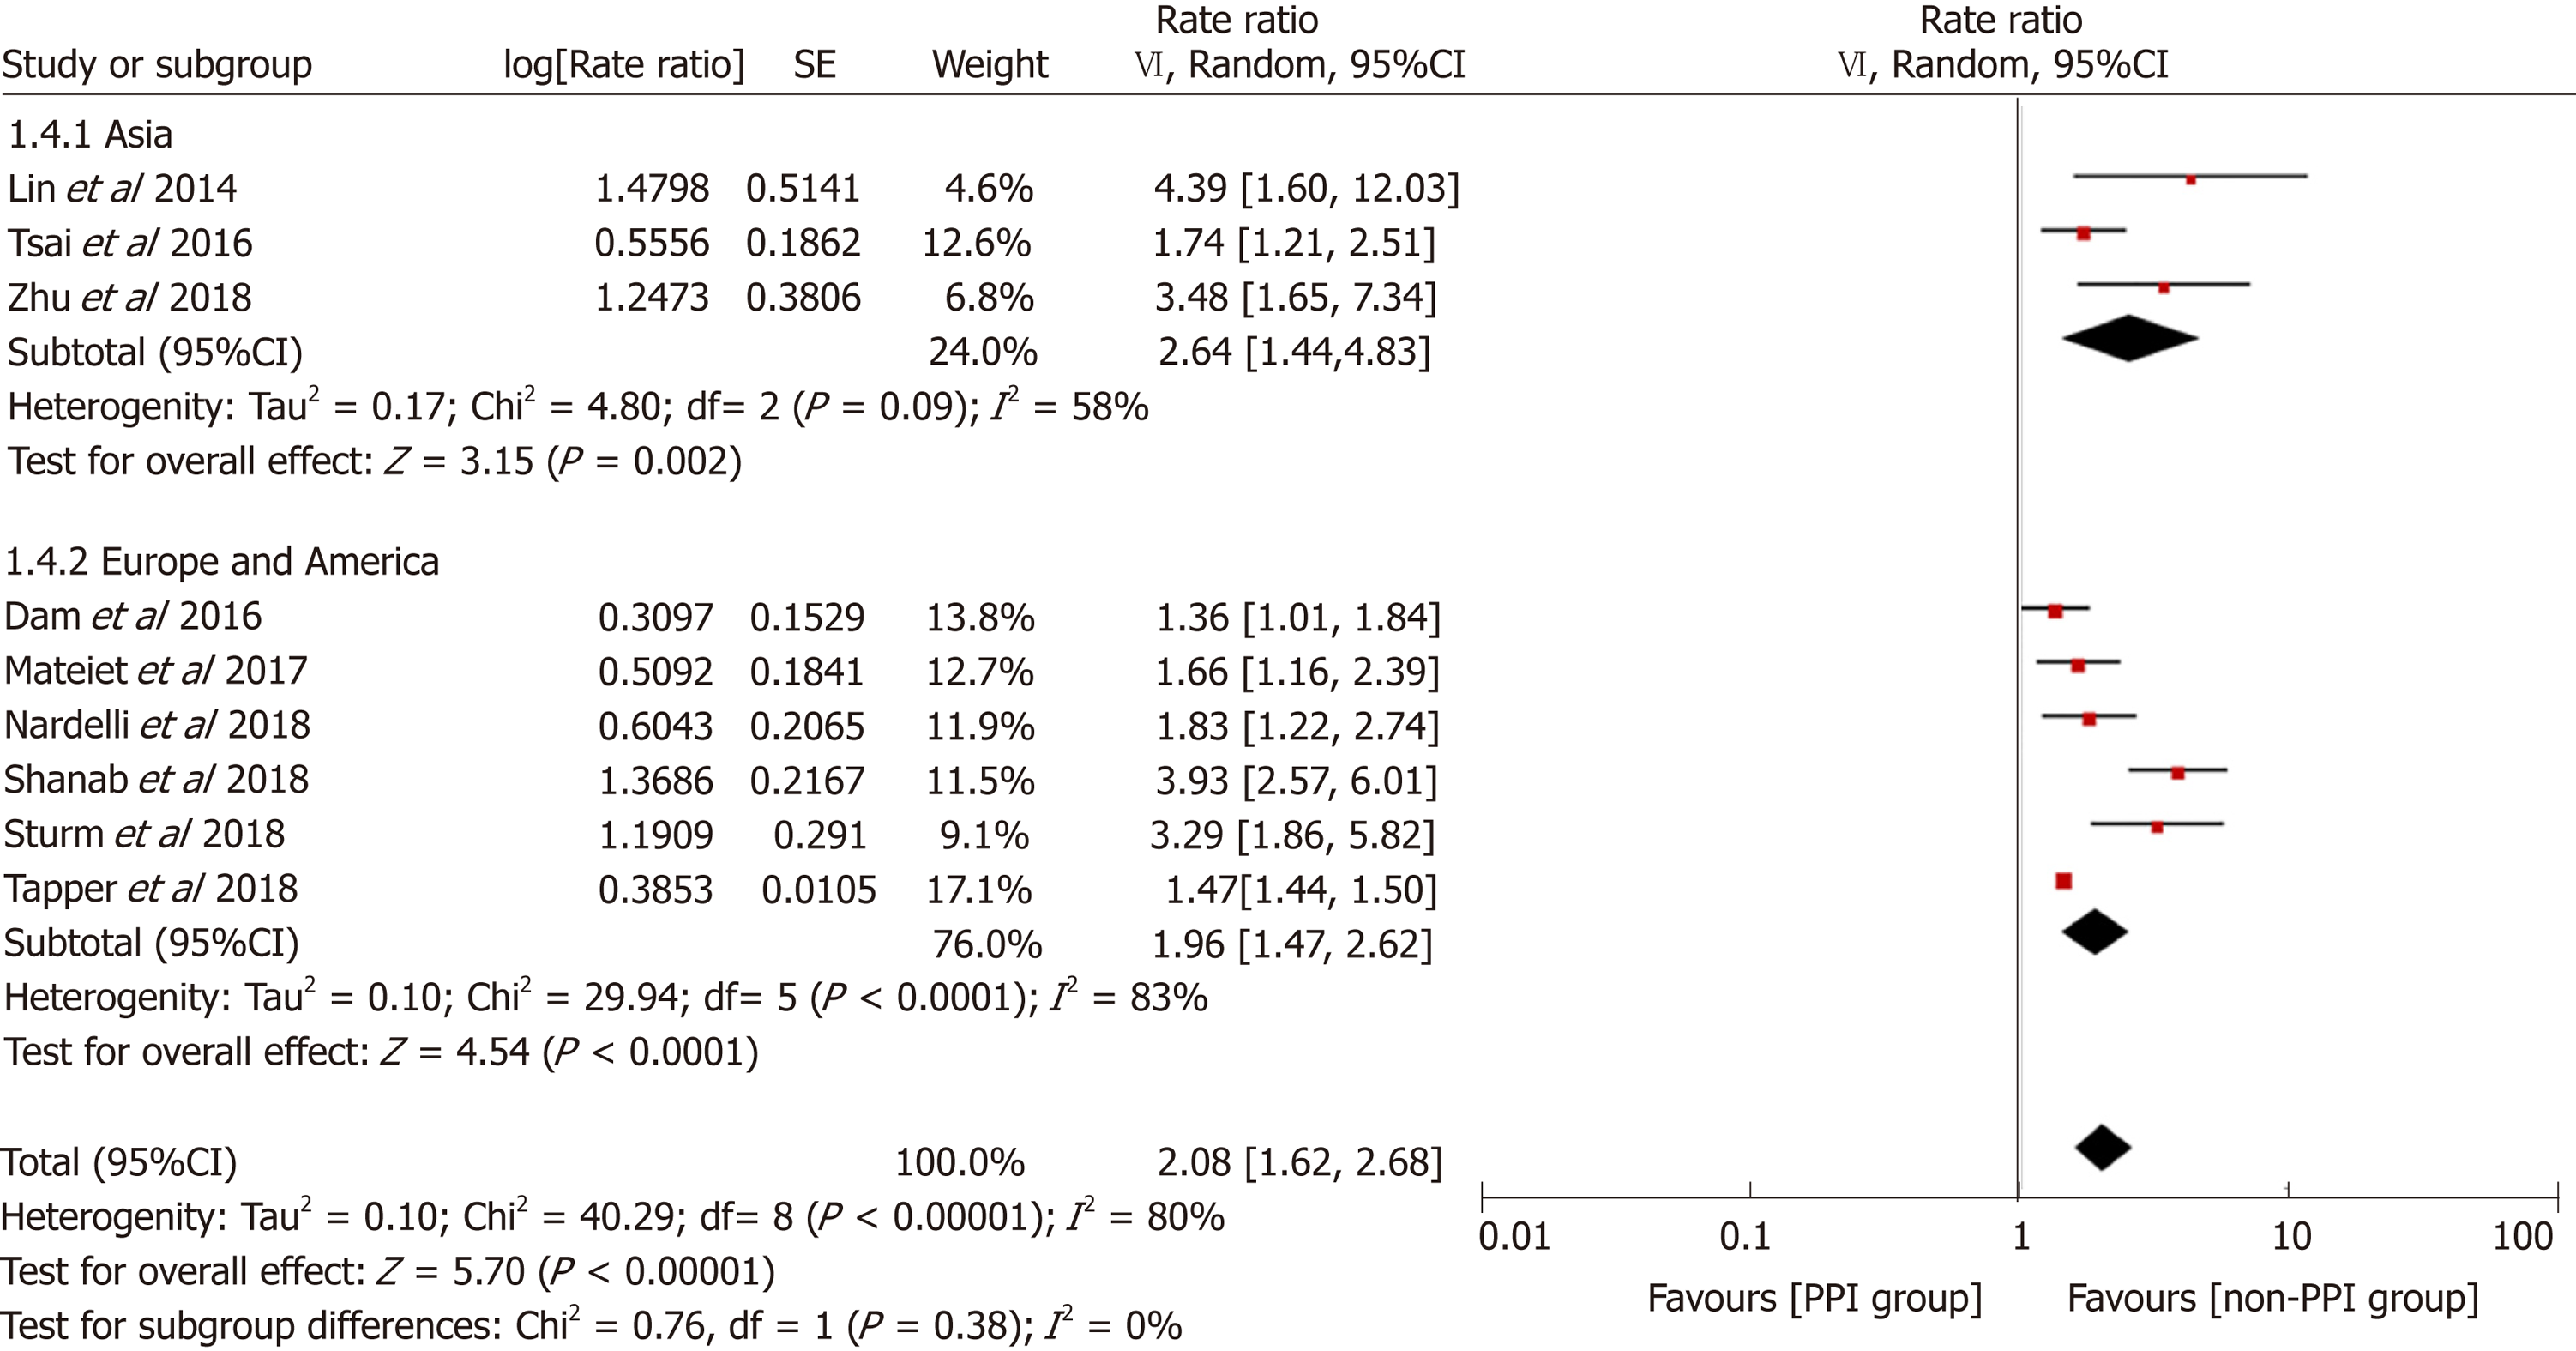
Figure 6 Forest plot to evaluate the association between proton pump inhibitor use and hepatic encephalopathy with a subgroup analysis based on the study location.
CI: Confidence interval; PPI: Proton pump inhibitor.
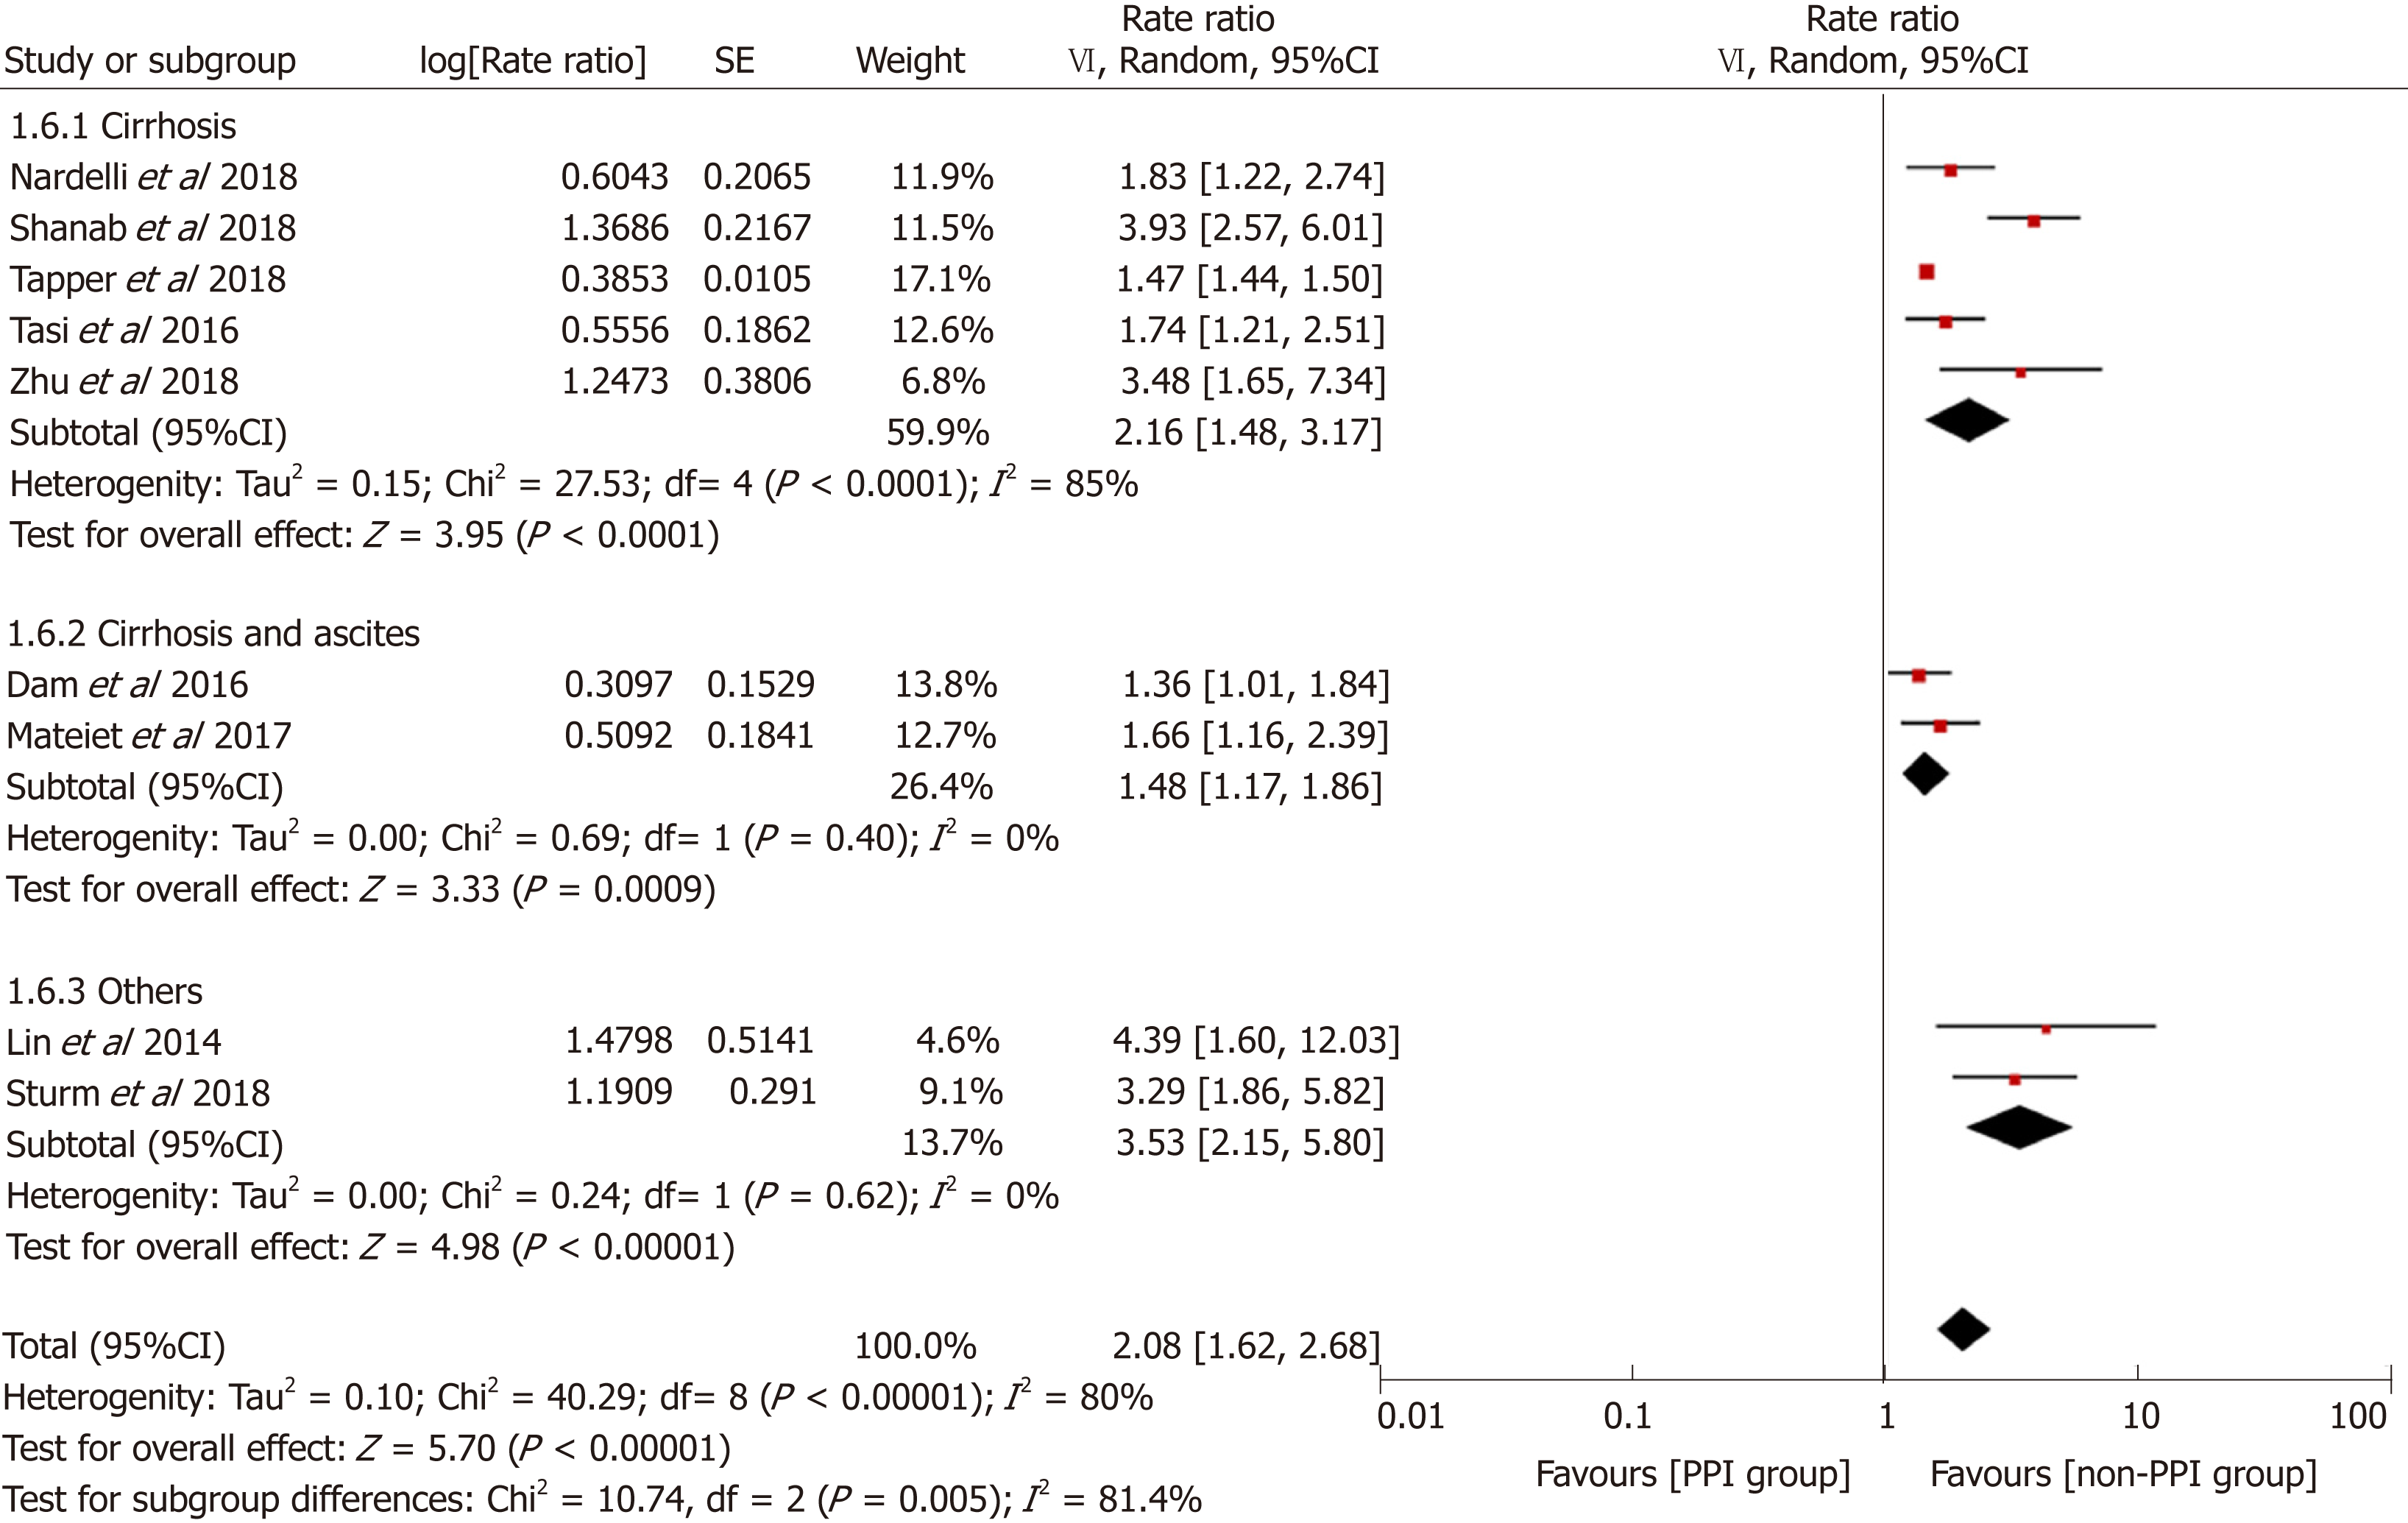
Figure 7 Forest plot to evaluate the association between proton pump inhibitor use and hepatic encephalopathy with a subgroup analysis based on the type of advanced liver disease.
CI: Confidence interval; PPI: Proton pump inhibitor.
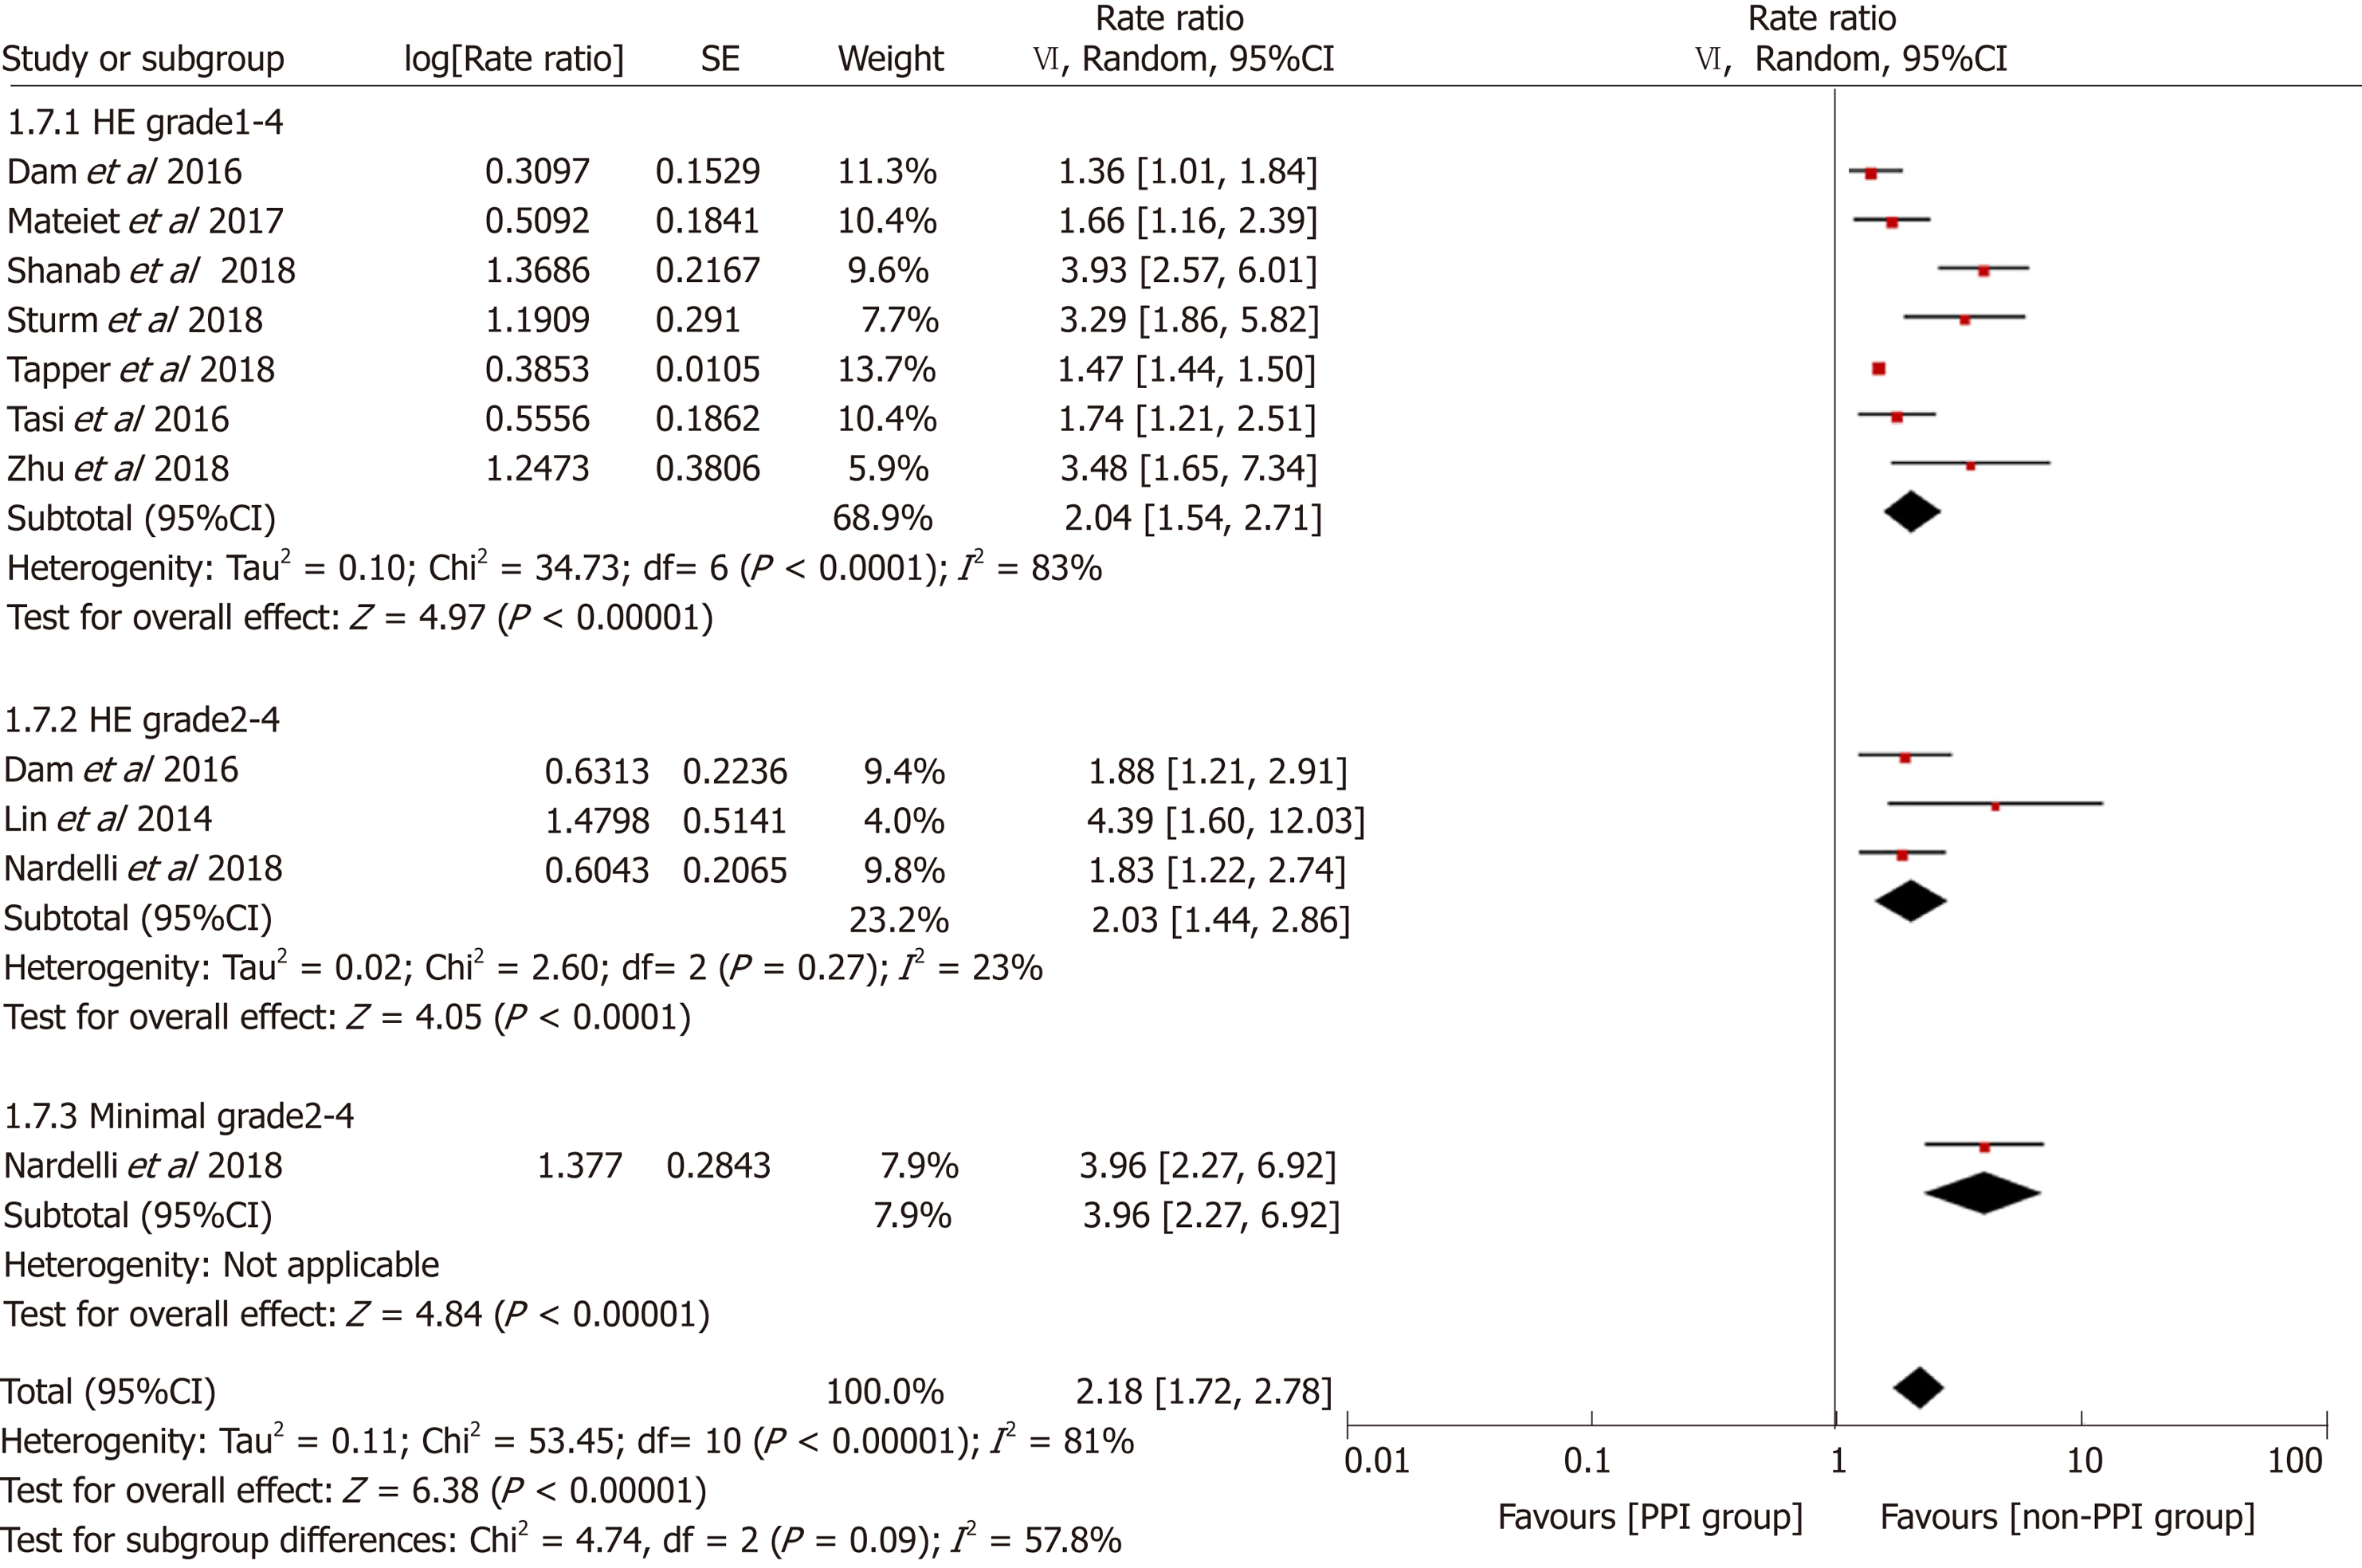
Figure 8 Forest plot to evaluate the association between proton pump inhibitor use and hepatic encephalopathy with a subgroup analysis based on the outcomes analyzed.
CI: Confidence interval; PPI: Proton pump inhibitor.
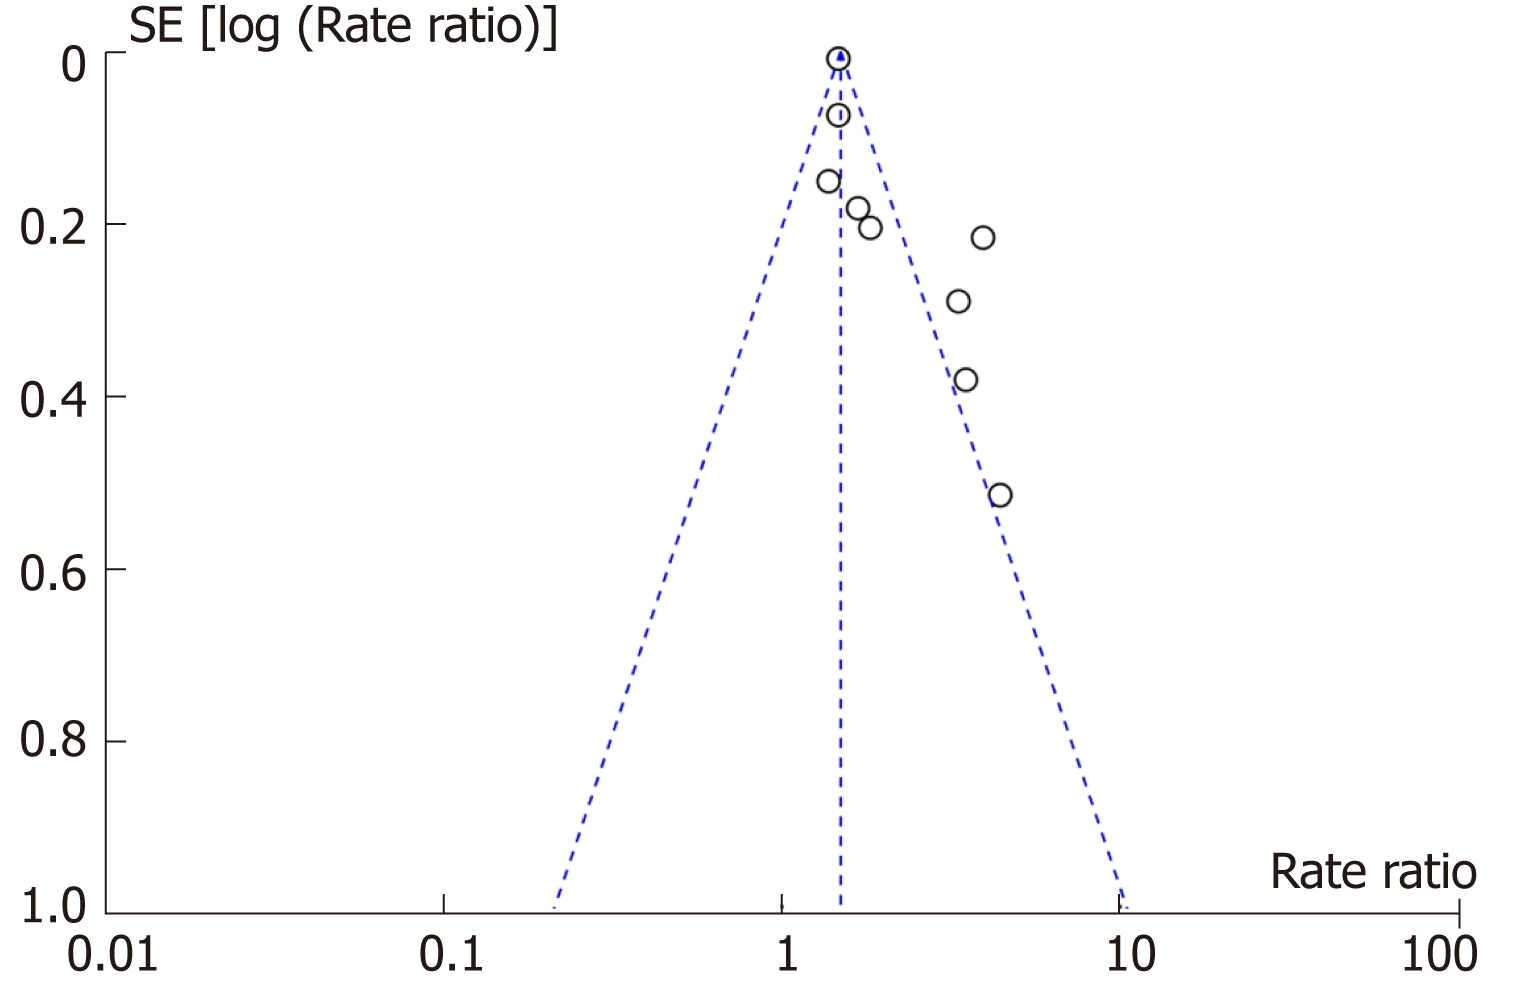
Figure 9 Funnel plot assessing publication bias.
- Citation: Tantai XX, Yang LB, Wei ZC, Xiao CL, Chen LR, Wang JH, Liu N. Association of proton pump inhibitors with risk of hepatic encephalopathy in advanced liver disease: A meta-analysis. World J Gastroenterol 2019; 25(21): 2683-2698
- URL: https://www.wjgnet.com/1007-9327/full/v25/i21/2683.htm
- DOI: https://dx.doi.org/10.3748/wjg.v25.i21.2683


