Copyright
©The Author(s) 2019.
World J Gastroenterol. Jun 7, 2019; 25(21): 2675-2682
Published online Jun 7, 2019. doi: 10.3748/wjg.v25.i21.2675
Published online Jun 7, 2019. doi: 10.3748/wjg.v25.i21.2675
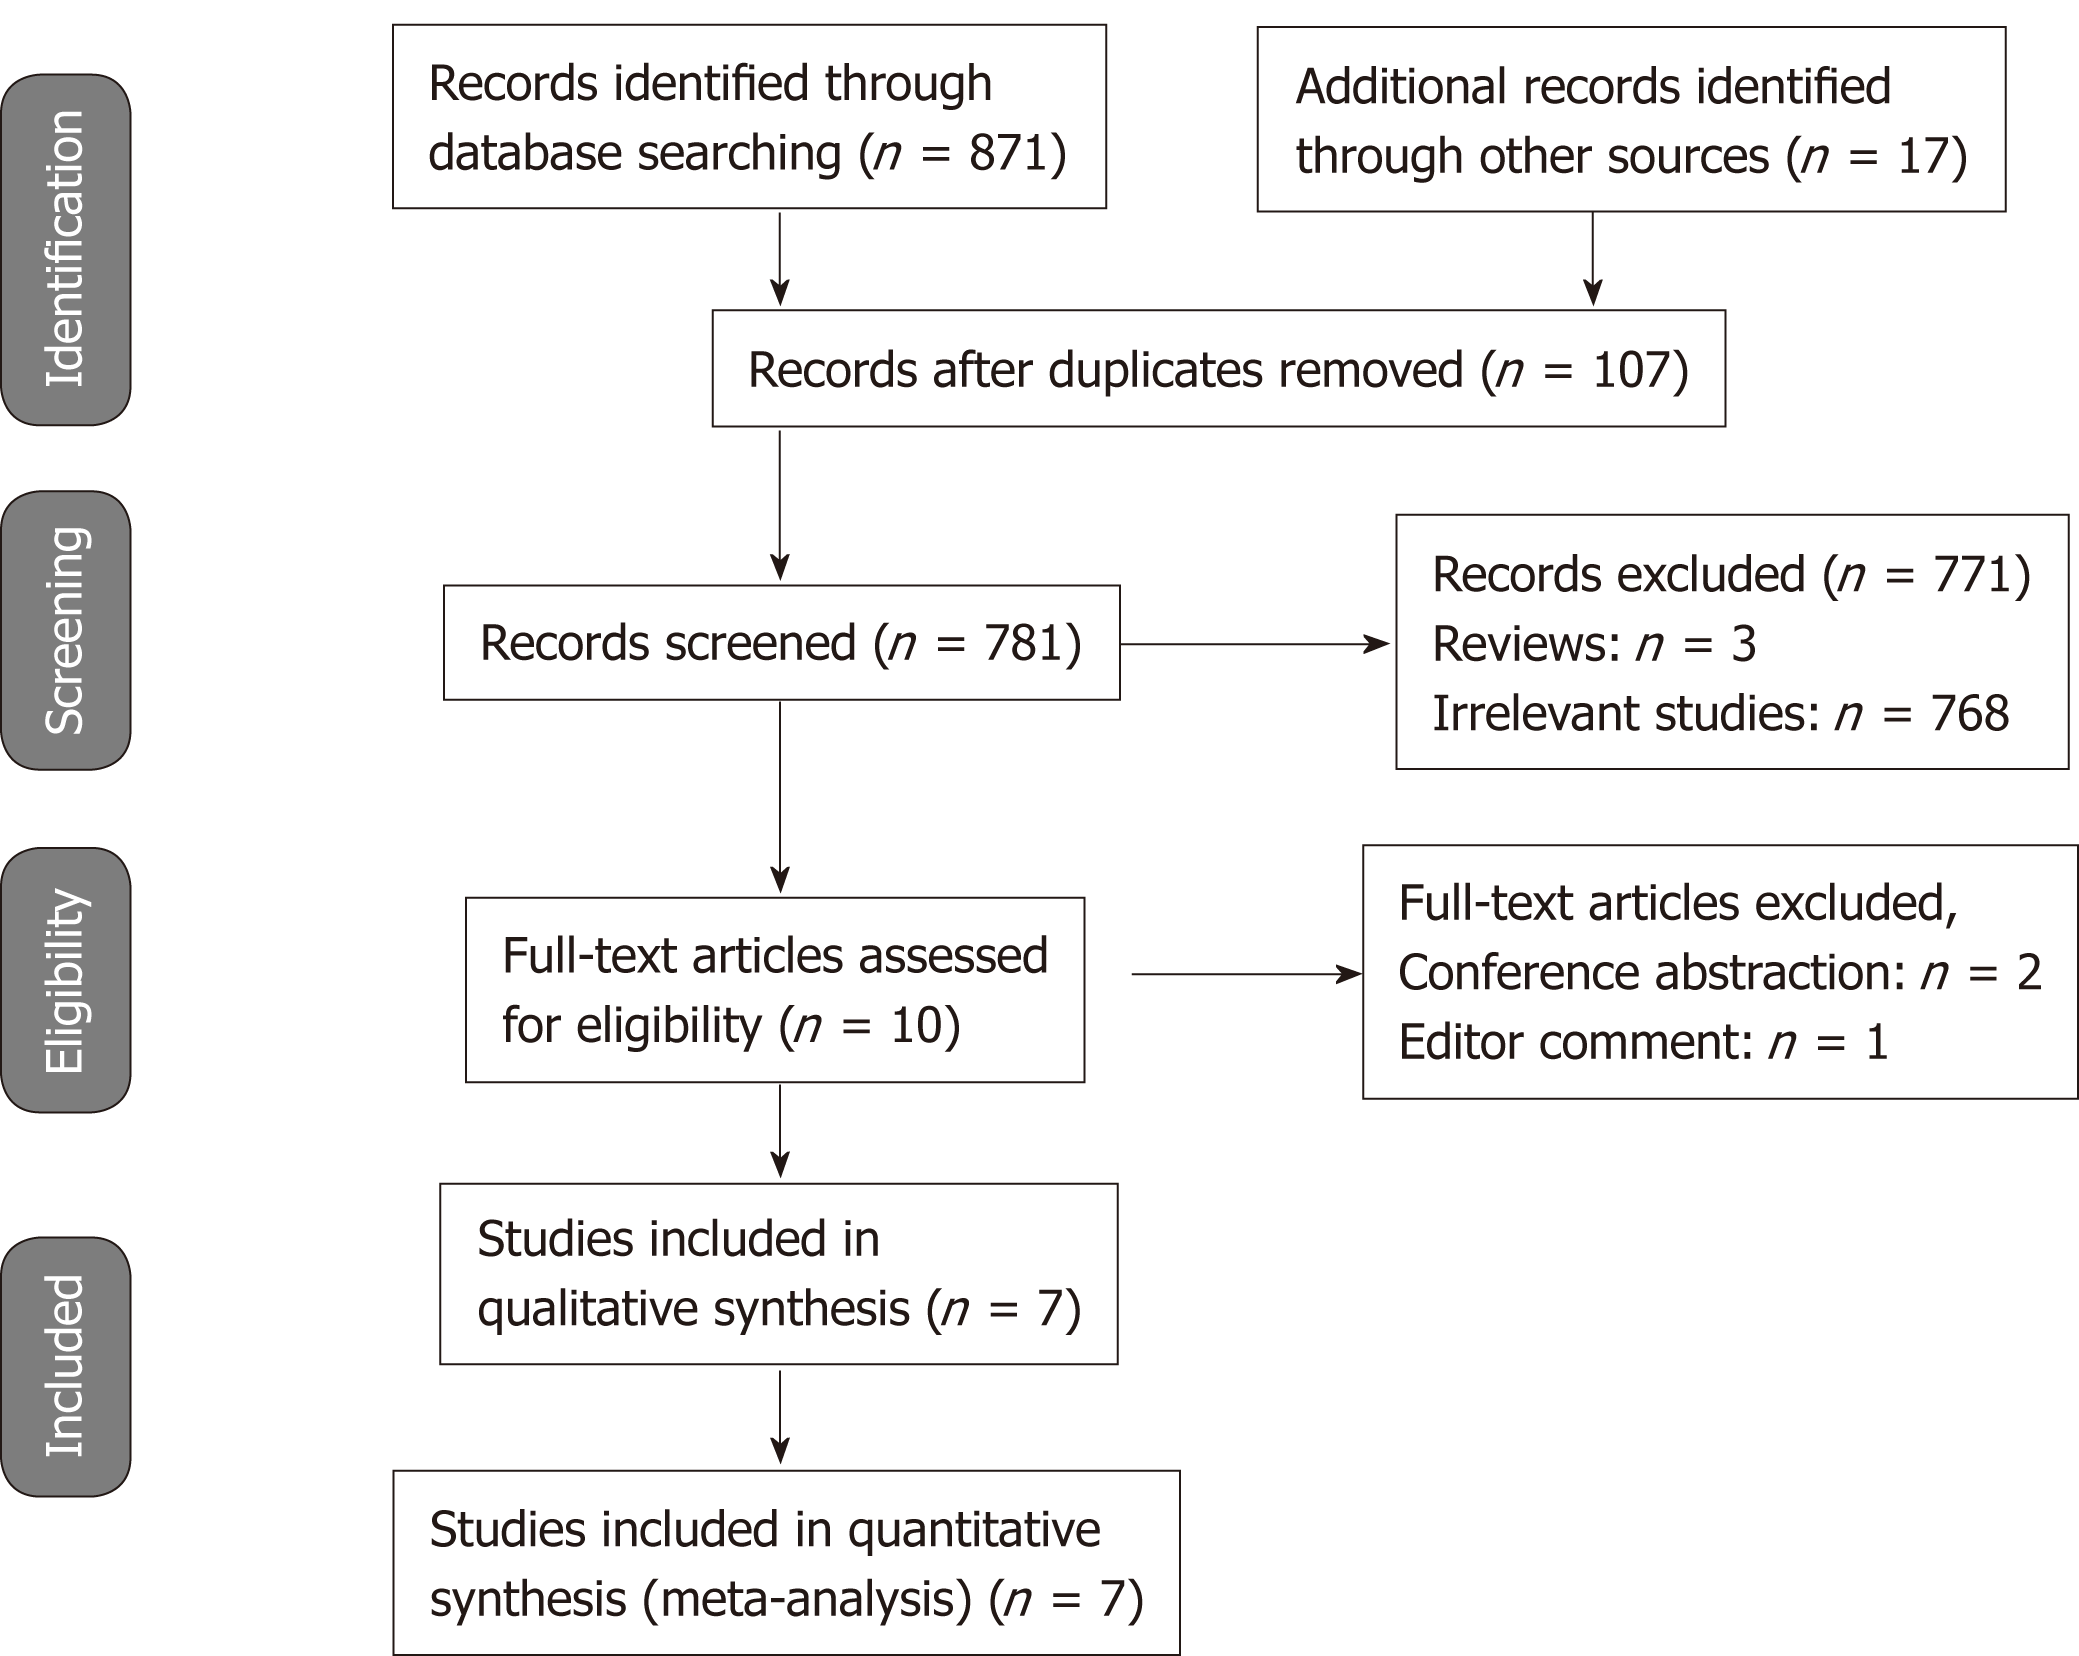
Figure 1 Flowchart of study selection.
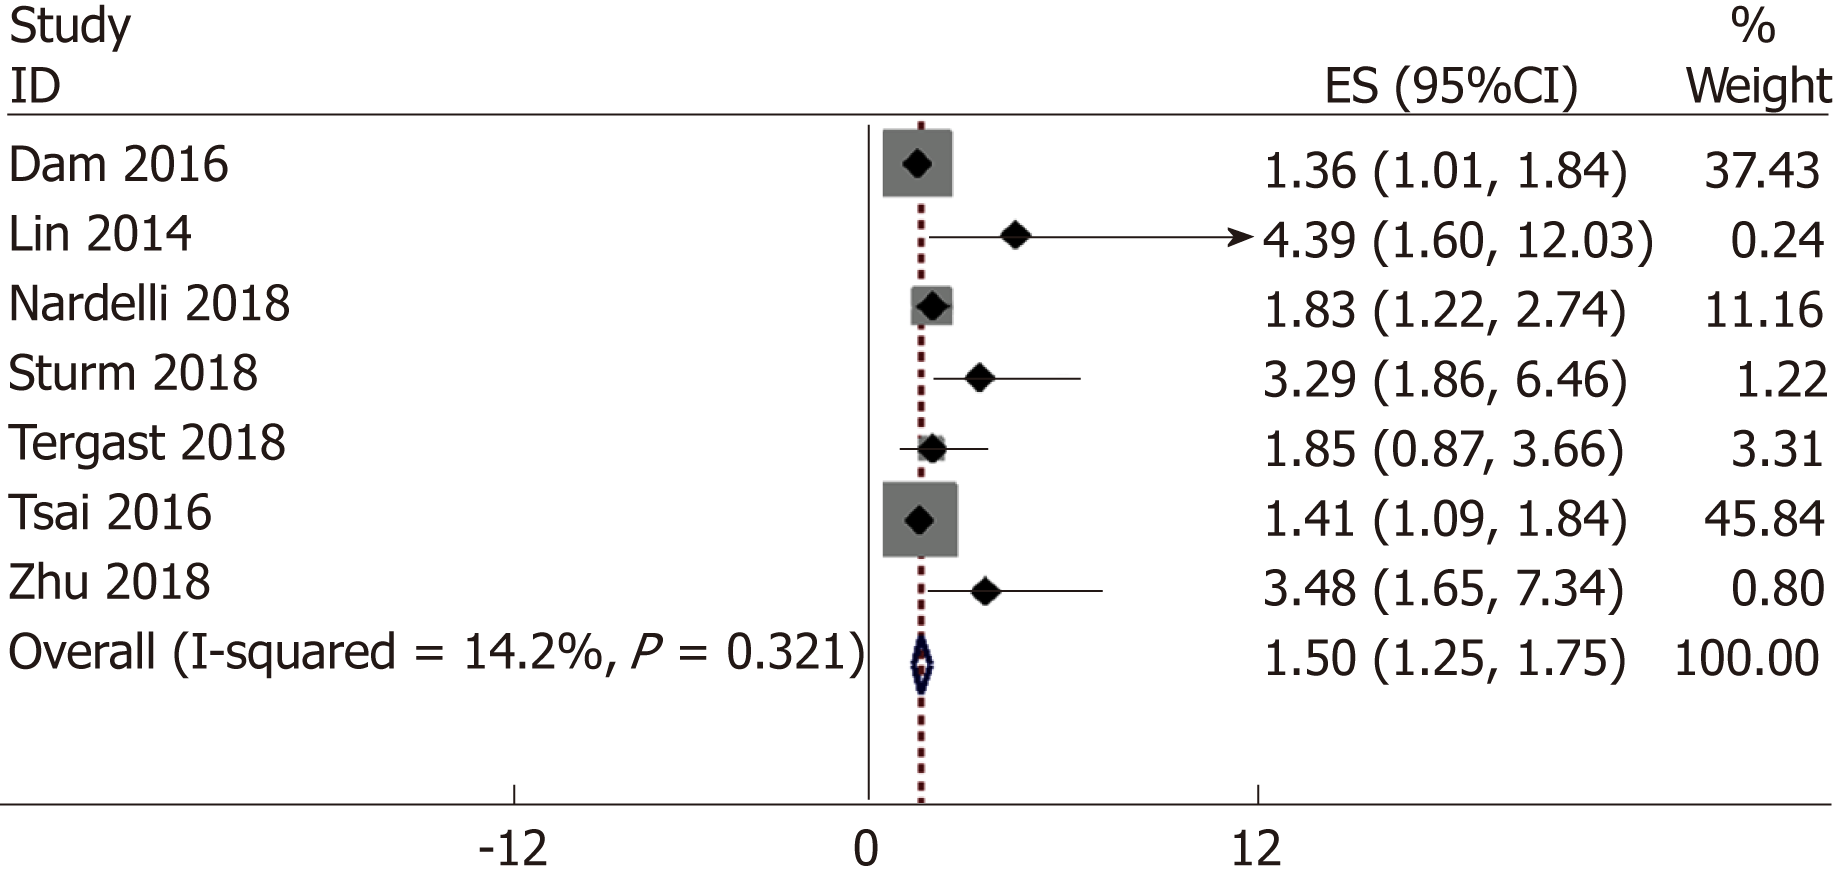
Figure 2 Forest plot of proton pump inhibitor use and hepatic encephalopathy risk.
CI: Confidence interval.
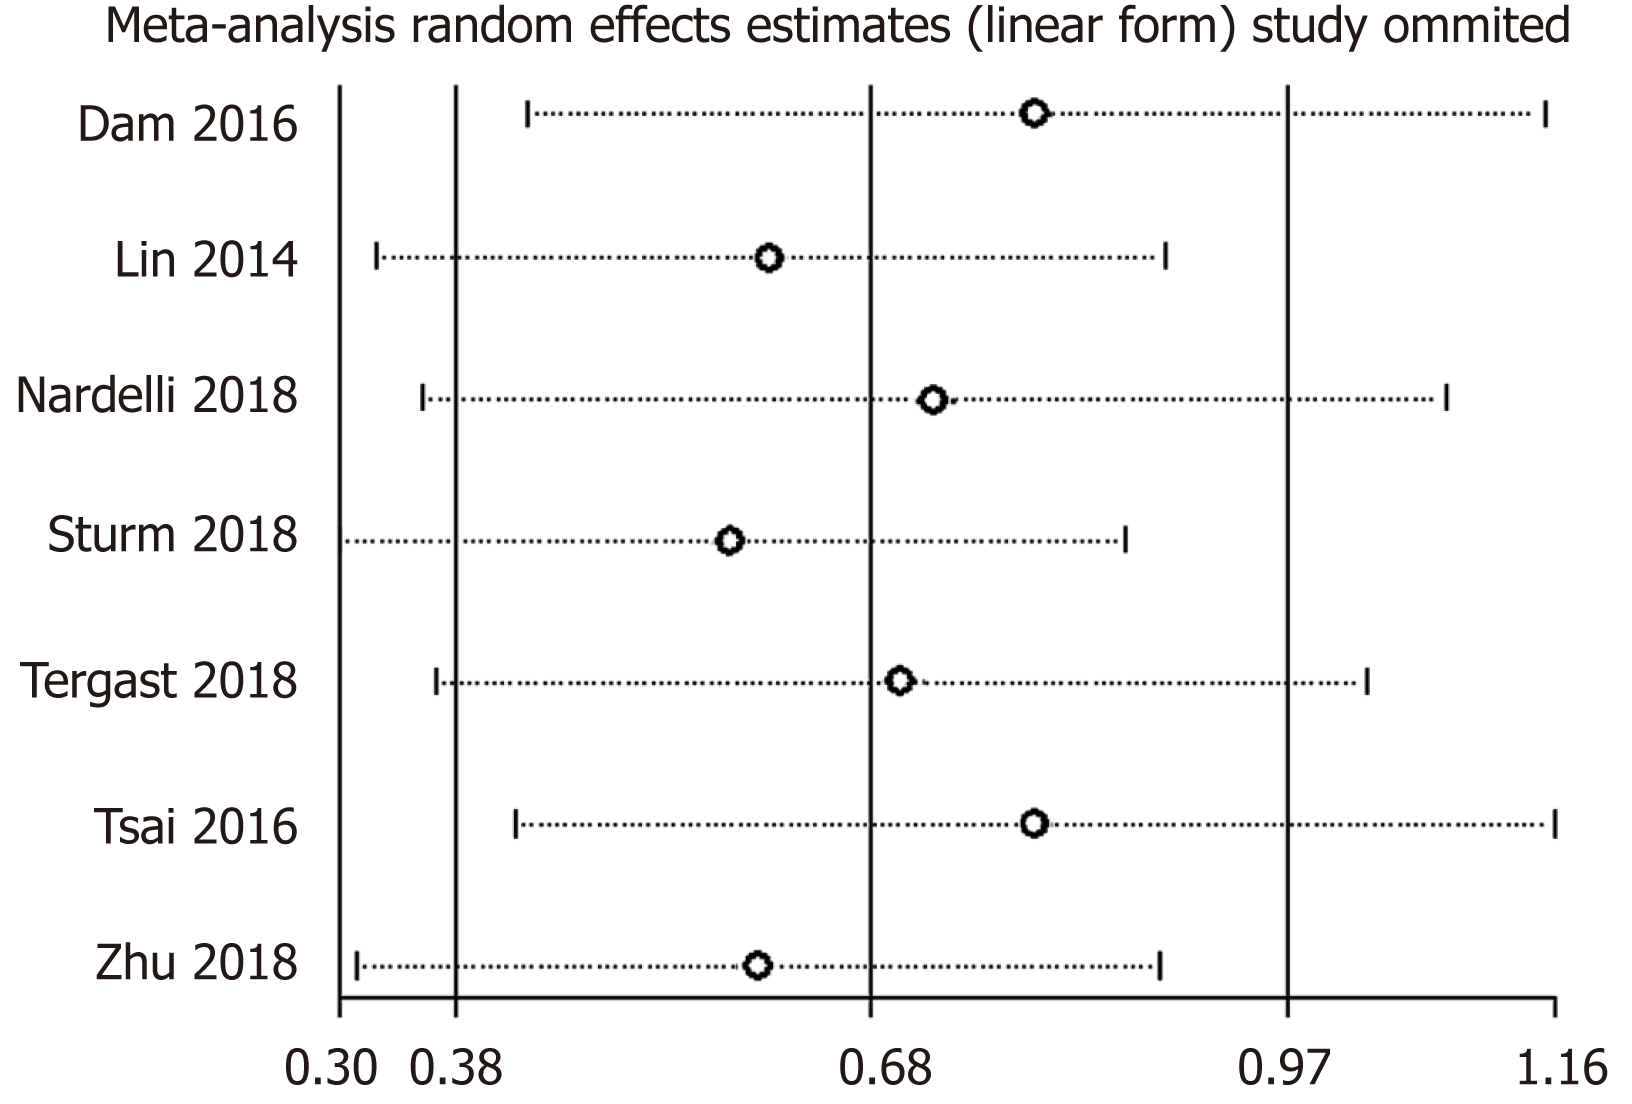
Figure 3 Funnel plot of sensitivity analysis.
Figure 4 Publication bias funnel plot.
A: Begg’s test; B: Egger’s test; C: Trim-and-fill method.
- Citation: Ma YJ, Cao ZX, Li Y, Feng SY. Proton pump inhibitor use increases hepatic encephalopathy risk: A systematic review and meta-analysis. World J Gastroenterol 2019; 25(21): 2675-2682
- URL: https://www.wjgnet.com/1007-9327/full/v25/i21/2675.htm
- DOI: https://dx.doi.org/10.3748/wjg.v25.i21.2675


