Copyright
©The Author(s) 2019.
World J Gastroenterol. Jan 14, 2019; 25(2): 220-232
Published online Jan 14, 2019. doi: 10.3748/wjg.v25.i2.220
Published online Jan 14, 2019. doi: 10.3748/wjg.v25.i2.220
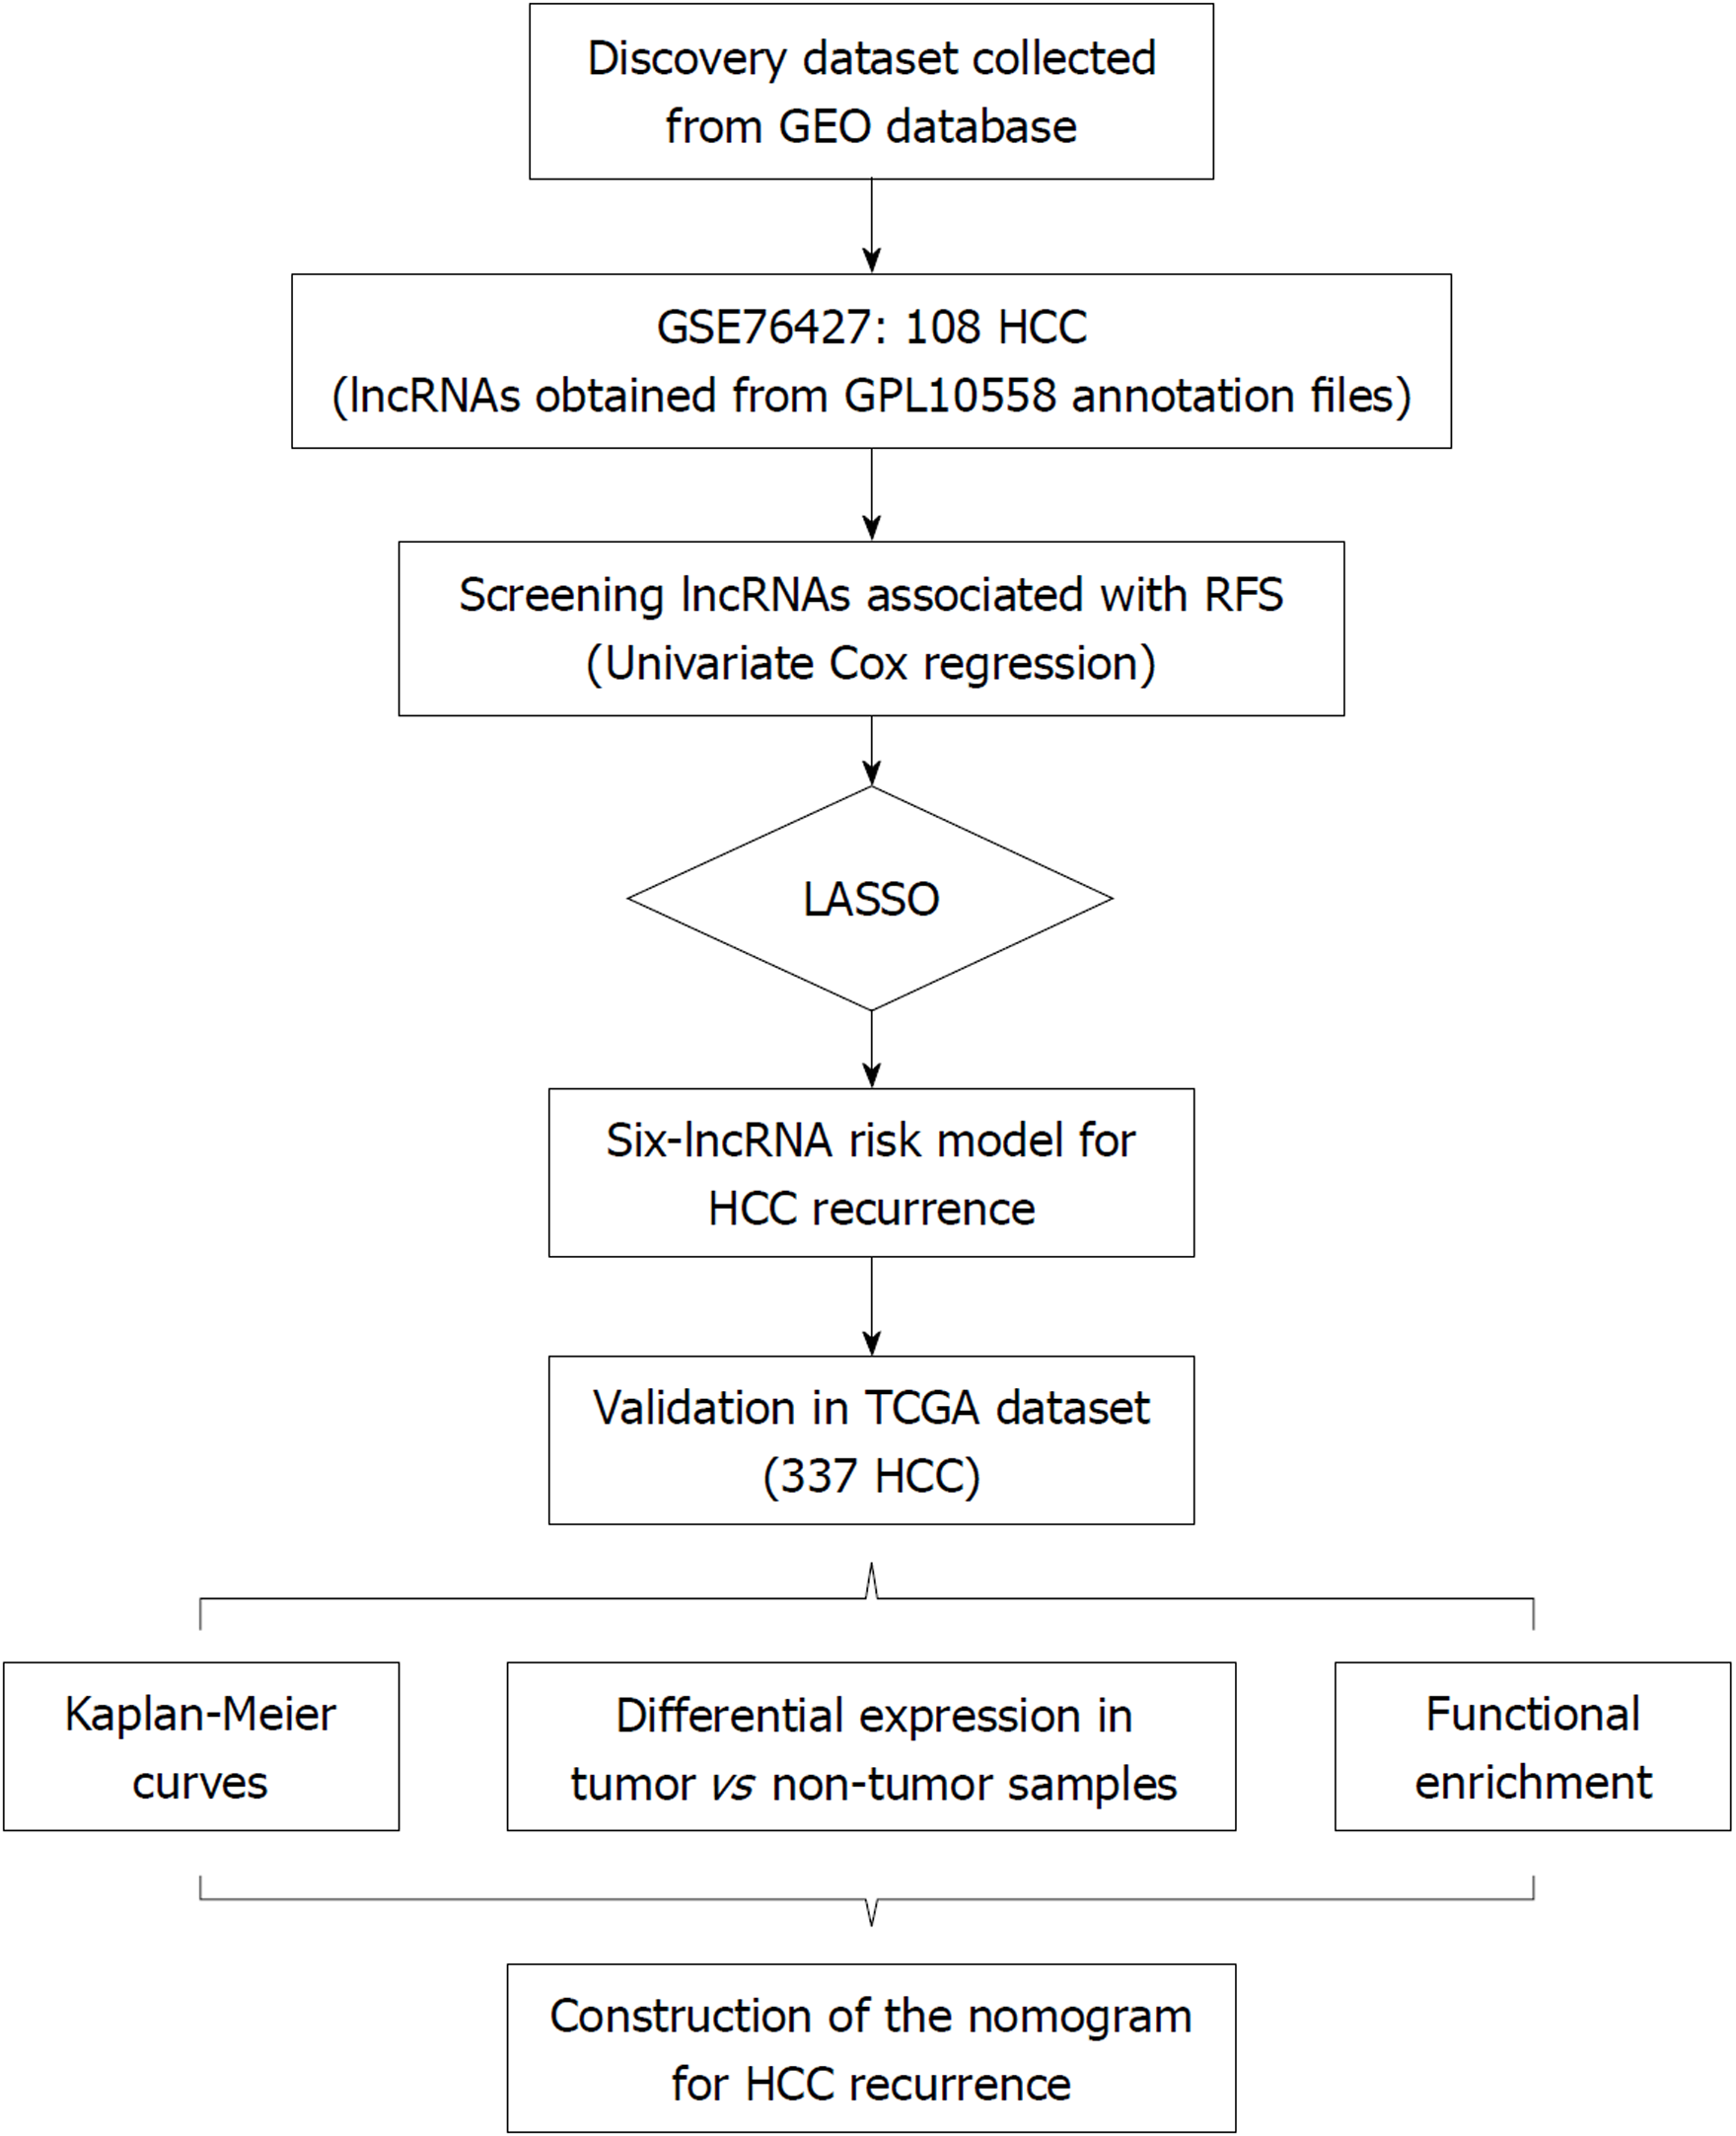
Figure 1 Overall design of the present study.
HCC: Hepatocellular carcinoma; RFS: Recurrence-free survival.
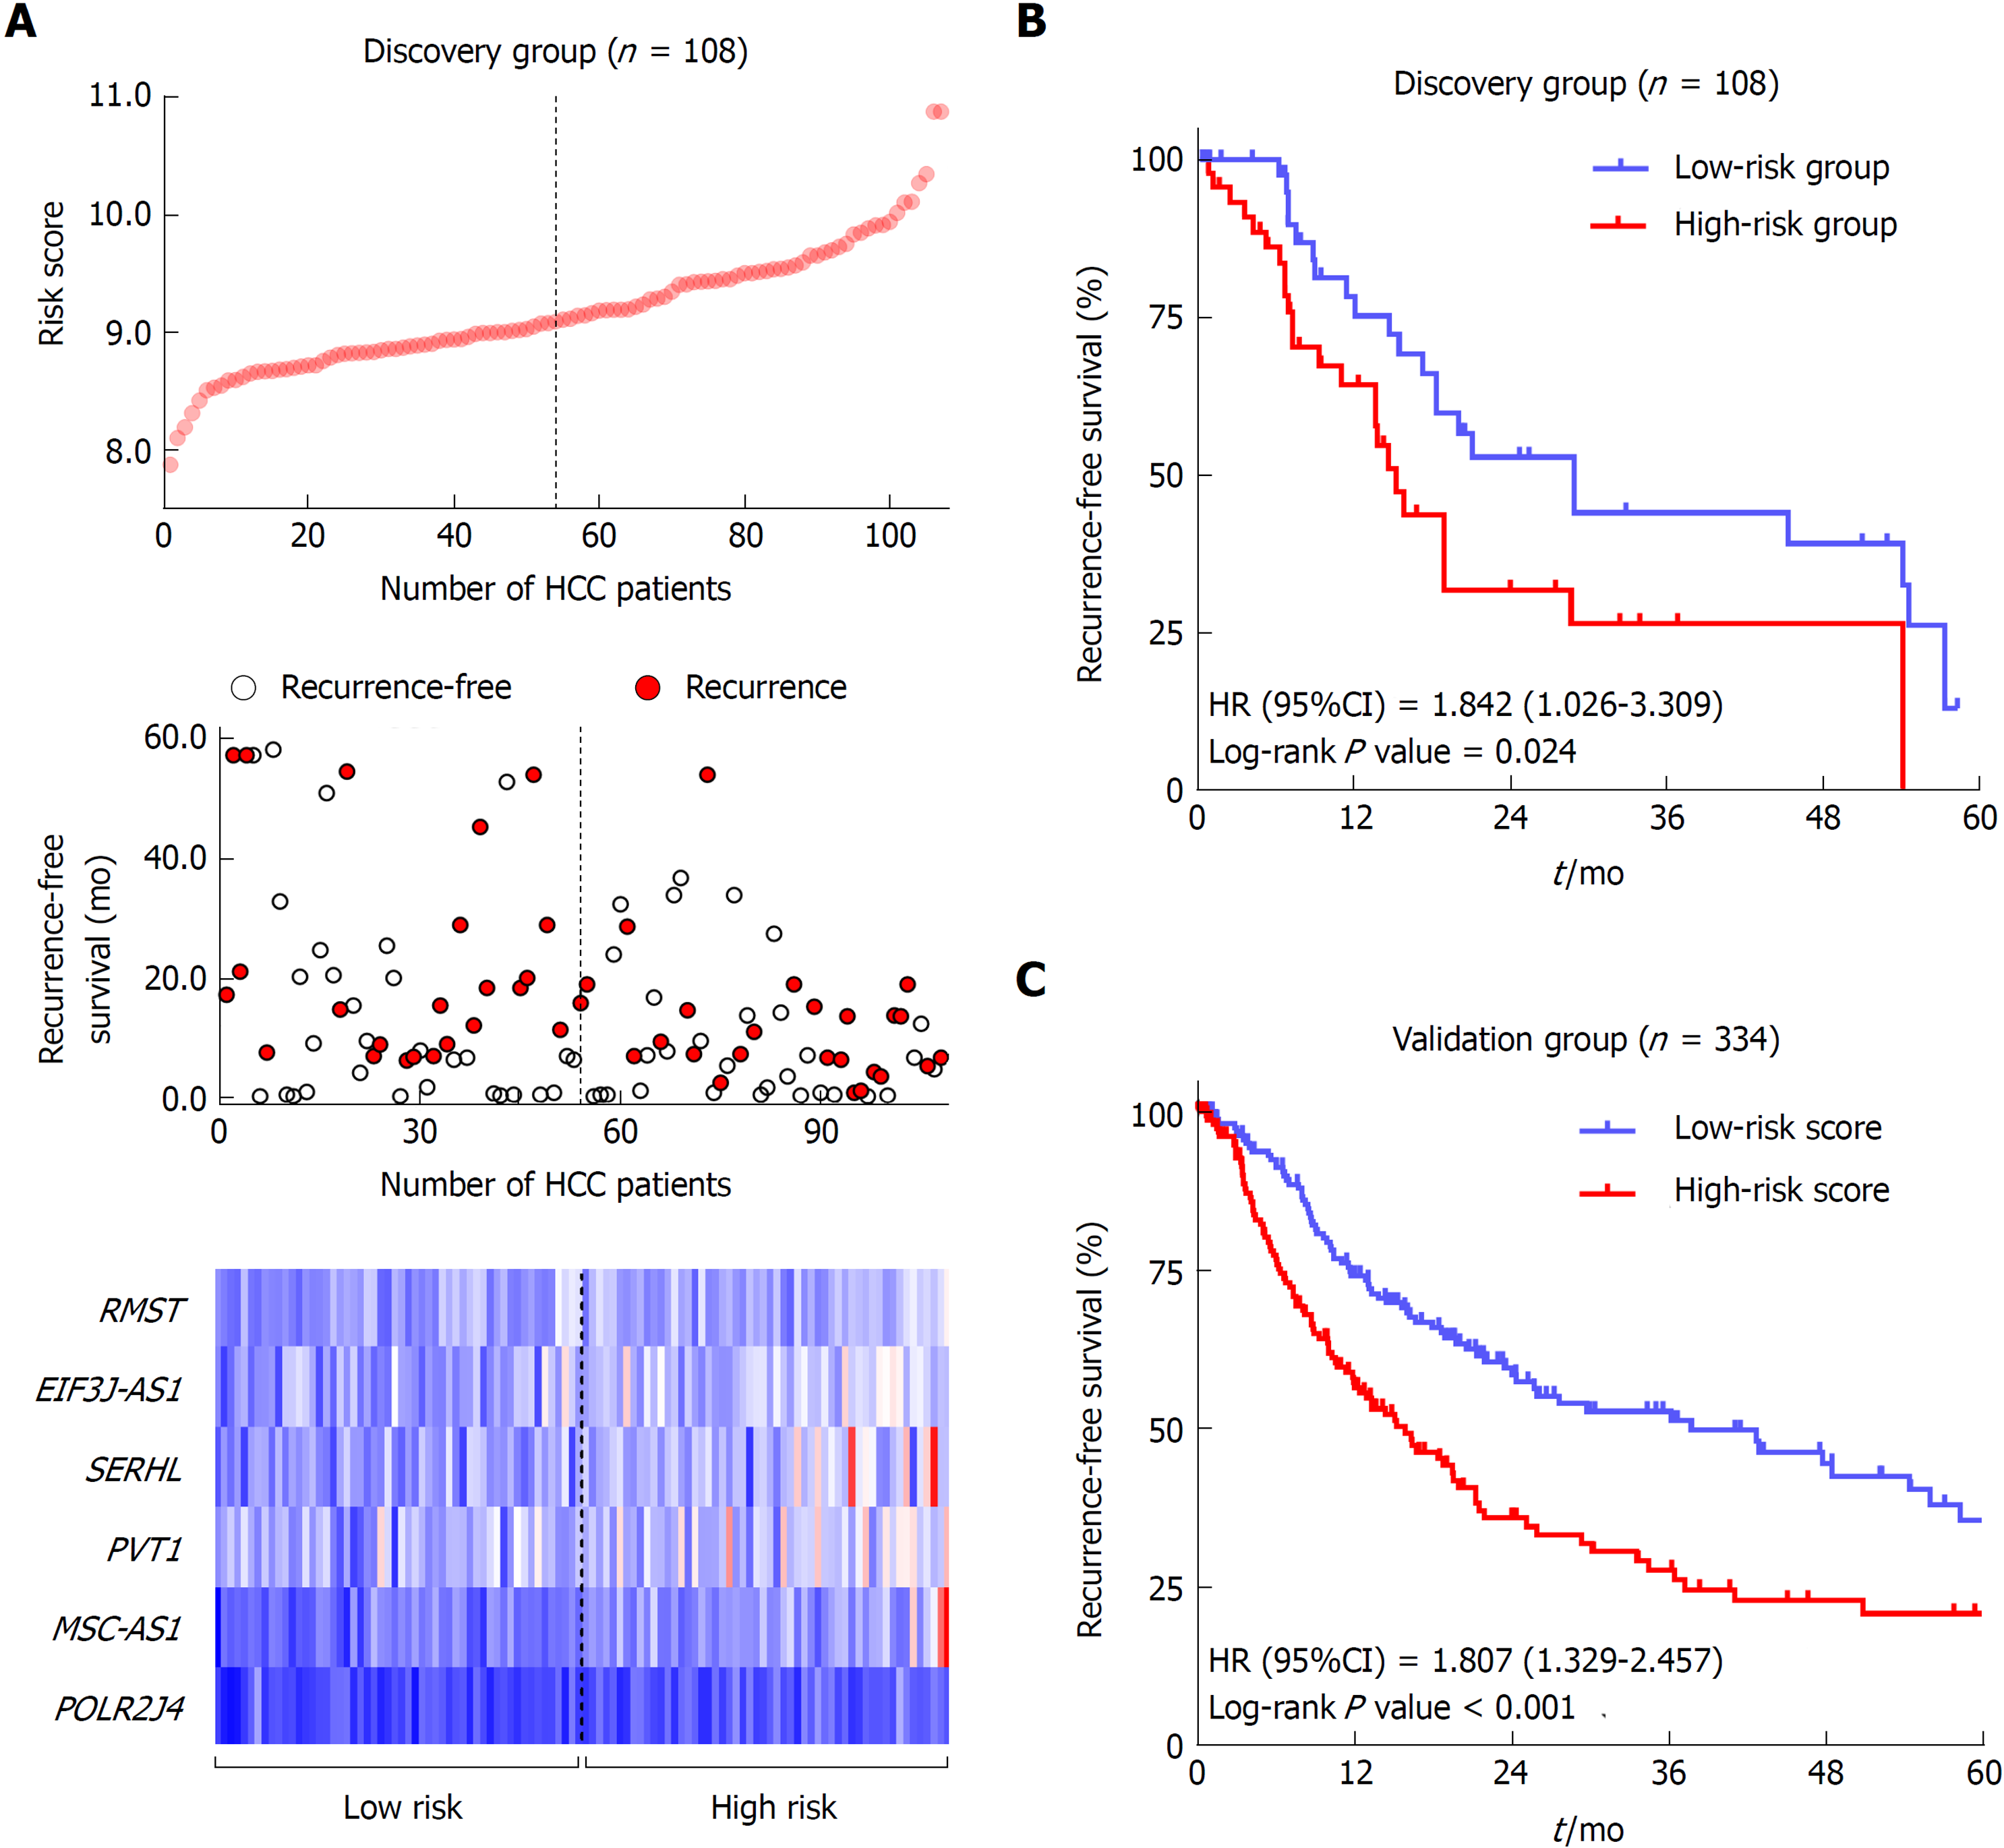
Figure 2 Construction and validation of a prognostic lncRNA signature for hepatocellular carcinoma.
A: LncRNA risk score distribution (Upper), the recurrence status and recurrence-free survival (RFS) period (Middle), and expression profiles of the six lncRNAs (Lower) of the 108 patients in the discovery dataset. B: The Kaplan-Meier curve of the RFS between the high-risk and low-risk groups stratified by the median risk score in GSE76427 series. C: The Kaplan-Meier curve of the RFS between the high-risk and low-risk groups stratified by the median risk score in The Cancer Genome Atlas cohort.
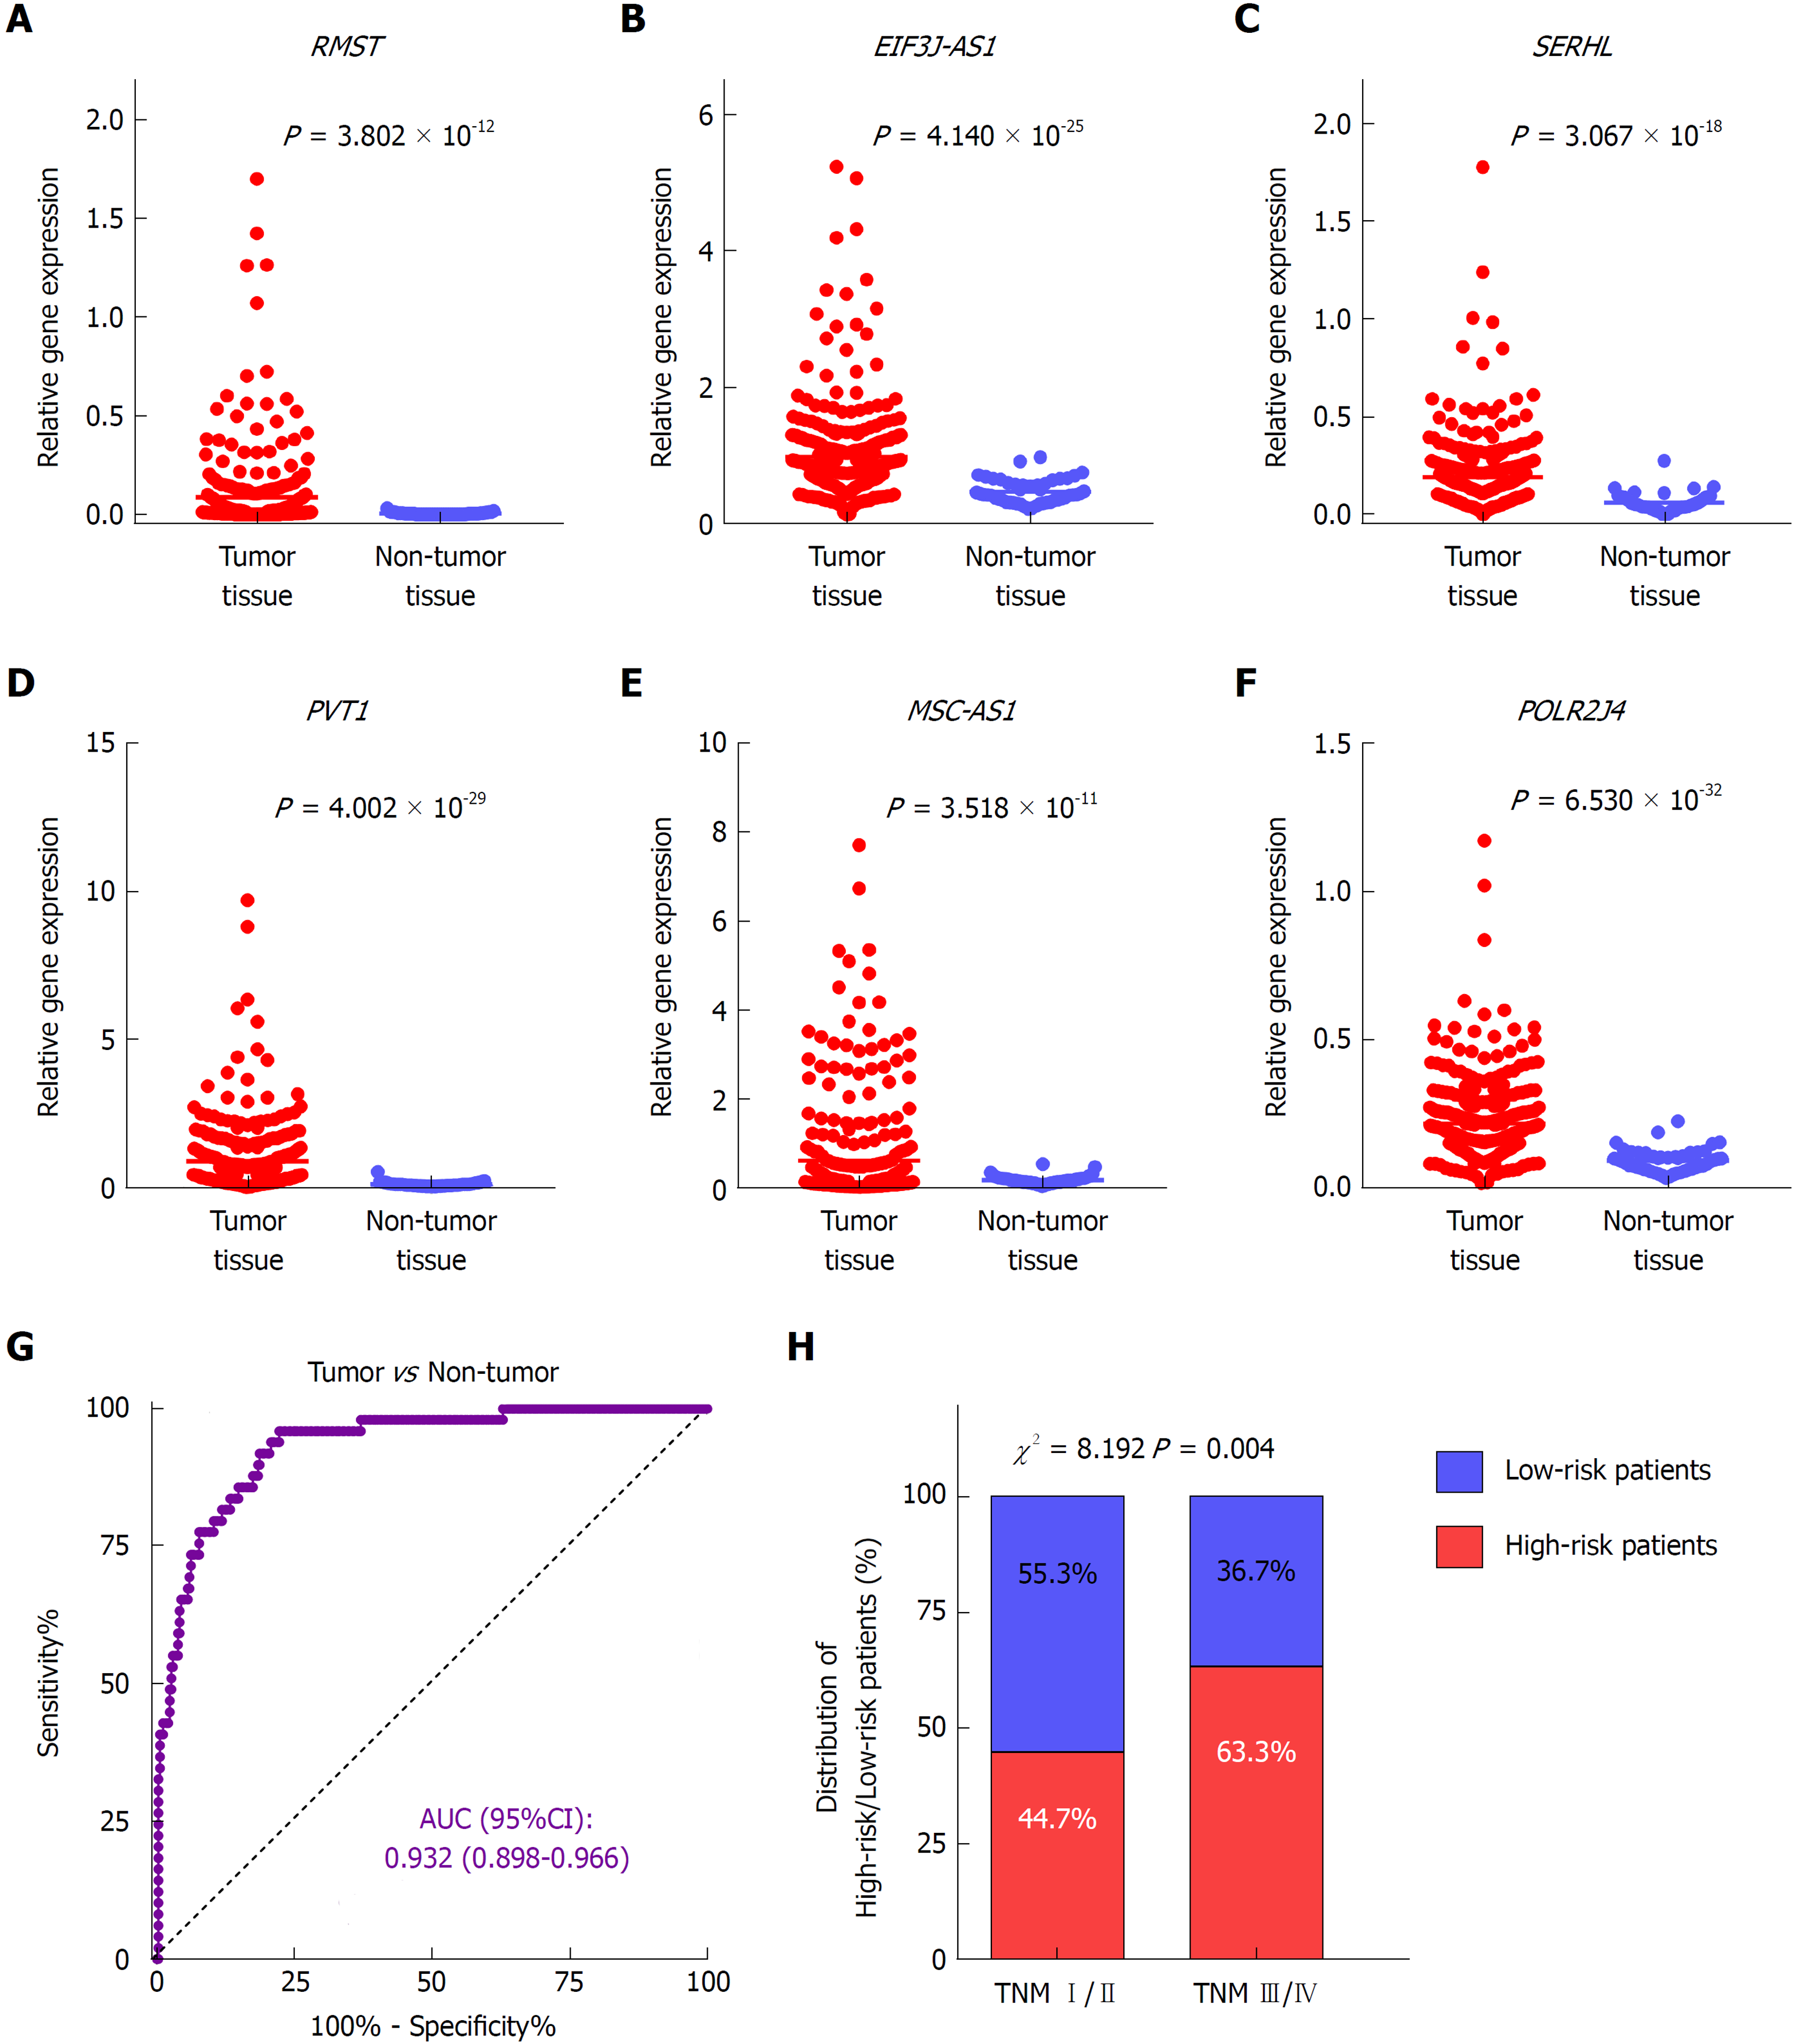
Figure 3 Expression patterns of the six lncRNAs in tumor and non-tumor tissues.
Differential expression of RMST (A), EIF3J-AS1 (B), SERHL (C), PVT1 (D), MSC-AS1 (E), and POLR2J4 (F) between hepatocellular carcinoma and non-cancerous samples. G: The ROC curve of tumor tissue vs non-tumor tissue discriminated by the six-lncRNA signature. (H) Comparisons of the distribution of high-risk and low-risk patients in early stage (TNM I/II) and late stage (TNM III/IV) by the chi-square test.
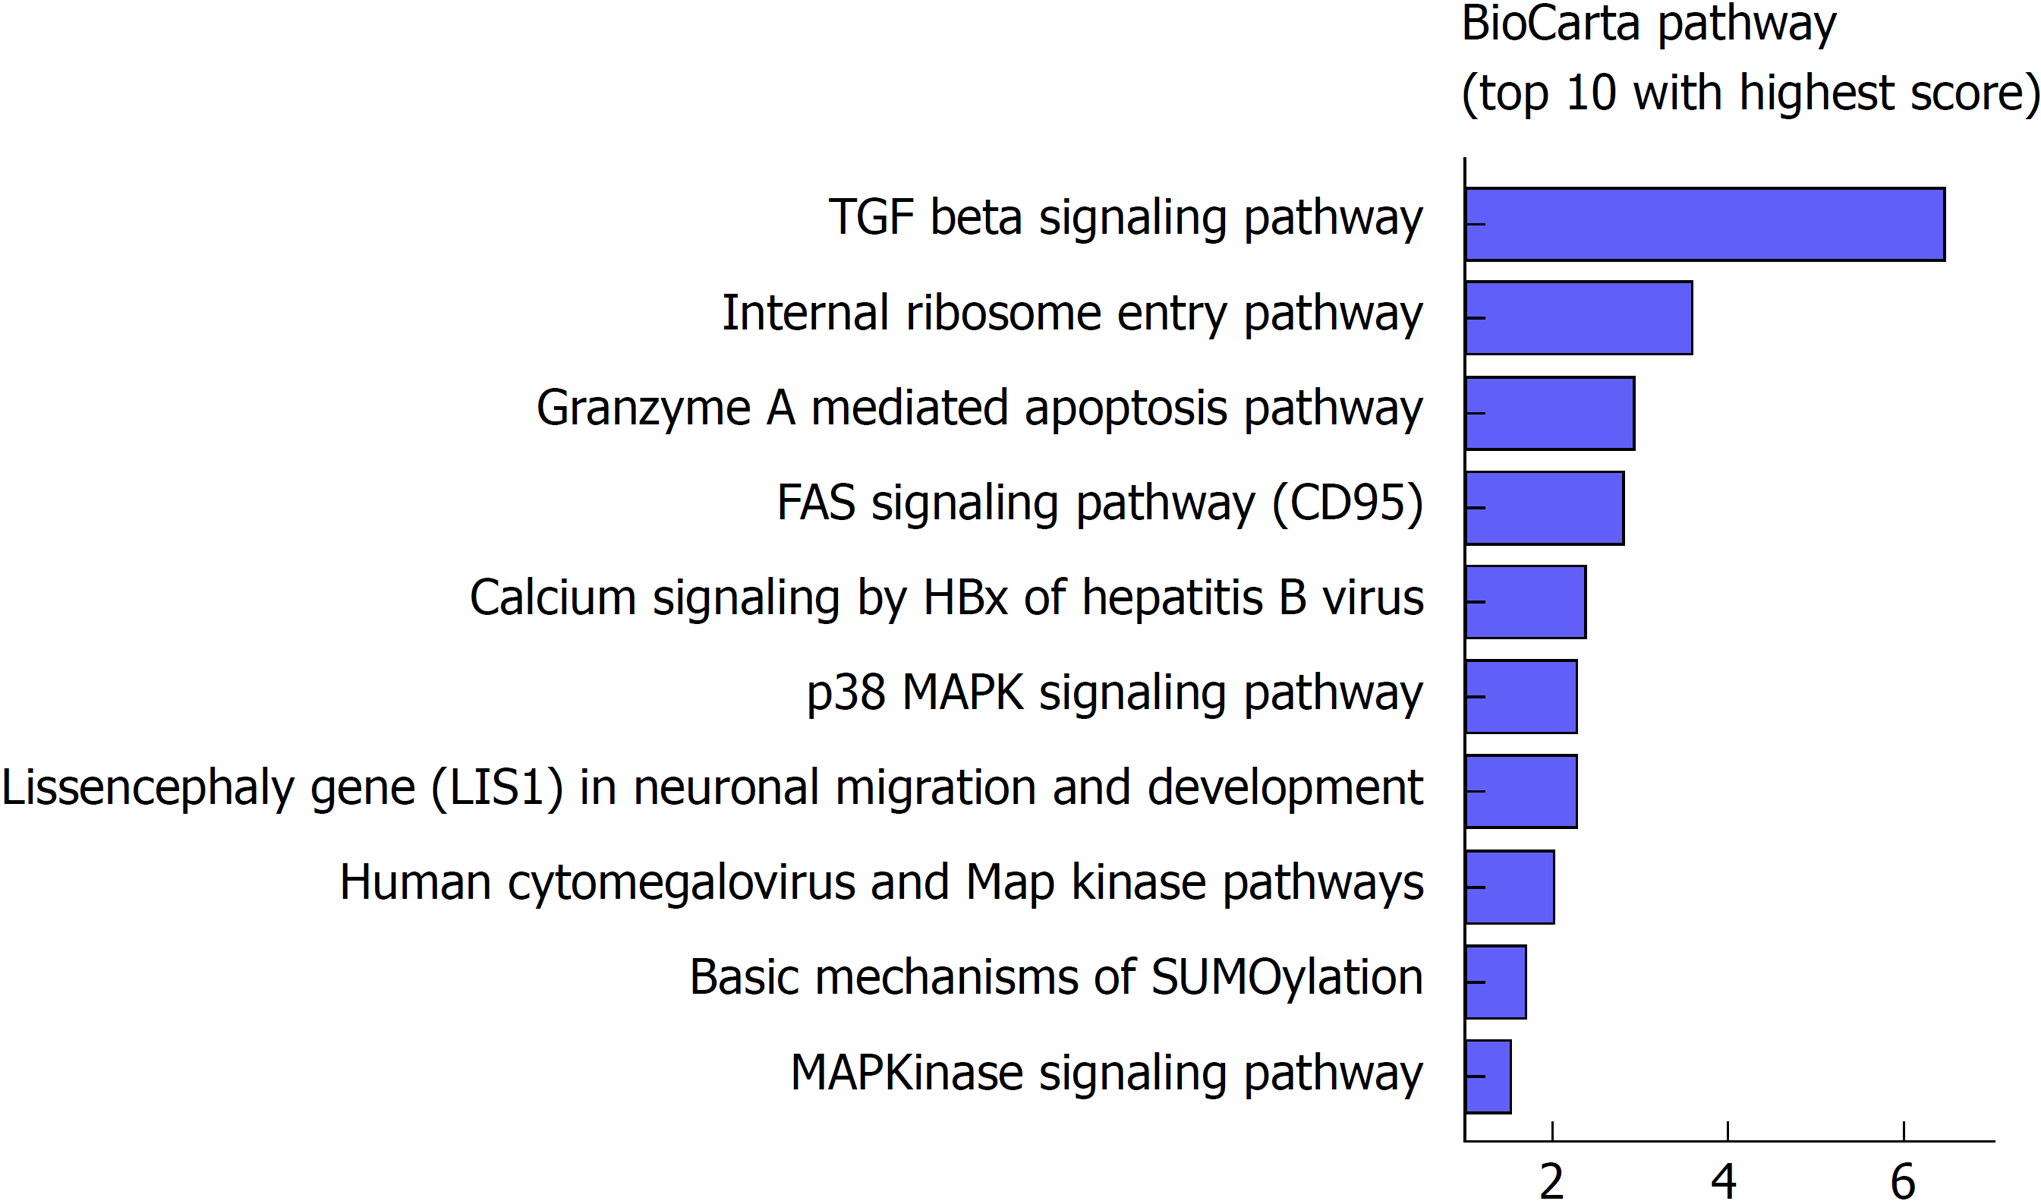
Figure 4 Functional annotation of the six lncRNAs.
Top 10 significantly enriched BioCarta pathways using the co-expressed mRNAs of the six lncRNAs in The Cancer Genome Atlas database.
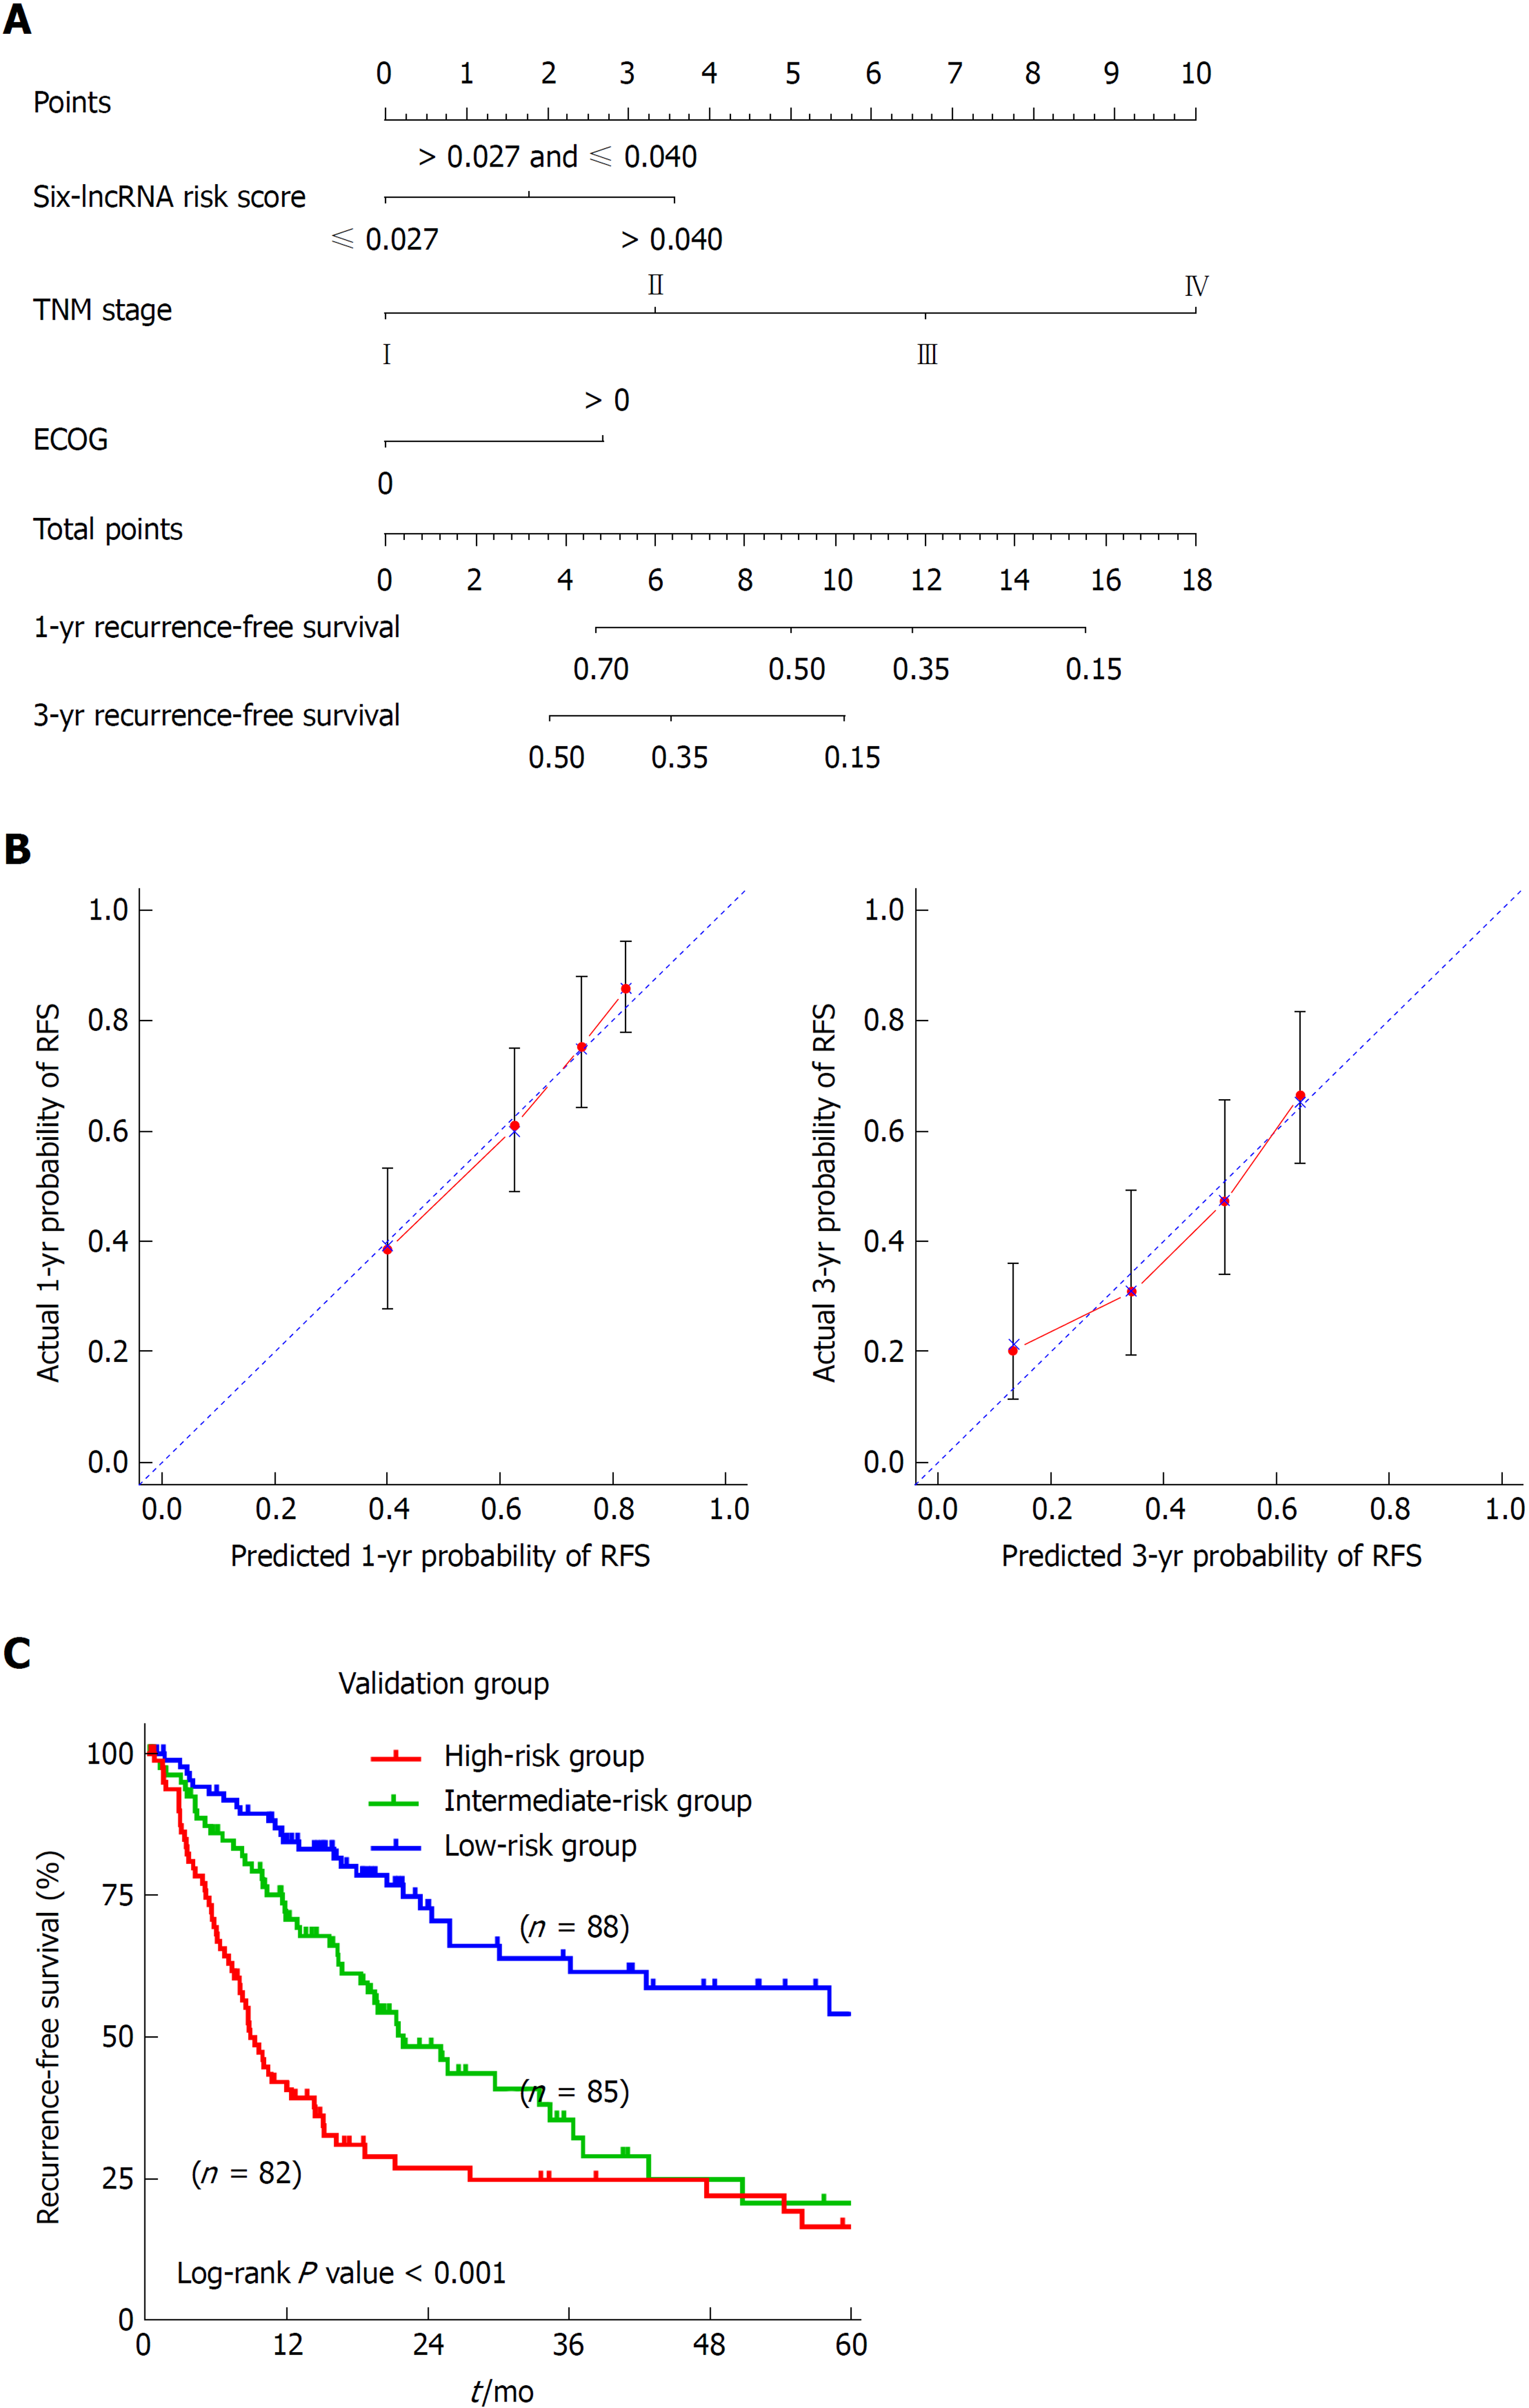
Figure 5 Construction of a nomogram for recurrence-free survival prediction in hepatocellular carcinoma.
A: The composite nomogram consists of the six-lncRNA score, TNM stage, and ECOG score. Each component generates their respective points according to the “Points” line drawn above. Add the points from three variables together and find the location of the total points on “Total Points” line. Then draw a vertical line from “Total Points” axis to the two lower lines which corresponds to the predicted 1-year and 3-yr recurrence-free survival (RFS) rates by the nomogram. B: Calibration curves of the nomogram for the estimation of RFS rates at 1-year (Left) and 3-years (Right). The predicted and actual 1-yr and 3-yr RFS-probabilities were drawn on the x and y axis, respectively. C: The Kaplan-Meier curve of three risk subgroups stratified by the tertiles of total points derived from the nomogram.
- Citation: Gu JX, Zhang X, Miao RC, Xiang XH, Fu YN, Zhang JY, Liu C, Qu K. Six-long non-coding RNA signature predicts recurrence-free survival in hepatocellular carcinoma. World J Gastroenterol 2019; 25(2): 220-232
- URL: https://www.wjgnet.com/1007-9327/full/v25/i2/220.htm
- DOI: https://dx.doi.org/10.3748/wjg.v25.i2.220


