Copyright
©The Author(s) 2019.
World J Gastroenterol. Mar 28, 2019; 25(12): 1513-1523
Published online Mar 28, 2019. doi: 10.3748/wjg.v25.i12.1513
Published online Mar 28, 2019. doi: 10.3748/wjg.v25.i12.1513
Figure 1 Examples of the multi-echo Dixon (left) and magnetic resonance spectroscopy (right) in four different participants with different percentages of proton density fat fraction values.
A: Participant 1 has a high value of proton density fat fraction (PDFF) of 39.0% measured by multi-echo Dixon (ME Dixon) (left) and 37.8% by magnetic resonance spectroscopy (MRS) (right); B: Measurements in participant 2 show a fat fraction of about 23.9% in ME Dixon (left) and 22.3% by MRS (right); C: In participant 3, ME Dixon (left) demonstrates a liver fat content of about 11.5% and MRS (right) shows a measurement of 11.2%; D: ME Dixon (left) and MRS (right), respectively, assess a fat fraction of about 2.2% and 2.0% in participant 4; The manual measurements of the region of interest are shown in the MRI-PDFF maps (left). The spectrum of MRS for the first acquired echo times and T2 exponential decay and the estimated fat fractions (below the colored bar) are shown (right). ME Dixon: Multi-echo Dixon; MRS: Magnetic resonance spectroscopy; PDFF: Proton density fat fraction.
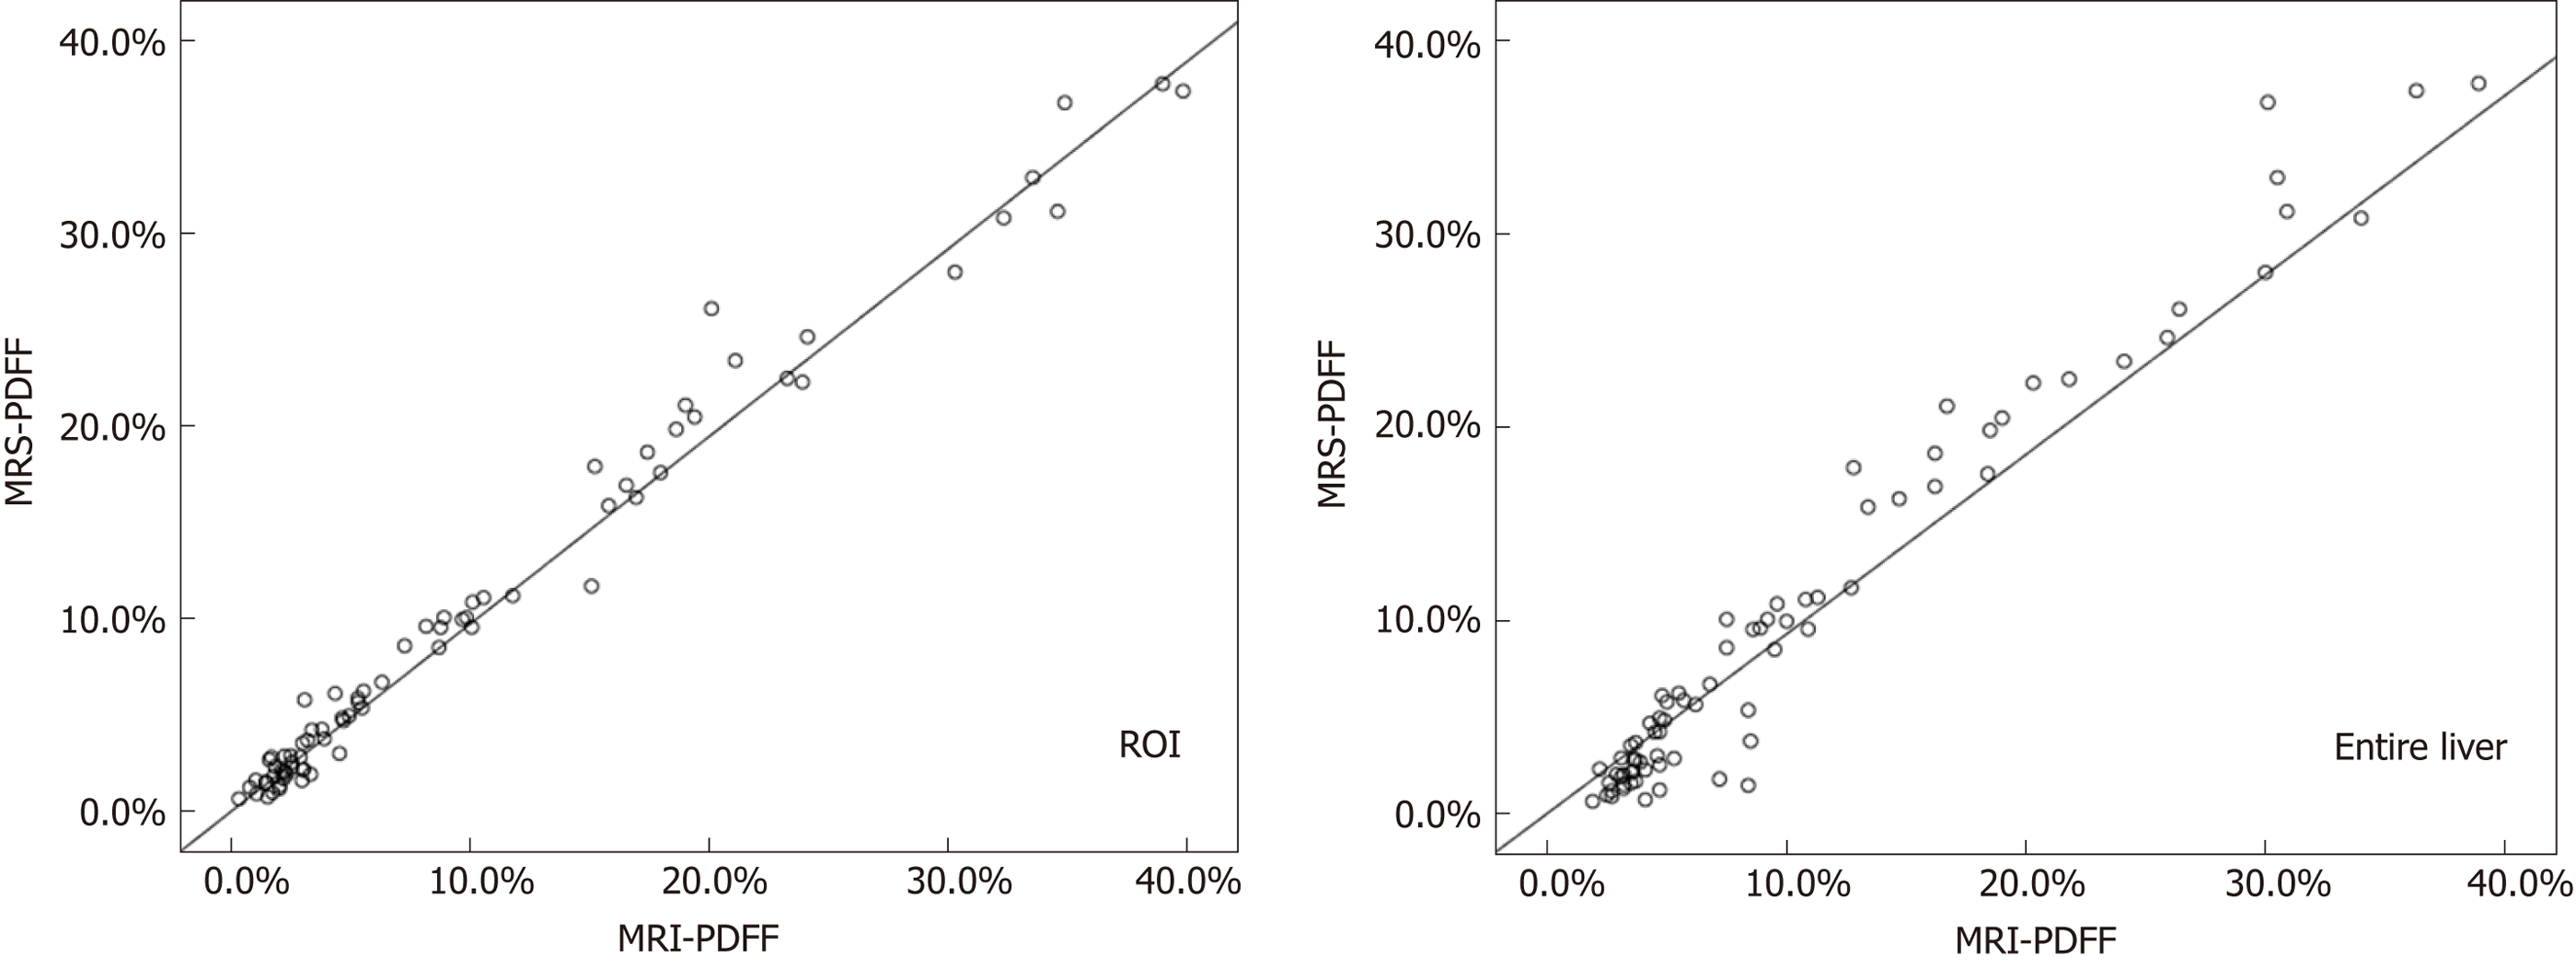
Figure 2 Scatter plots displaying the results of magnetic resonance spectroscopy proton density fat fraction and magnetic resonance imaging proton density fat fraction based on the region of interest (left) and the entire liver (right).
MRS: Magnetic resonance spectroscopy; PDFF: Proton density fat fraction; ROI: Region of interest; MRI: Magnetic resonance imaging.
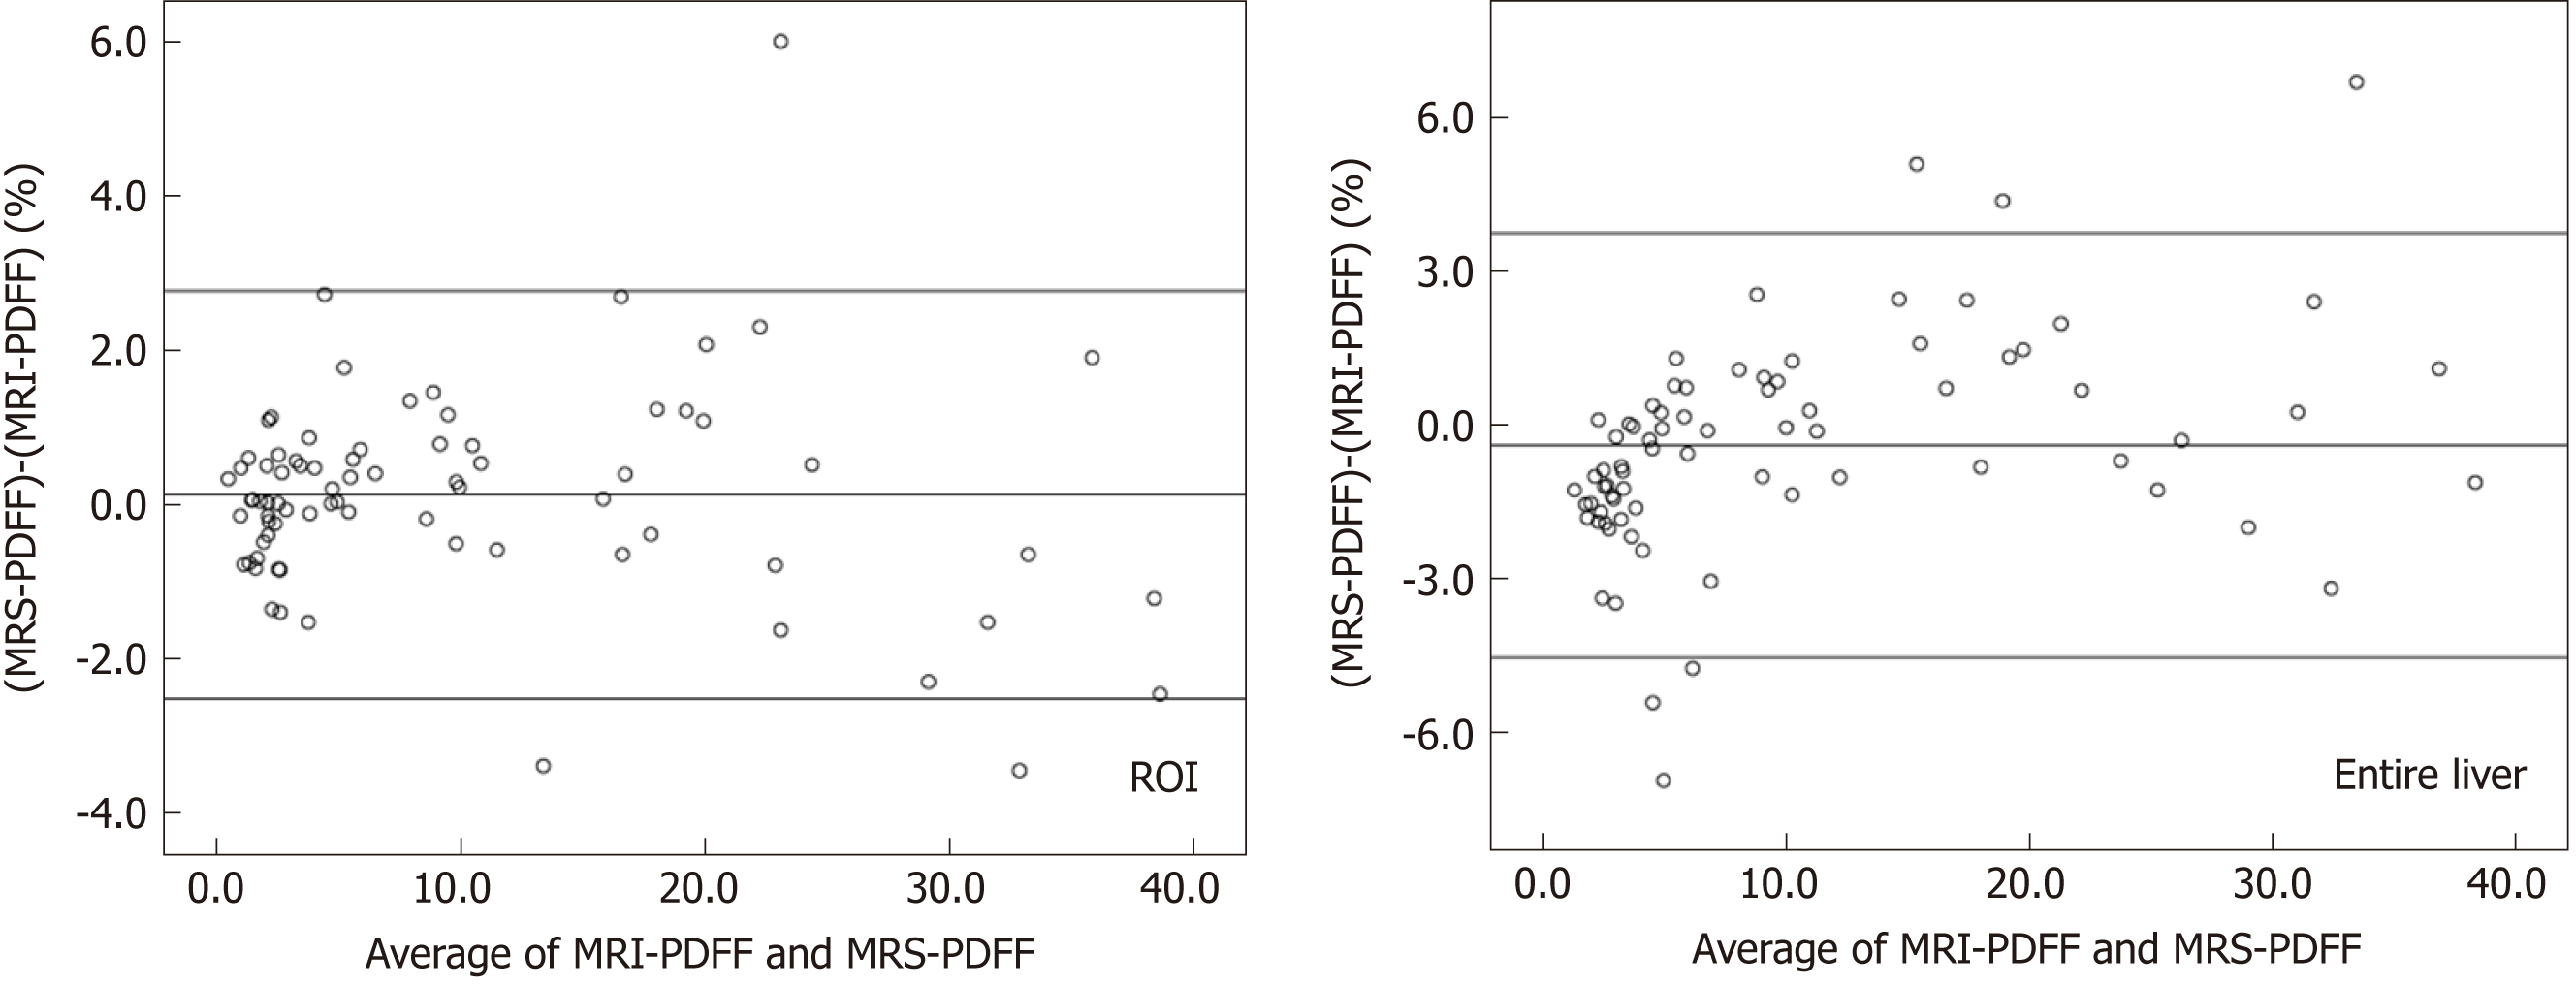
Figure 3 Bland-Altman analysis between magnetic resonance spectroscopy proton density fat fraction and magnetic resonance imaging proton density fat fraction based on the region of interest (left) and the entire liver (right).
MRS: Magnetic resonance spectroscopy; PDFF: Proton density fat fraction; ROI: Region of interest; MRI: Magnetic resonance imaging.
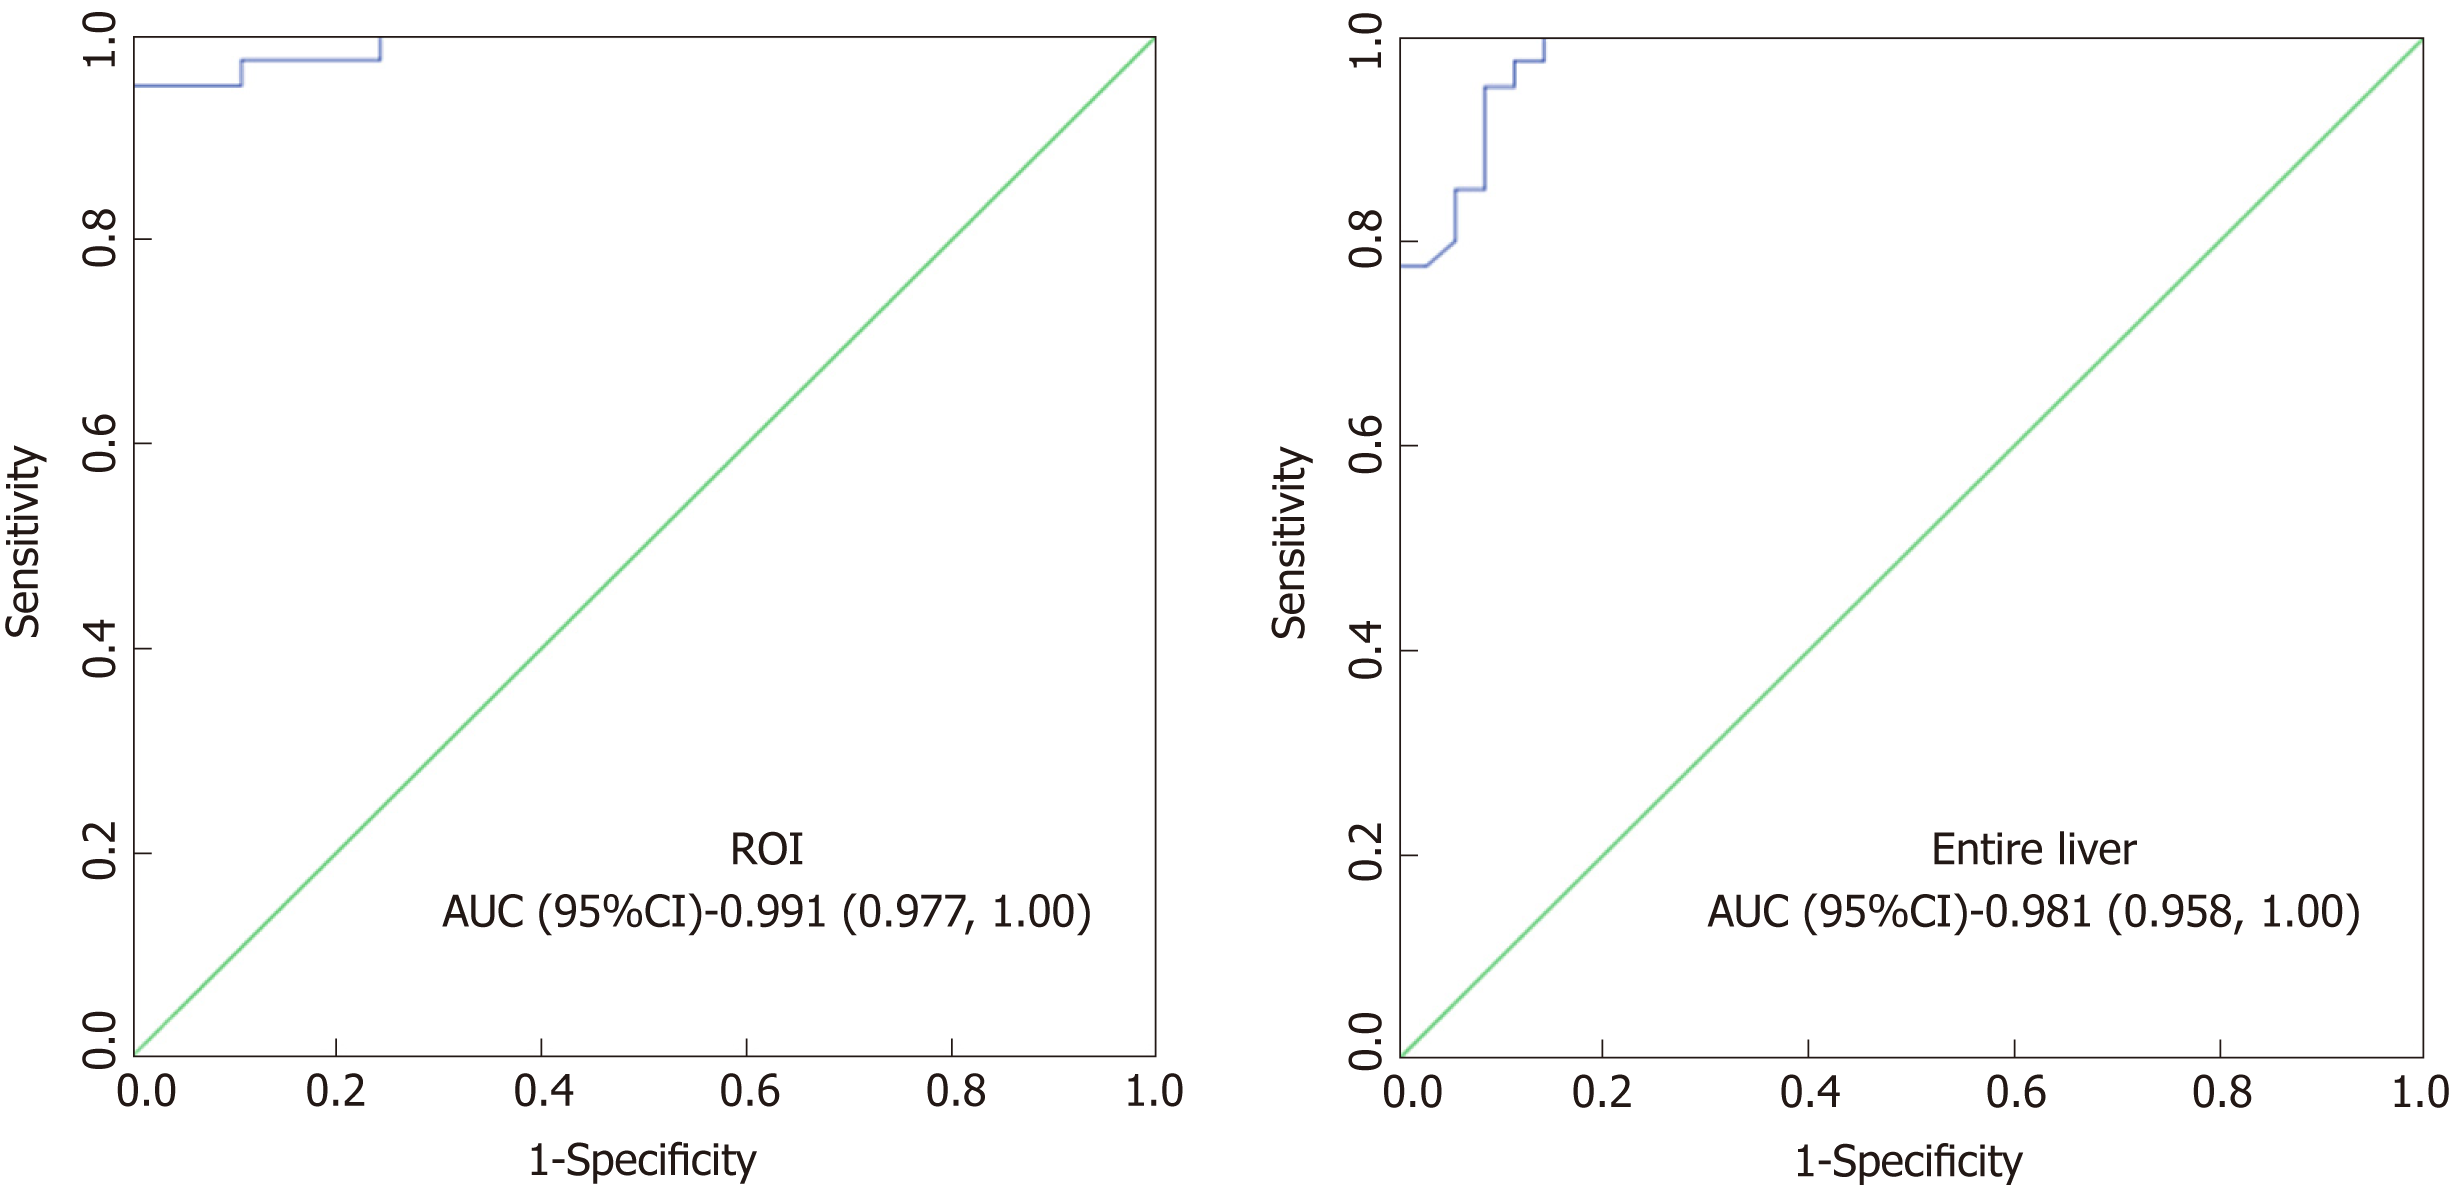
Figure 4 Receiver operating characteristics analysis of magnetic resonance imaging proton density fat fraction, with magnetic resonance spectroscopy proton density fat fraction as a reference.
ROI: region of interest; AUC: Area under the curve; CI: Confidence interval.
- Citation: Zhao YZ, Gan YG, Zhou JL, Liu JQ, Cao WG, Cheng SM, Bai DM, Wang MZ, Gao FQ, Zhou SM. Accuracy of multi-echo Dixon sequence in quantification of hepatic steatosis in Chinese children and adolescents. World J Gastroenterol 2019; 25(12): 1513-1523
- URL: https://www.wjgnet.com/1007-9327/full/v25/i12/1513.htm
- DOI: https://dx.doi.org/10.3748/wjg.v25.i12.1513


