Copyright
©The Author(s) 2018.
World J Gastroenterol. Feb 21, 2018; 24(7): 819-832
Published online Feb 21, 2018. doi: 10.3748/wjg.v24.i7.819
Published online Feb 21, 2018. doi: 10.3748/wjg.v24.i7.819
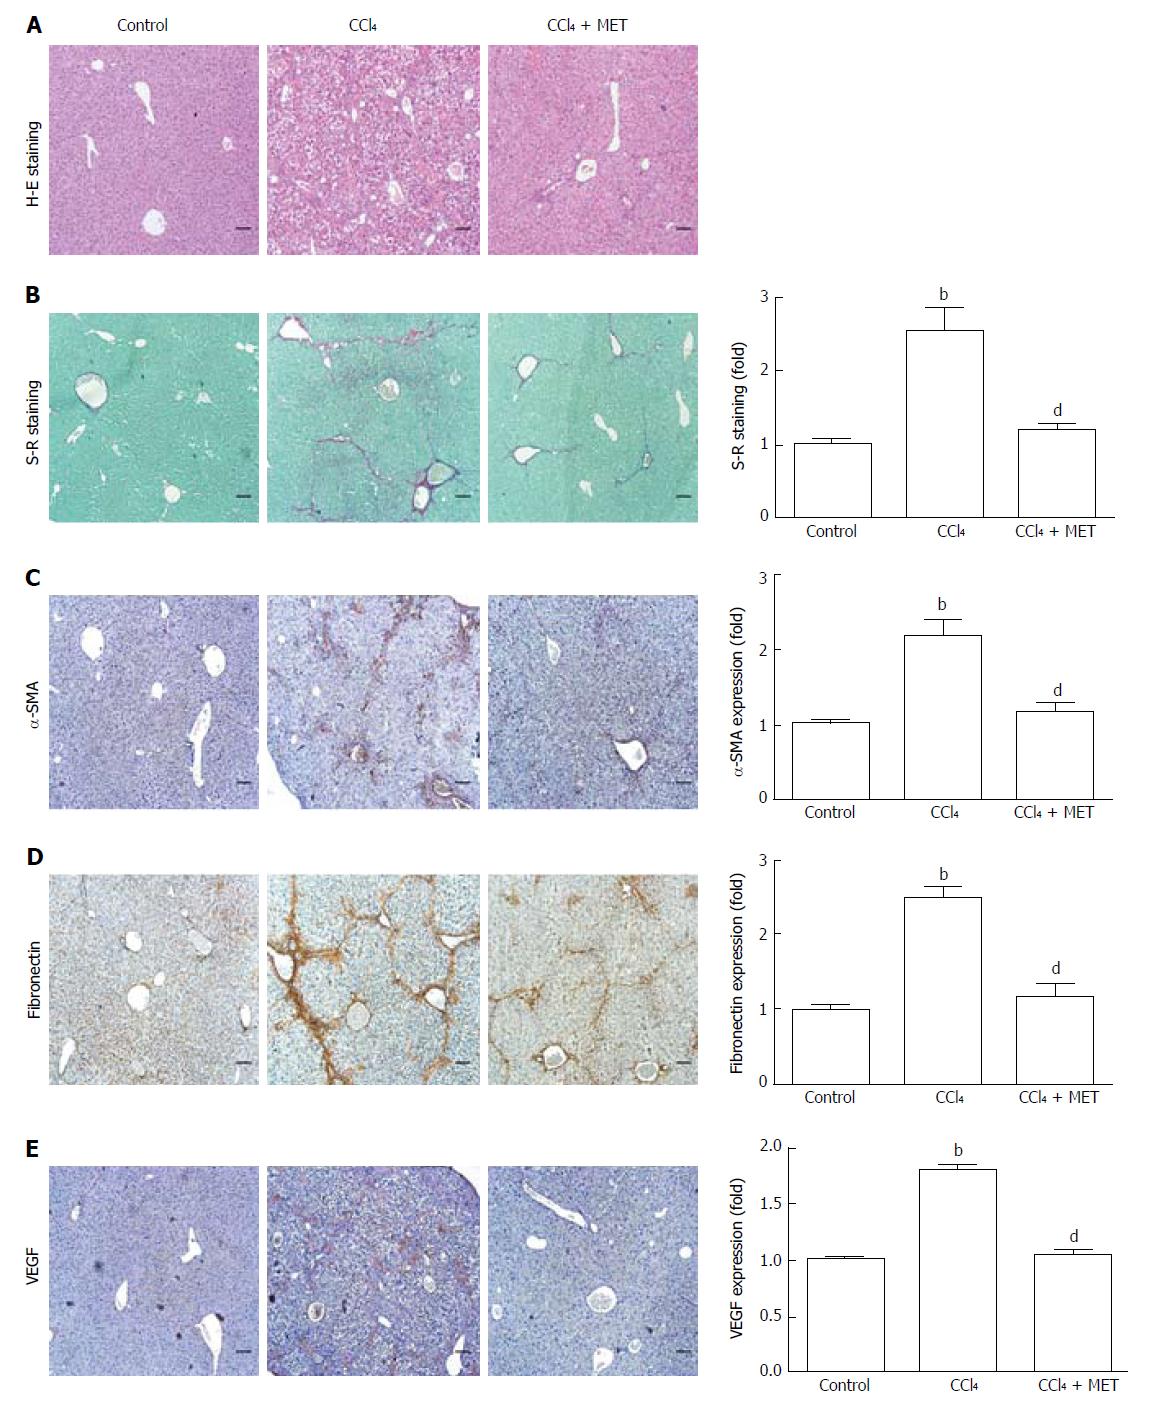
Figure 1 Effect of metformin in CCl4-induced fibrotic mice.
A fibrotic mouse model was induced by intraperitoneal injection of CCl4 (1 μL/g) dissolved in olive oil (CCl4:olive oil = 1:1, v/v) twice per week for 6 weeks. A and B: Histological changes were assessed by hematoxylin-eosin (H-E) staining and Sirius Red (S-R) staining (100 × magnification); C-E: Expression levels of α-SMA, fibronectin, and VEGF in the liver tissues were measured by immunohistochemistry (100 × magnification). Sirius Red staining was analyzed with ImageJ and immunohistochemical staining was analyzed with Image-Pro Plus 6.0. (Scale bar = 200 μm, n = 5, bP < 0.01 vs the control group, dP < 0.01 vs the CCl4 group).
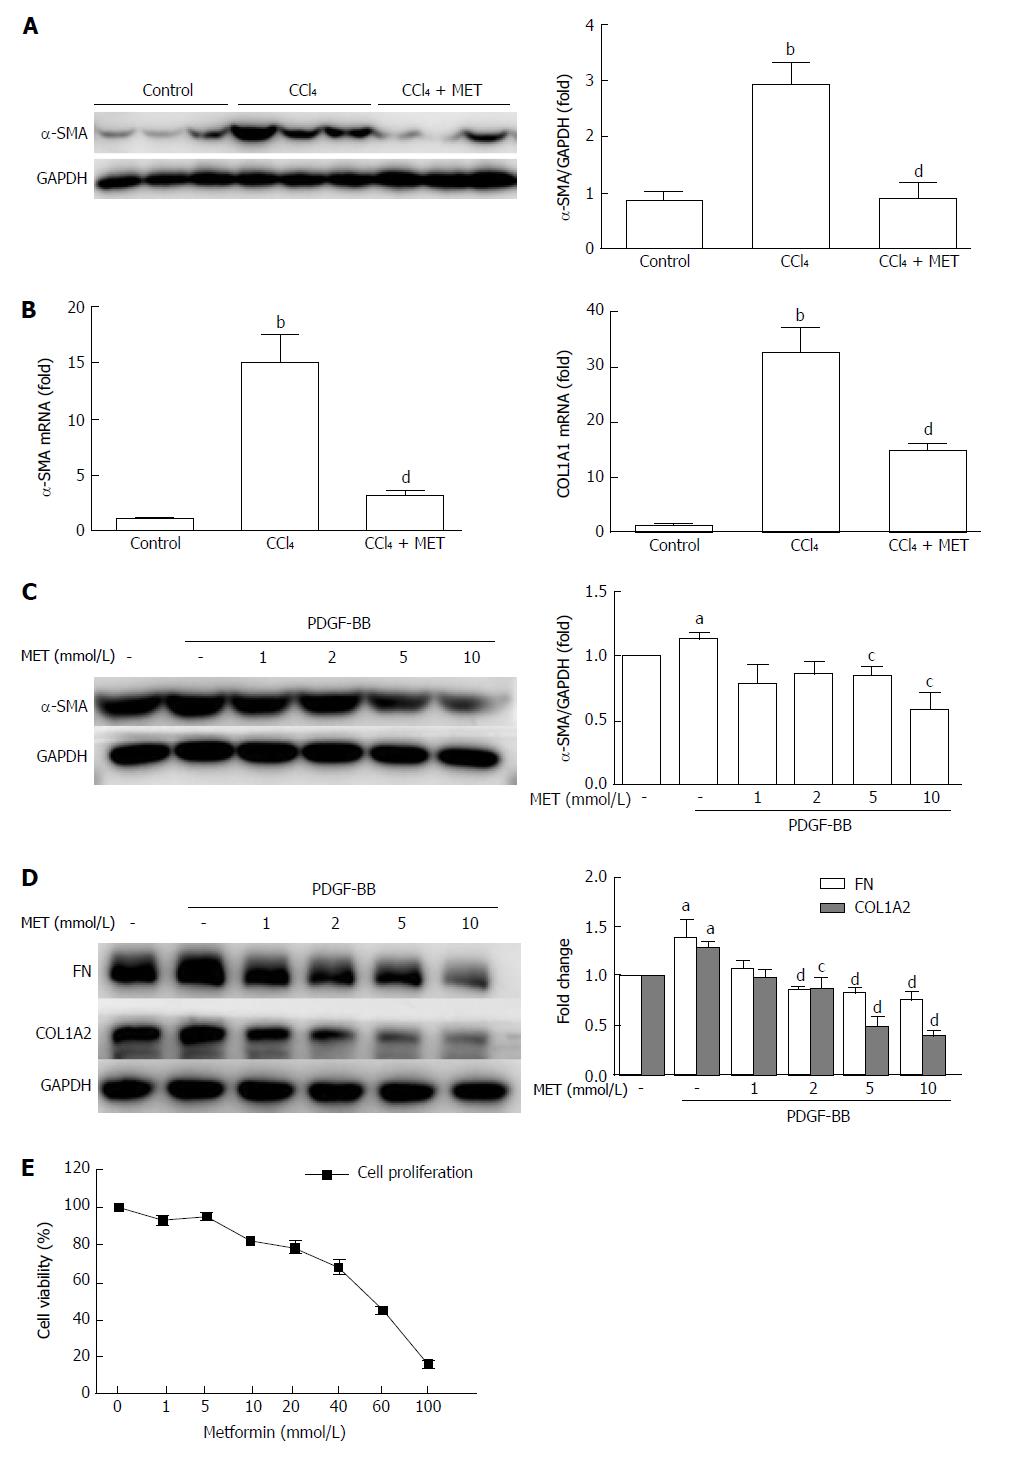
Figure 2 Effect of metformin on the activation, proliferation, and extracellular matrix secretion of hepatic stellate cells.
A: Measurement of α-SMA levels in murine liver tissues by Western blot; B: Measurement of hepatic α-SMA and collagen type I mRNA expression levels by quantitative real-time PCR (n = 5, bP < 0.01 vs the control group, dP < 0.01 vs the CCl4 group); C and D: HSCs were treated with or without 10 ng/mL PDGF-BB for 24 h, and the effect of metformin (1, 2, 5, and 10 mmol/L) on the expression levels of α-SMA, collagen type I, and fibronectin (FN) were measured by Western blot (aP < 0.05 vs the control group, cP < 0.05 and dP < 0.01 vs the PDGF-BB only group); E: HSCs were treated with a series of concentrations ranging from 1 mmol/L to 100 mmol/L of metformin for 24 h, and the proliferation was measured by CCK-8 assays. HSCs: Hepatic stellate cells.
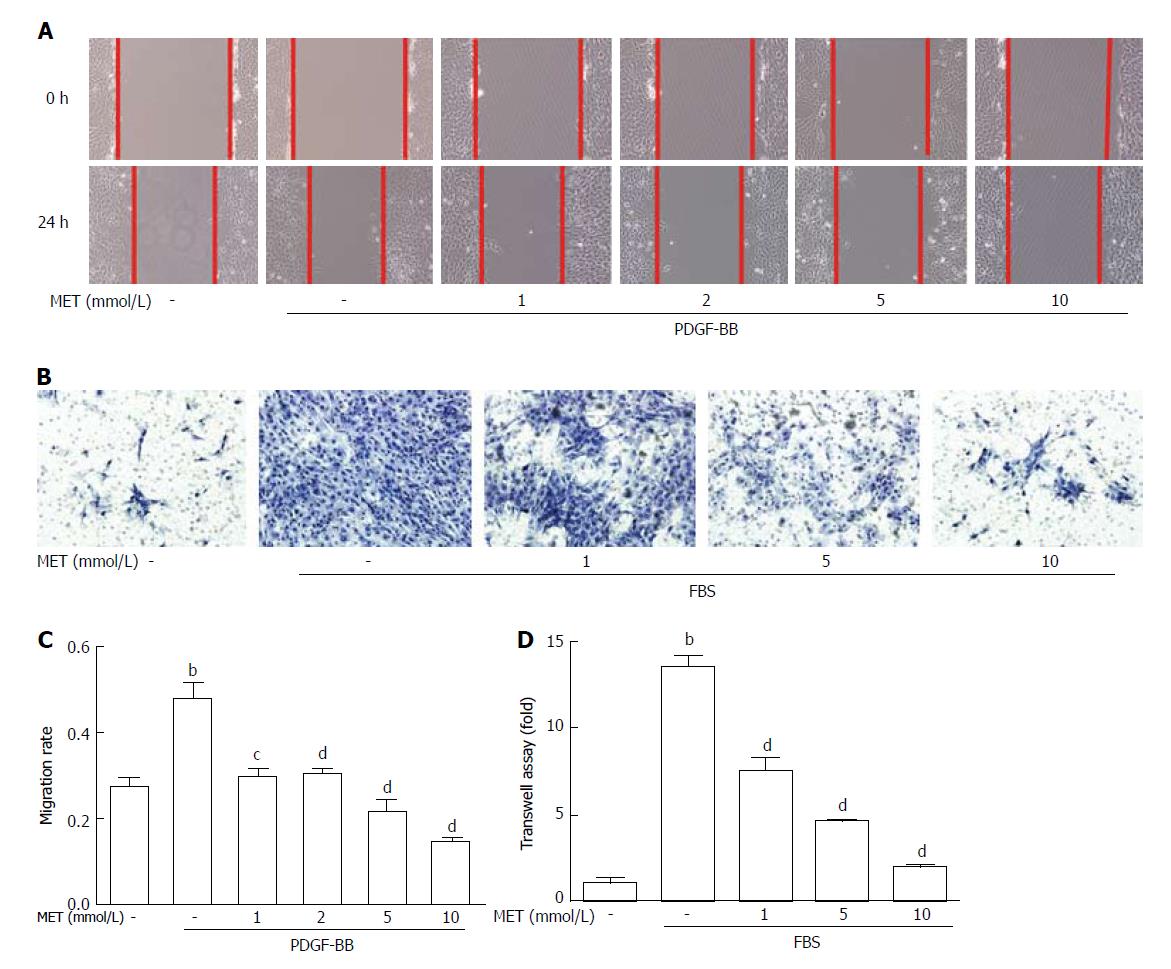
Figure 3 Effect of metformin on hepatic stellate cell migration and invasion.
Scratch tests were used to determine cell migration, and Transwell assays were used to evaluate cell invasion. A: HSCs were scraped and then incubated with or without PDGF-BB (10 ng/mL) and metformin (1, 2, 5, and 10 mmol/L). Images were acquired at 0 and 24 h (100 × magnification); B: HSCs were seeded in the upper chamber with a Matrigel membrane, and various concentrations of metformin (0, 1, 5, and 10 mmol/L) were added to the medium. The lower chambers were loaded with DMEM with or without 10% FBS. Cells that migrated through the membrane were fixed and stained with hematoxylin at 24 h; C: The migration ability was quantified by measuring the distance of the scratch edge; D: Cells that migrated through the membrane were counted and quantified. (bP < 0.01 vs the control group, cP < 0.05 and dP < 0.01 vs the PDGF-BB or FBS only groups). HSCs: Hepatic stellate cells.
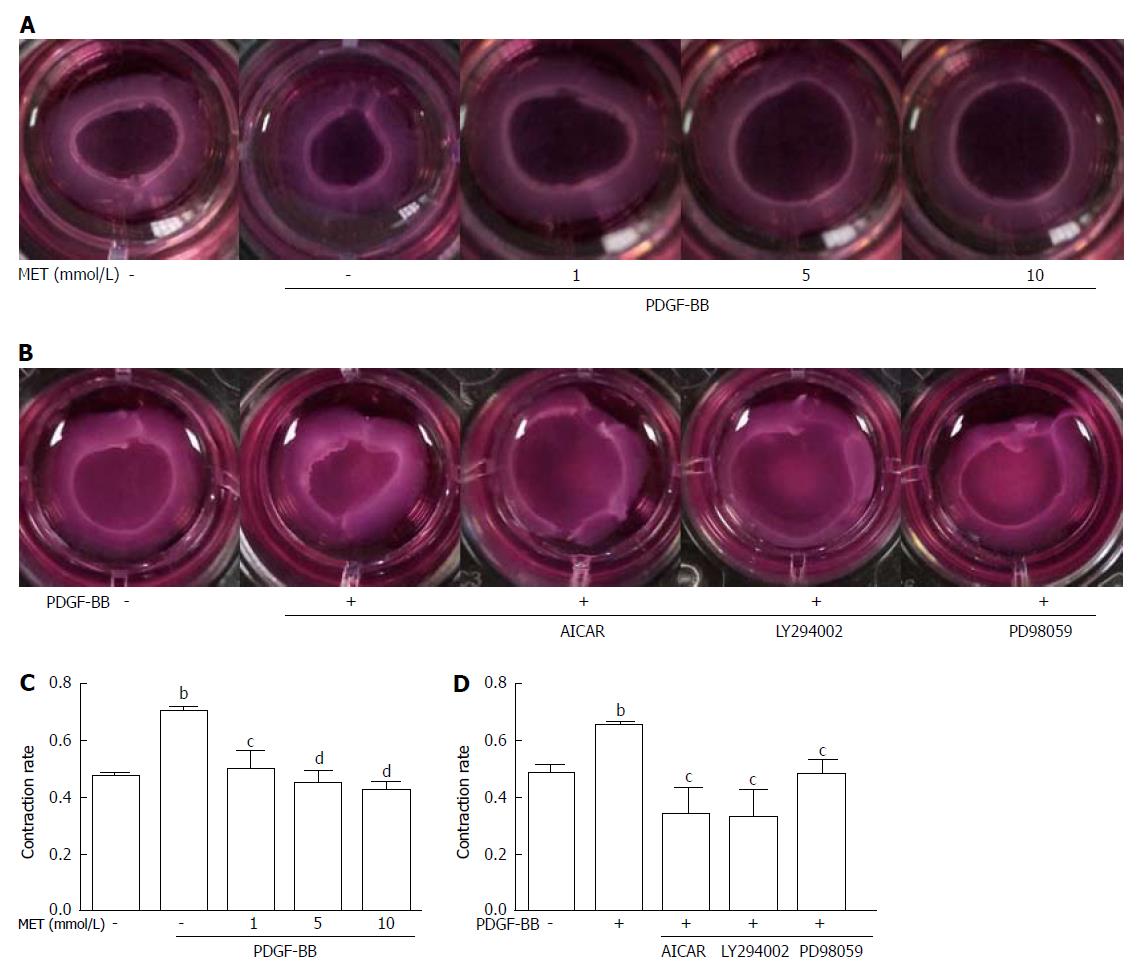
Figure 4 Effect of metformin on hepatic stellate cell contraction.
Collagen gels were prepared in 24-well plates. A: HSCs were seeded on the collagen gel with or without PDGF-BB (10 ng/mL) and metformin (1, 5, and 10 mmol/L); B: Metformin was changed to AICAR (500 μmol/L), LY294002 (20 μmol/L), and PD98059 (10 μmol/L); C and D: After incubation for 24 h, the areas of the collagen gel were measured for analysis. (bP < 0.01 vs the control group, cP < 0.05 and dP < 0.01 vs the PDGF-BB only group). HSCs: Hepatic stellate cells.
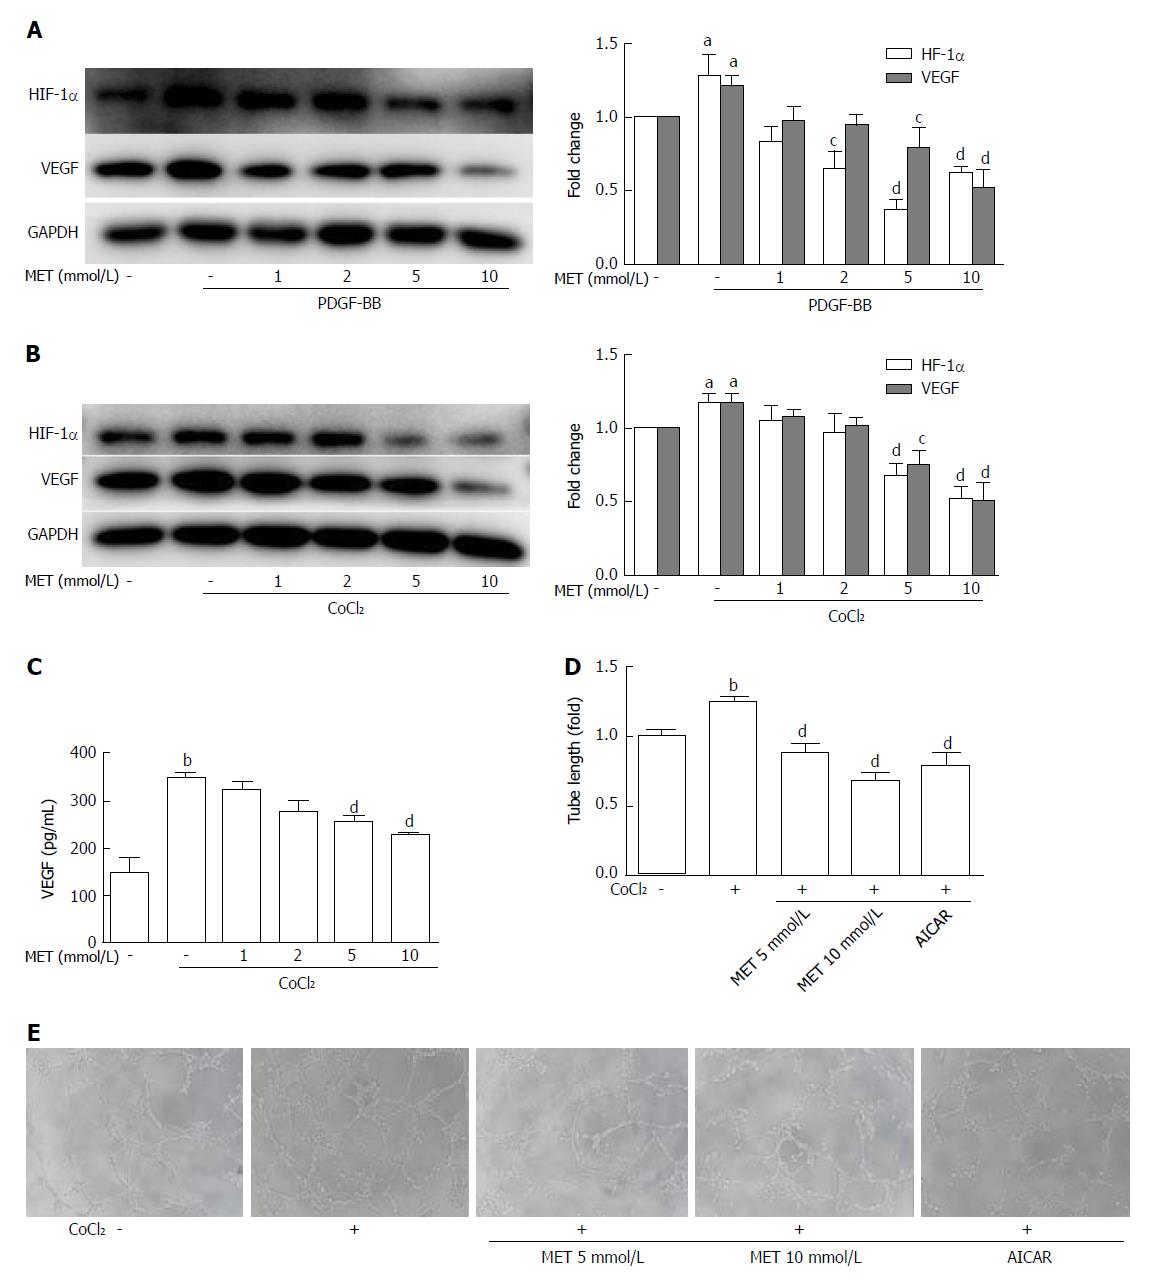
Figure 5 Effect of metformin on VEGF expression and secretion of hepatic stellate cells and angiogenesis in vitro.
A and B: HSCs were incubated with or without PDGF-BB (10 ng/mL) for 24 h or CoCl2 (150 μmol/L) for 12 h and metformin (1, 2, 5, and 10 mmol/L). The expression levels of HIF-1α and VEGF were measured by Western blot analysis, and the results were quantified; C: Cells were treated as in panel B, and the supernatant was collected. The protein level of VEGF was measured by ELISA assay; D and E: HSCs were pretreated with metformin (5 and 10 mmol/L) or AICAR (500 μmol/L) for 2 h, and then incubated with or without CoCl2 (150 μmol/L) for 12 h. The supernatant was collected and diluted 4:1 (v/v) in DMEM with 10% FBS to form conditioned medium. HUVECs were harvested and suspended in the conditioned medium, and then seeded on Matrigel. Images were acquired at 8 h (100 × magnification), and tube lengths were calculated with ImageJ and quantified. aP < 0.05 and bP < 0.01 vs the control group, cP < 0.05 and dP < 0.01 vs the PDGF-BB or CoCl2 only groups. HSCs: Hepatic stellate cells.
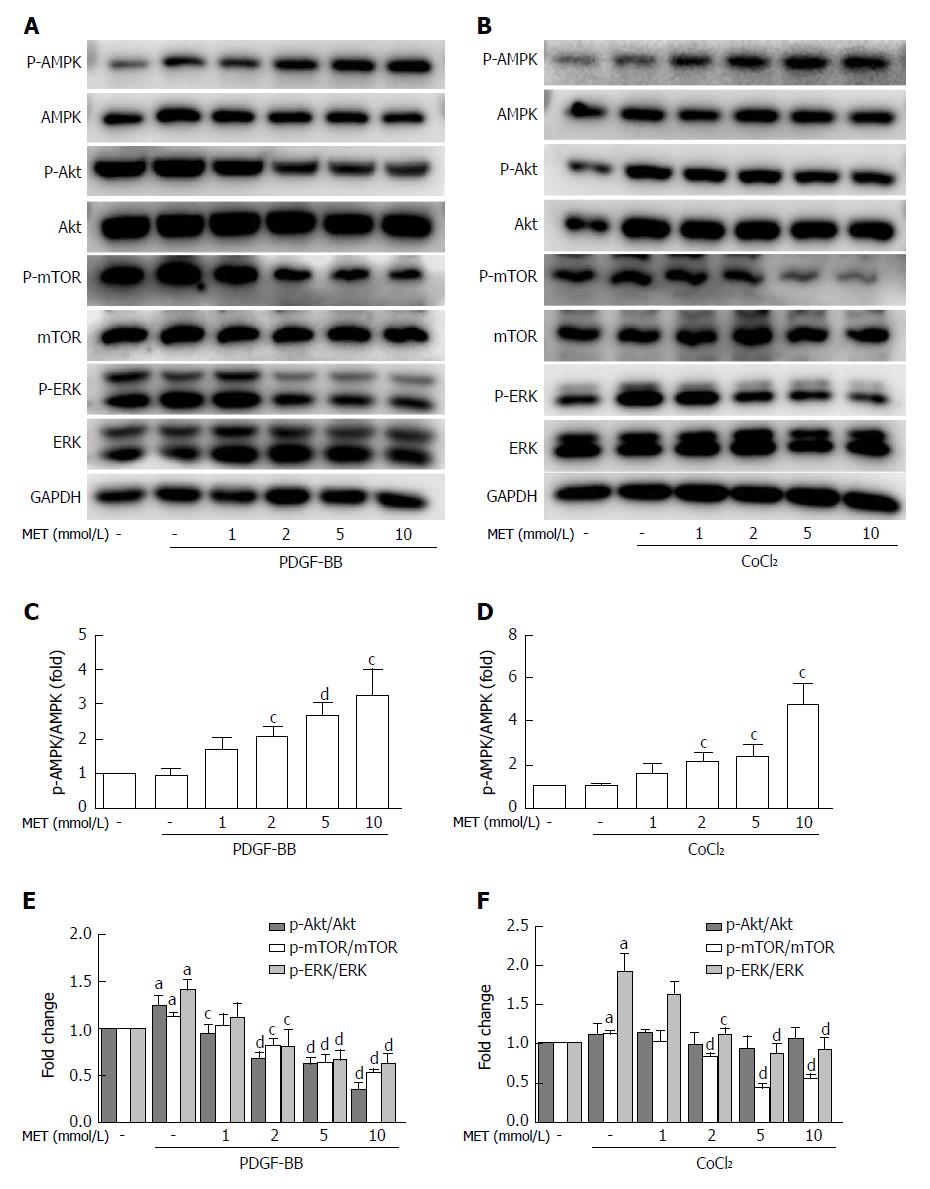
Figure 6 Effect of metformin on AMPK, Akt/mTOR, and ERK signaling in hepatic stellate cells.
A and B: HSCs were pretreated with metformin (1, 2, 5 and 10 mmol/L) for 2 h and then incubated with PDGF-BB (10 ng/mL) for 24 h or CoCl2 (150 μmol/L) for 12 h. AMPK, Akt/mTOR, and ERK signaling pathways were assessed by Western blot analysis; C and D: The results were quantified. aP < 0.05 vs the control group, cP < 0.05 and dP < 0.01 vs the PDGF-BB or CoCl2 only groups. HSCs: Hepatic stellate cells.
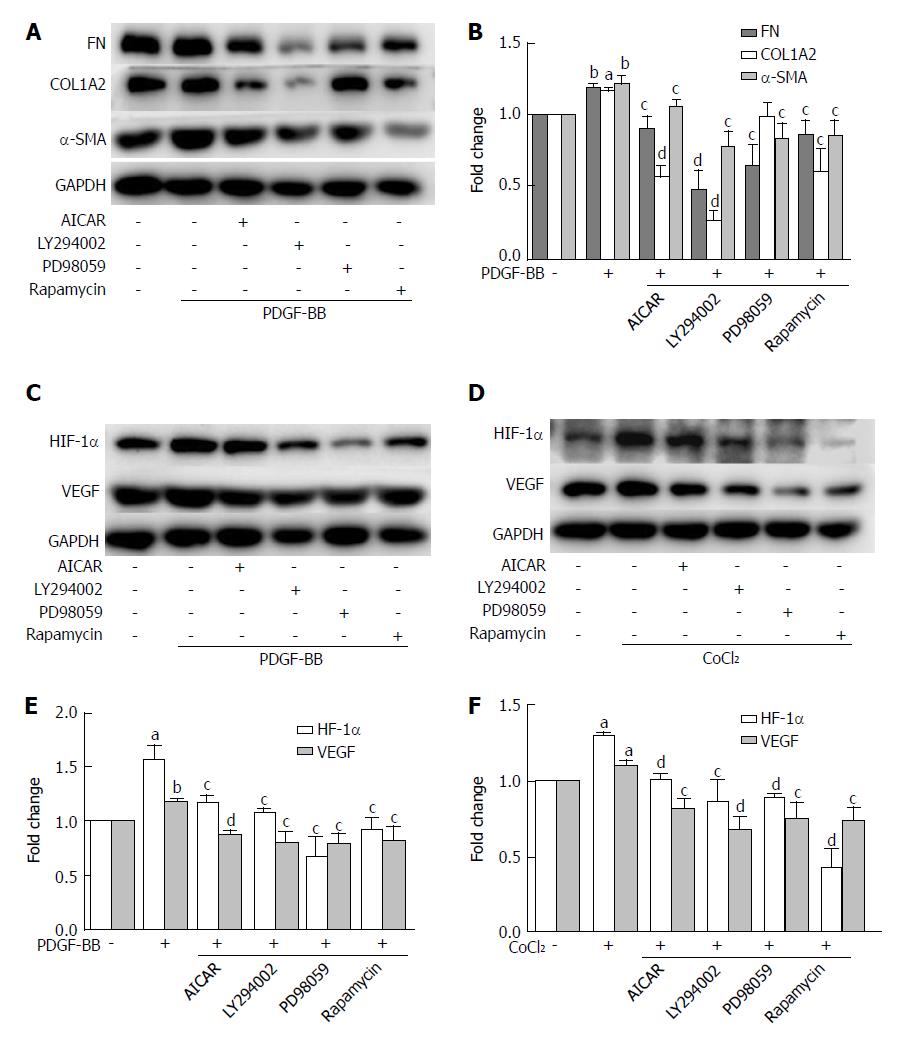
Figure 7 The inhibitory effects of metformin on activated hepatic stellate cells were associated with activation of AMPK and subsequent down-regulation of the Akt/mTOR and ERK signaling pathways.
A and B: HSCs were pretreated with AICAR (500 μmol/L), LY294002 (20 μmol/L), PD98059 (10 μmol/L), or rapamycin (100 nmol/L) for 2 h and then incubated with PDGF-BB (10 ng/mL) for 24 h. Expression levels of fibronectin (FN), collagen type I (COL1A2), and α-SMA were measured by Western blot analysis and the results were quantified; C and D: HSCs were pretreated with AICAR (500 μmol/L), LY294002 (20 μmol/L), PD98059 (10 μmol/L), or rapamycin (100 nmol/L) for 2 h and then incubated with or without CoCl2 (150 μmol/L) for 12 h. Expression levels of HIF-1α and VEGF were measured by Western blot analysis; E and F: The results were quantified. (aP < 0.05 and bP < 0.01 vs the control group, cP < 0.05 and dP < 0.01 vs the PDGF-BB or CoCl2 only groups). HSCs: Hepatic stellate cells.
- Citation: Li Z, Ding Q, Ling LP, Wu Y, Meng DX, Li X, Zhang CQ. Metformin attenuates motility, contraction, and fibrogenic response of hepatic stellate cells in vivo and in vitro by activating AMP-activated protein kinase. World J Gastroenterol 2018; 24(7): 819-832
- URL: https://www.wjgnet.com/1007-9327/full/v24/i7/819.htm
- DOI: https://dx.doi.org/10.3748/wjg.v24.i7.819


