Copyright
©The Author(s) 2018.
World J Gastroenterol. Feb 14, 2018; 24(6): 737-743
Published online Feb 14, 2018. doi: 10.3748/wjg.v24.i6.737
Published online Feb 14, 2018. doi: 10.3748/wjg.v24.i6.737
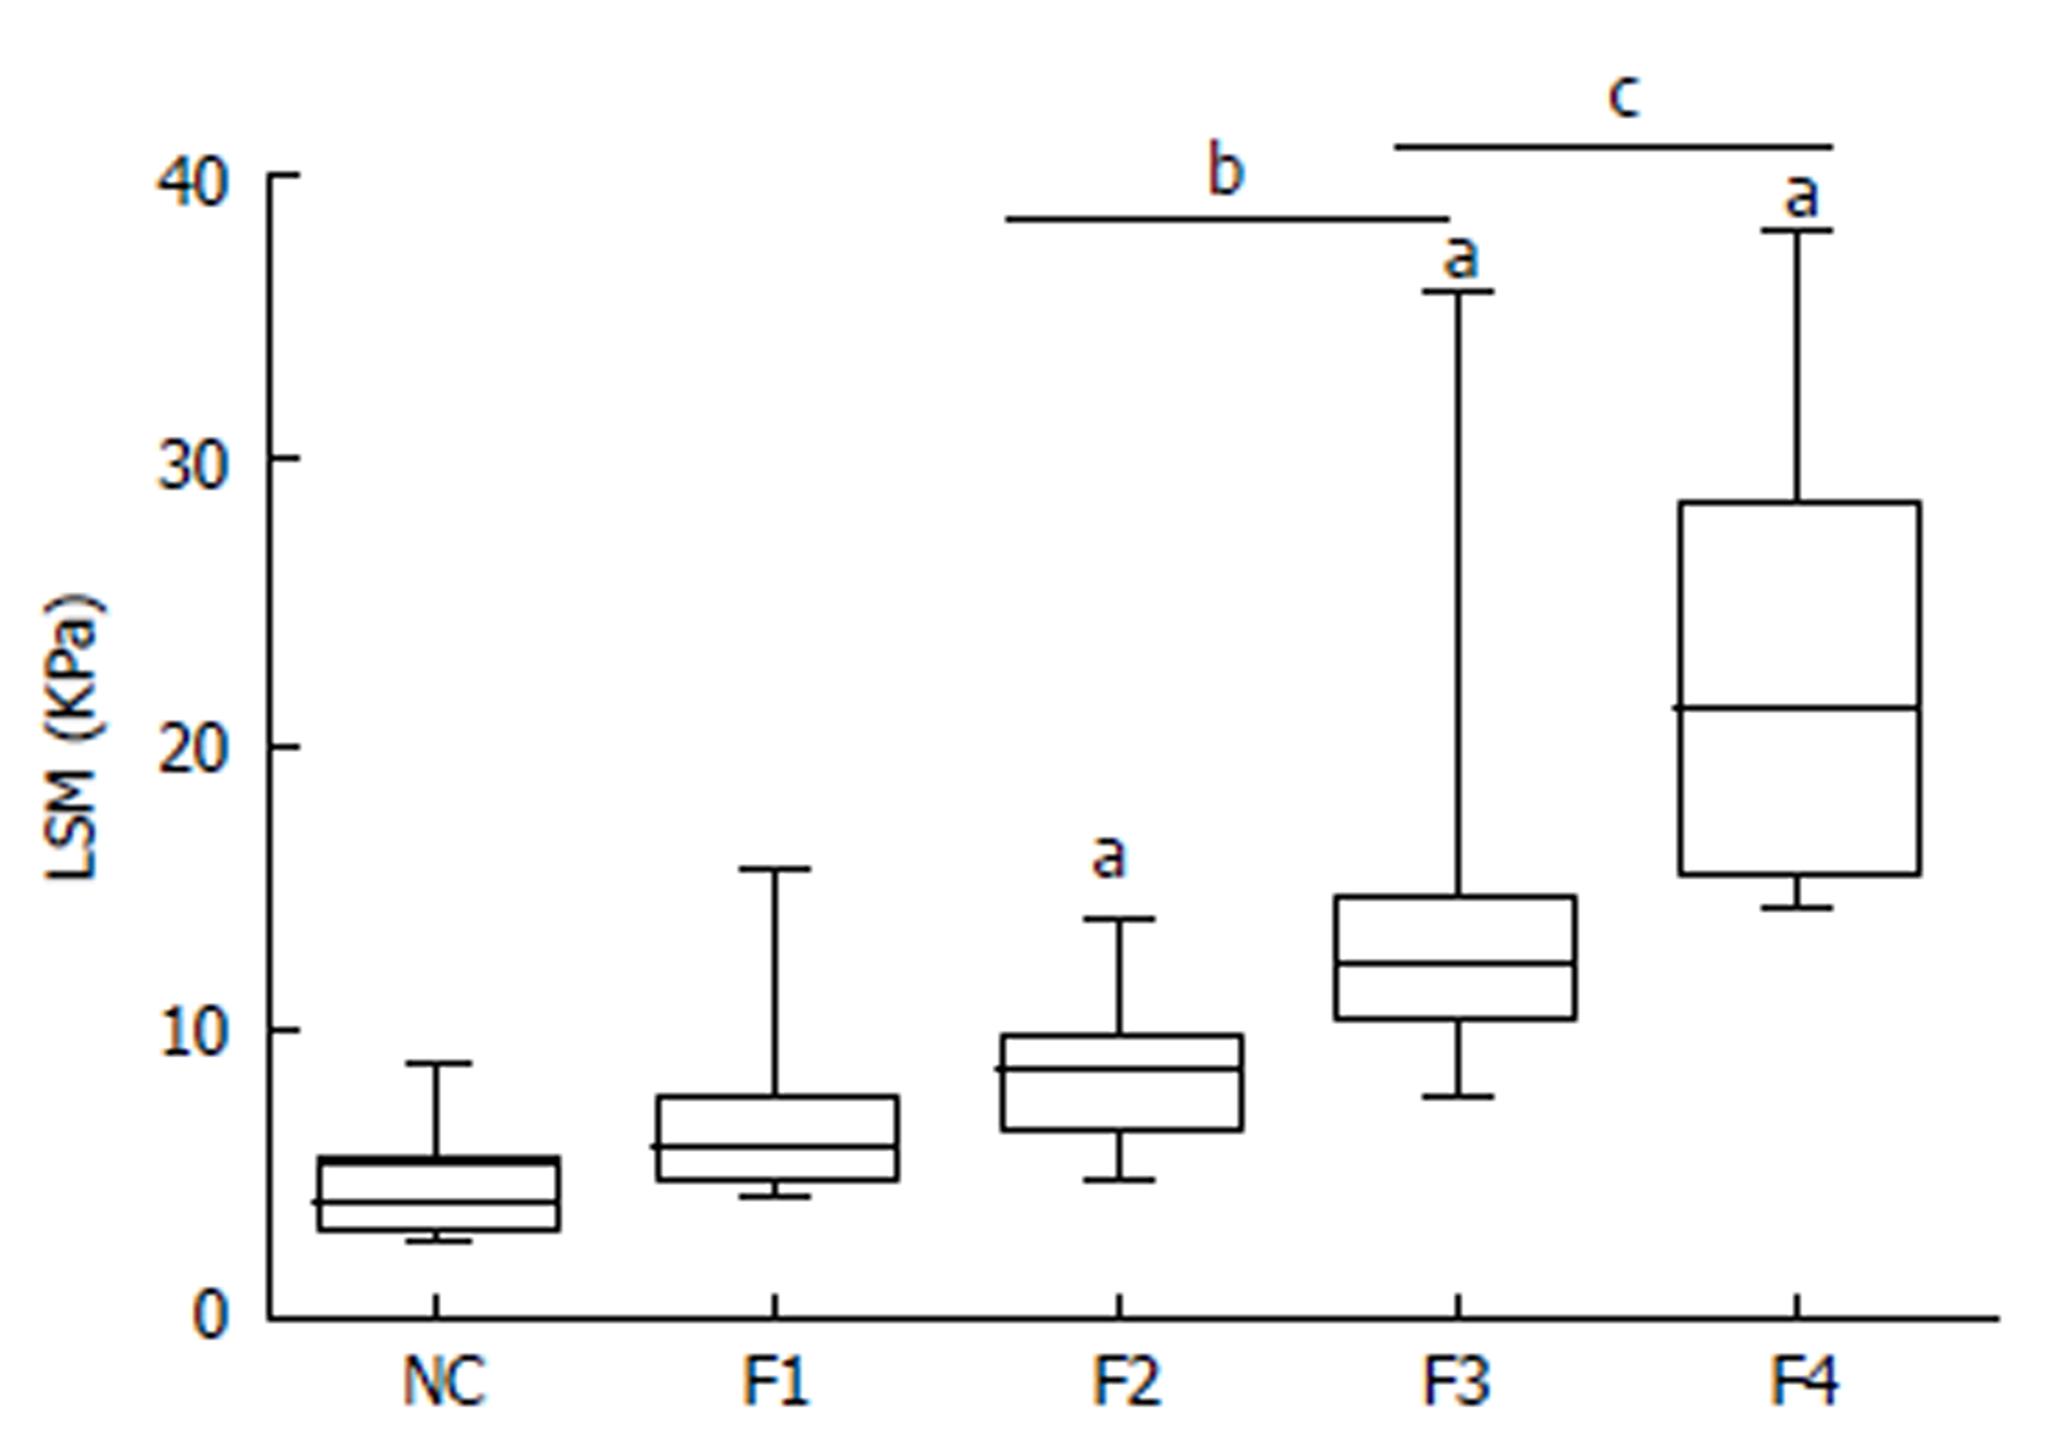
Figure 1 Correlation between liver stiffness measurement and histological fibrosis stage.
LSM values were assessed by TE in healthy normal controls and AIH-PBC overlap syndrome patients with different liver fibrosis stages based on the results of liver biopsy (F0-4). aP < 0.01, F2, 3, and 4 vs NC; bP < 0.01, F3 vs F2; cP < 0.01, F4 vs F3. LSM: Liver stiffness measurement; NC: Normal controls; AIH-PBC: Autoimmune hepatitis-primary biliary cholangitis; TE: Transient elastography.
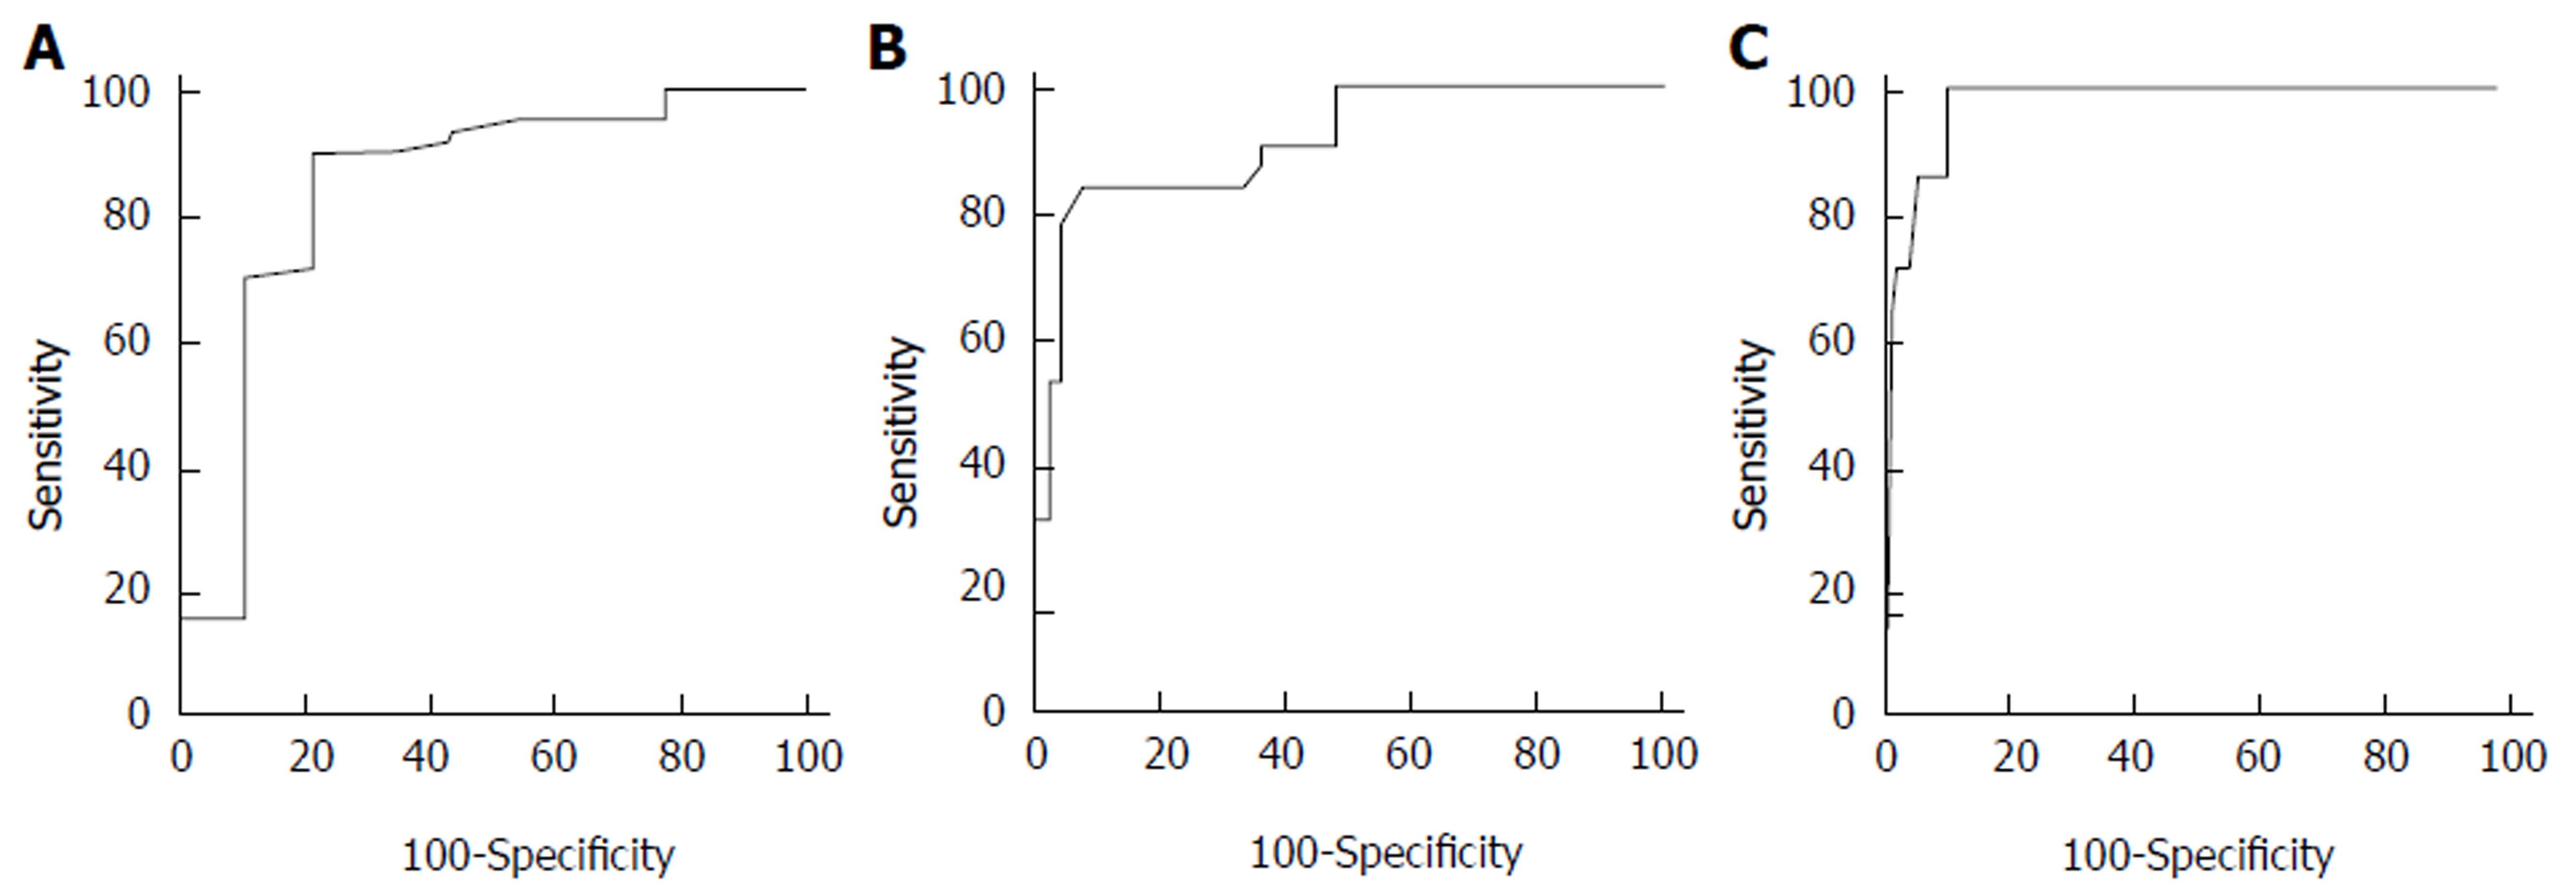
Figure 2 The receiver operator characteristic curve of liver stiffness measurement for the diagnosis of liver fibrosis stage.
A: Significant fibrosis (F ≥ 2); B: Severe fibrosis (F ≥ 3); C: Cirrhosis (F4).
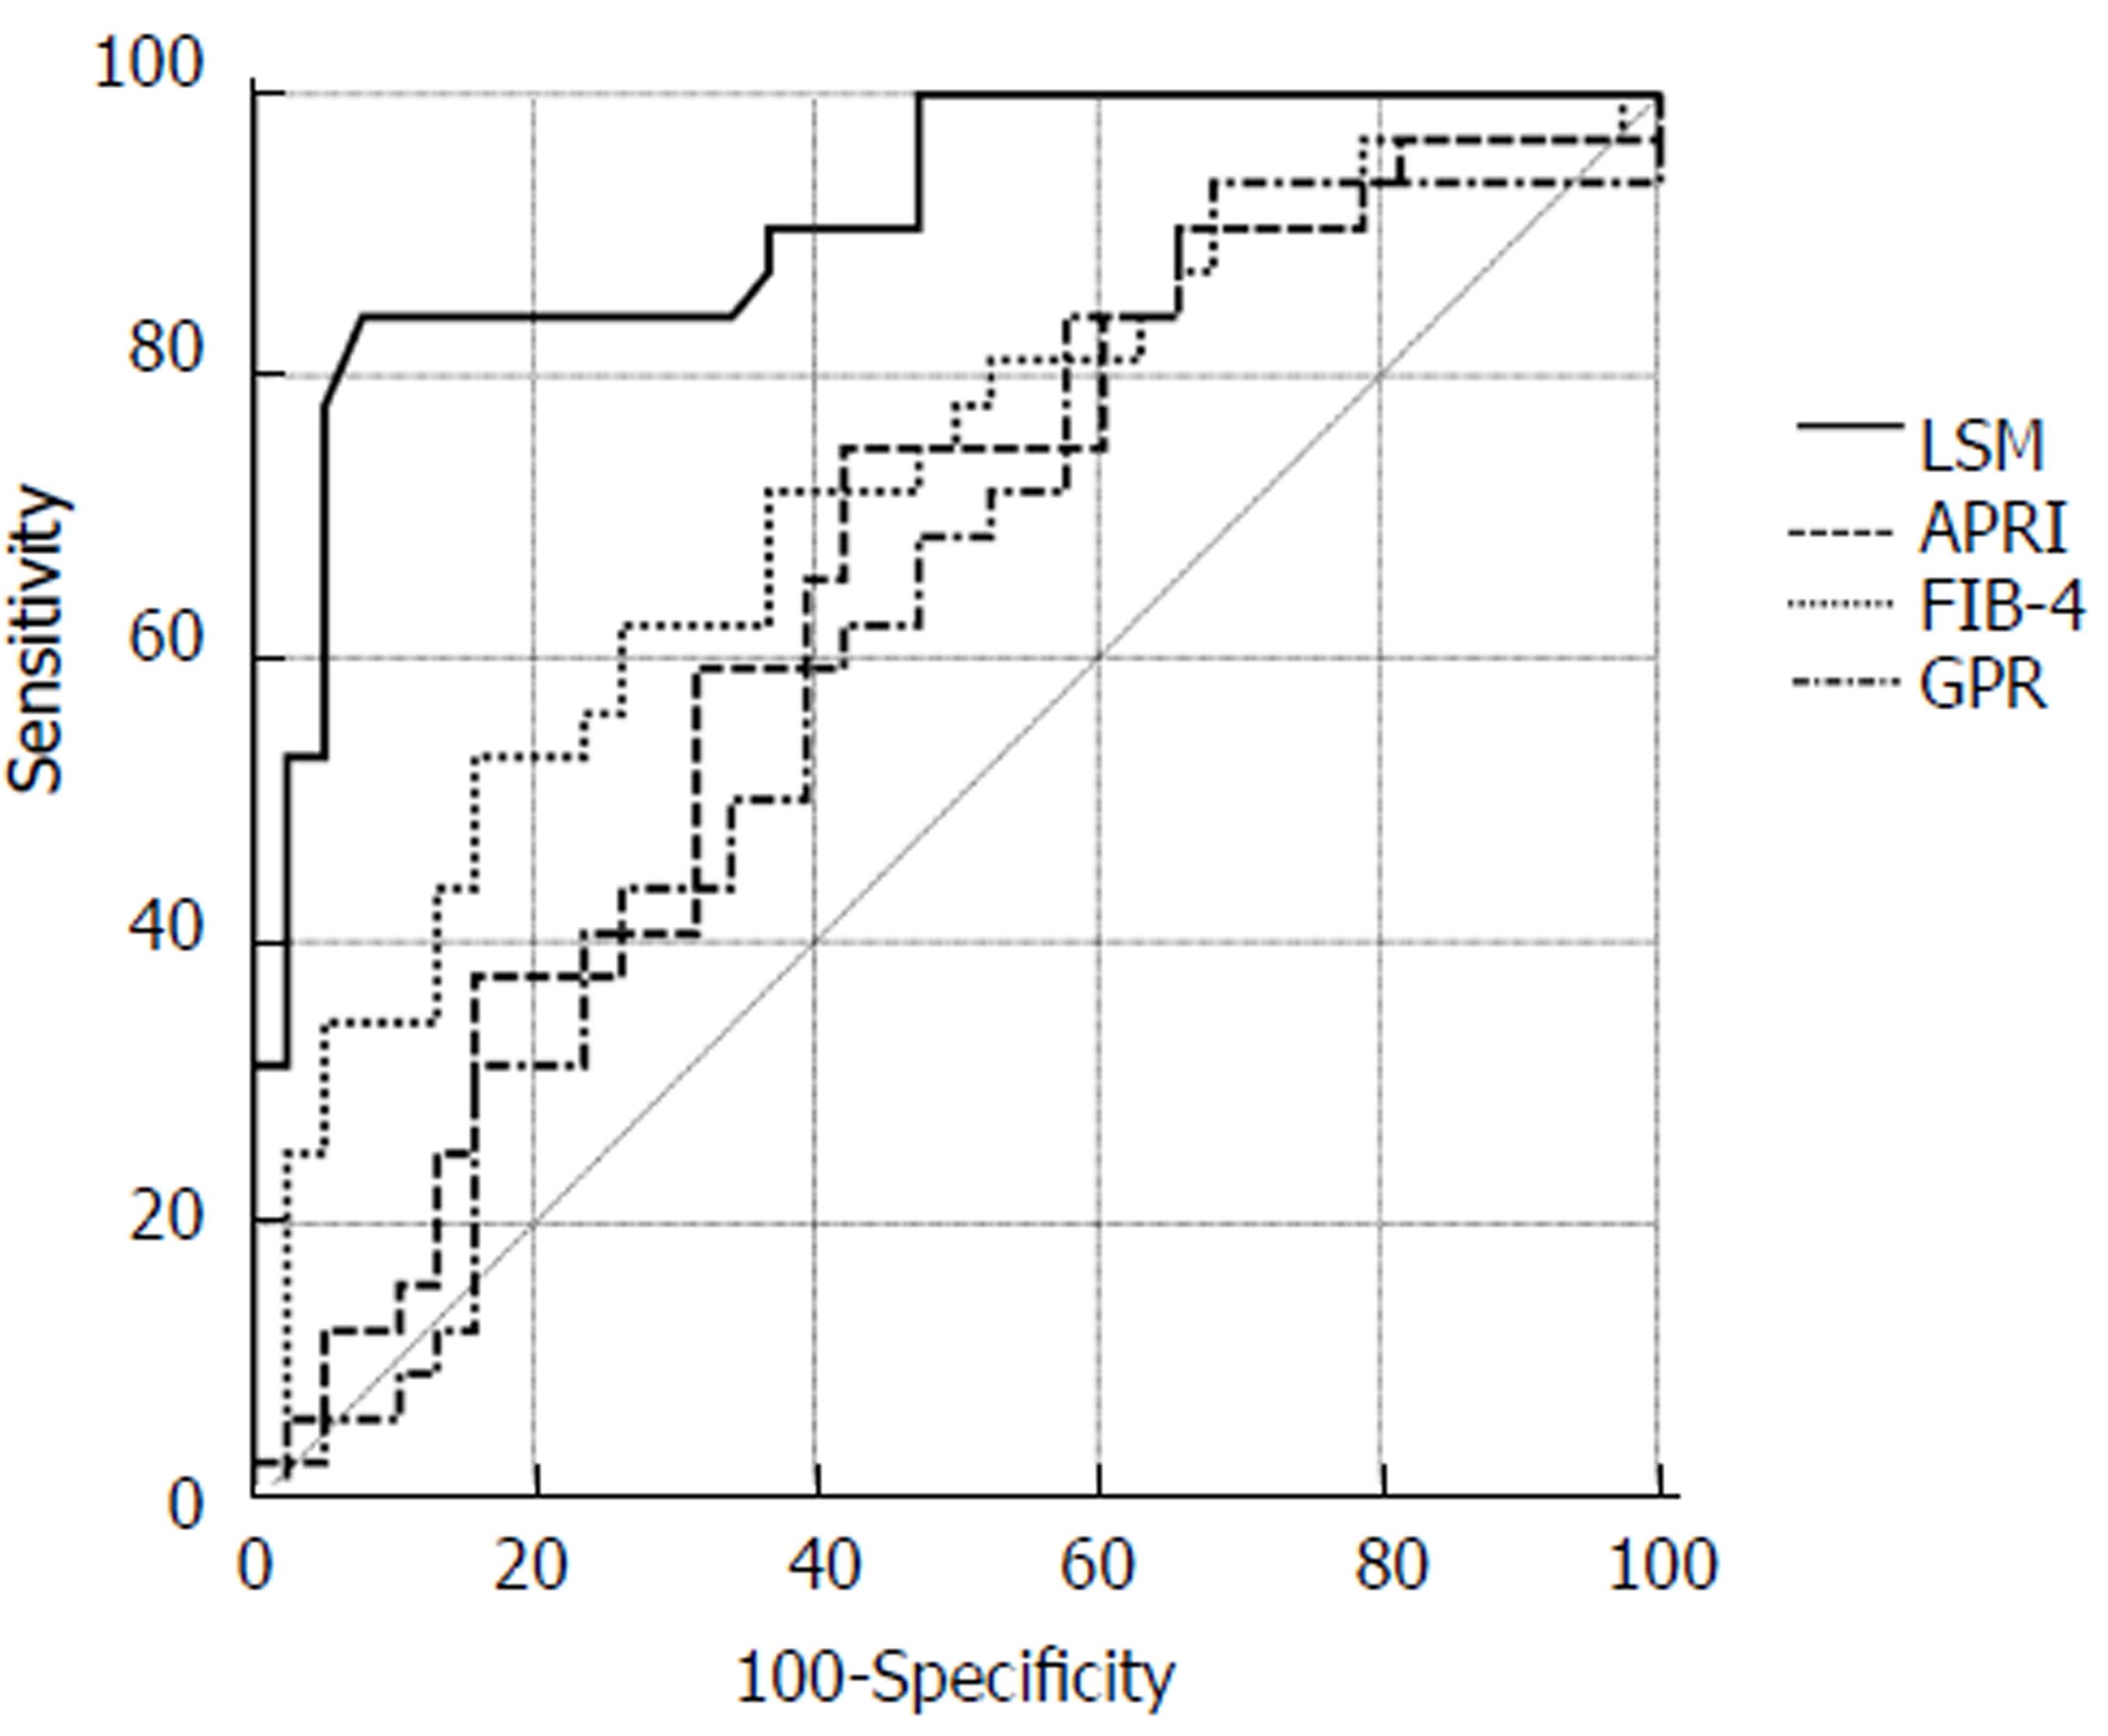
Figure 3 The receiver operator characteristic curves of liver stiffness measurement, fibrosis-4, aspartate aminotransferase-to-platelet ratio index, and GRP for the detection of severe fibrosis (F ≥ 3).
LSM: liver stiffness measurement; GPR: GGT/platelet ratio; FIB-4: Fibrosis-4; APRI: Aminotransferase -to-platelet ratio index.
- Citation: Wu HM, Sheng L, Wang Q, Bao H, Miao Q, Xiao X, Guo CJ, Li H, Ma X, Qiu DK, Hua J. Performance of transient elastography in assessing liver fibrosis in patients with autoimmune hepatitis-primary biliary cholangitis overlap syndrome. World J Gastroenterol 2018; 24(6): 737-743
- URL: https://www.wjgnet.com/1007-9327/full/v24/i6/737.htm
- DOI: https://dx.doi.org/10.3748/wjg.v24.i6.737


