Copyright
©The Author(s) 2018.
World J Gastroenterol. Feb 7, 2018; 24(5): 583-592
Published online Feb 7, 2018. doi: 10.3748/wjg.v24.i5.583
Published online Feb 7, 2018. doi: 10.3748/wjg.v24.i5.583
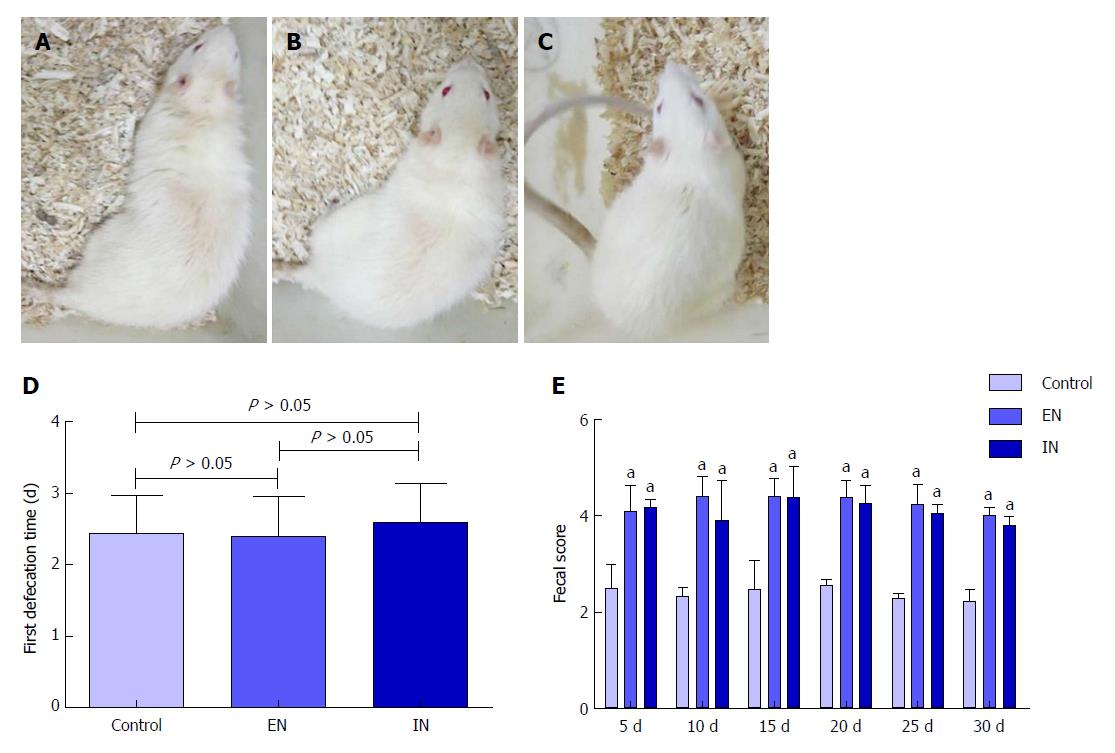
Figure 1 General condition of rats.
Mental states of rats in the (A) Control, (B) EN, and (C) IN groups are shown, and they reacted sensitively, with no signs of burnout, laziness, or irritability; D: There was no significant difference in the time to first defecation among the three groups (F = 0.32, P = 0.73); E: The fecal scores were significantly higher in the EN and IN groups compared with the control group at 5, 10, 15, 20, 25, and 30 d postoperatively (P < 0.05 for all), but there were no significant differences between the EN and IN groups (P > 0.05 for all). Bars represent mean ± SD, n = 8. aP < 0.05 vs Control. EN: Enteral nutrition; IN: Immune nutrition.
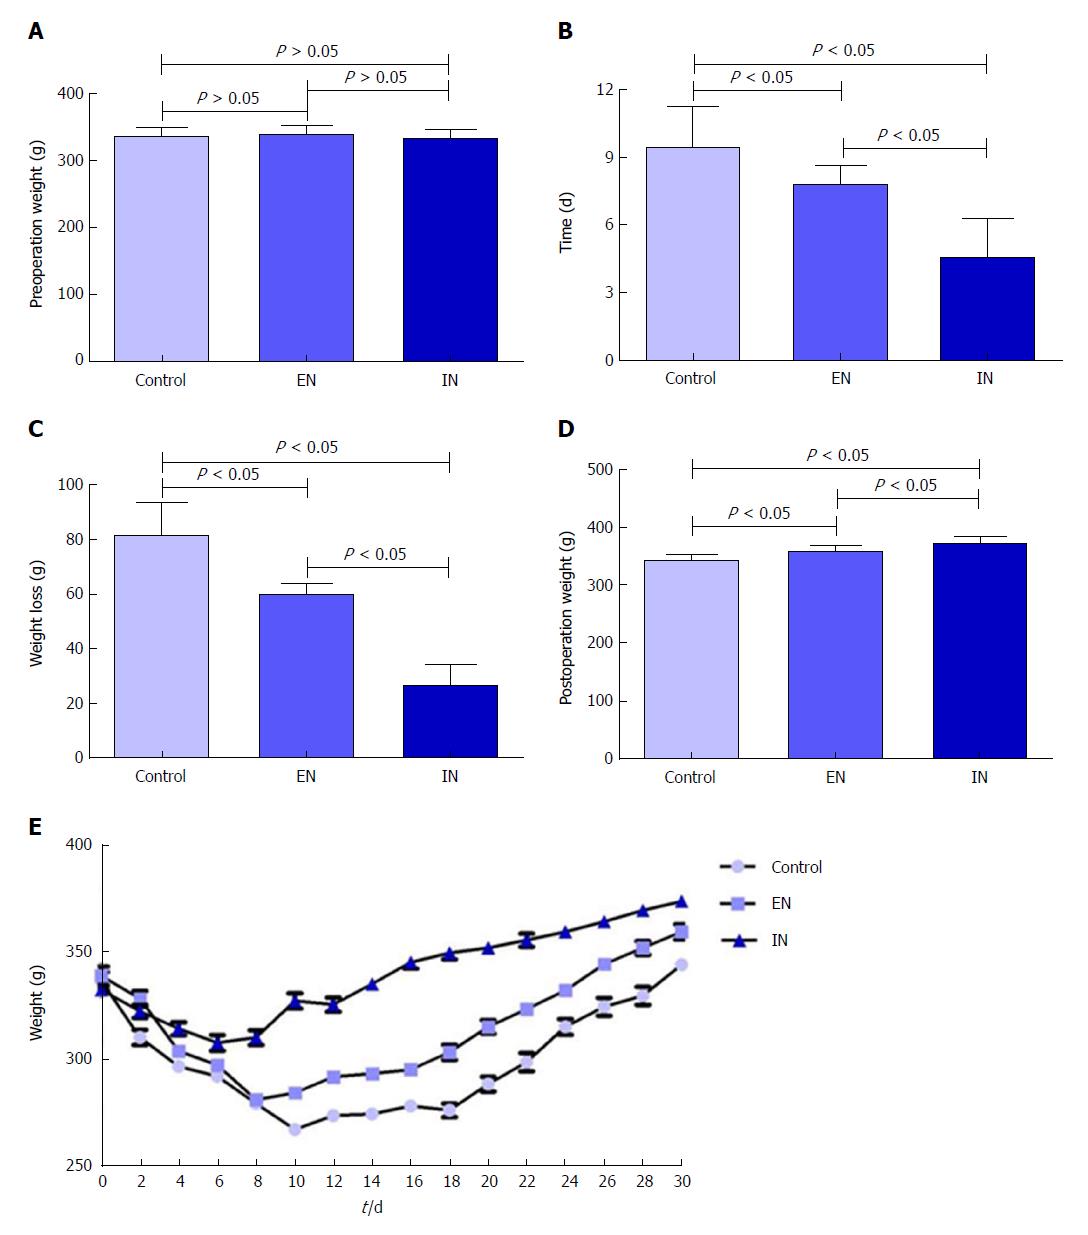
Figure 2 Body weight changes in rats during the study period.
A: Body weights were similar in all three groups pre-operatively (F = 0.57, P = 0.57); B Time to minimum weight was significantly longer in the control group compared with the EN (P < 0.05) and IN (P < 0.05) groups, and longer in the EN group compared with the IN group (P < 0.05); C: The weight decline was greater in the control group compared with the EN (P < 0.05) and IN (P < 0.05) groups, and greater in the EN compared with the IN group (P < 0.05); D: Body weight at 30 d postoperatively was significantly higher in the EN group compared with the control group (P < 0.05) and significantly lower compared with the IN group (P < 0.05); E: Weight-change curve for rats over 30 d postoperatively. Bars represent mean ± SD, n = 8. EN: Enteral nutrition; IN: Immune nutrition.
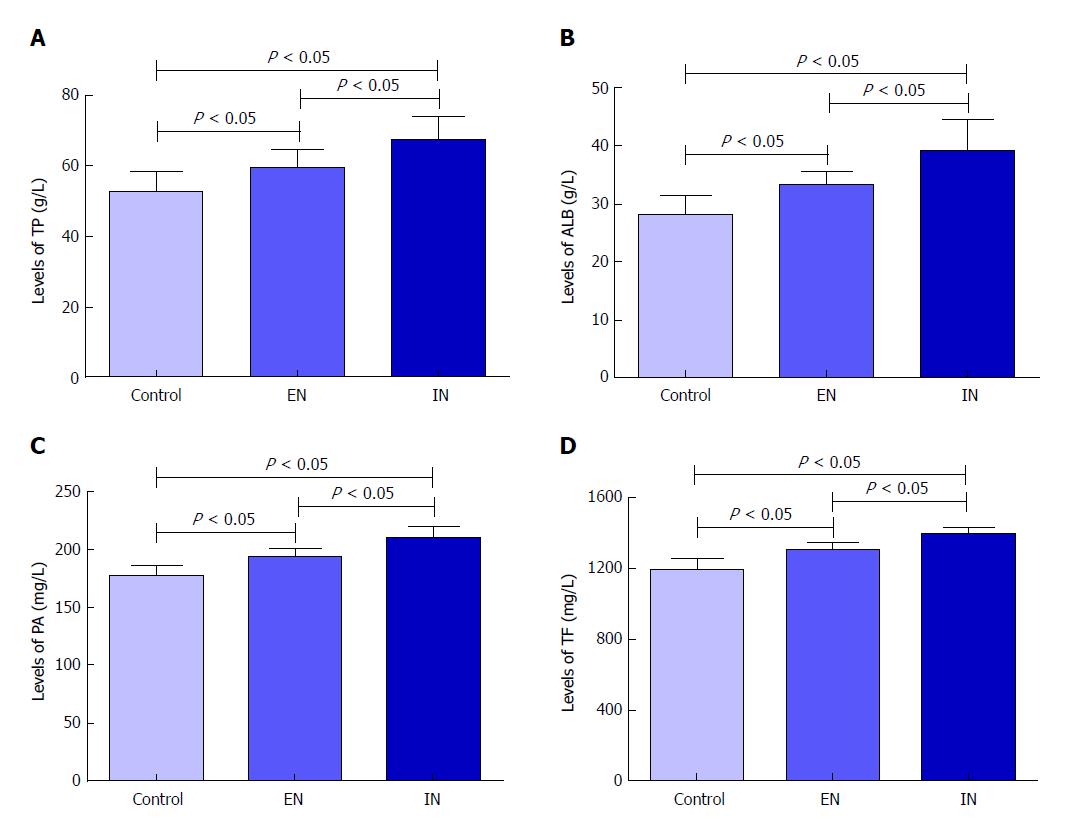
Figure 3 Changes in serum protein levels.
A: Serum TP level was significantly higher in the EN group compared with the control group (P < 0.05) and significantly lower compared with the IN group (P < 0.05); B: Serum ALB level was significantly higher in the EN group compared with the control group (P < 0.05) and significantly lower compared with the IN group (P < 0.05); C: Serum PA level was significantly higher in the EN group compared with the control group (P < 0.05) and significantly lower compared with the IN group (P < 0.05); D: Serum TF level was significantly higher in the EN group compared with the control group (P < 0.05) and significantly lower compared with the IN group (P < 0.05). Bars represent mean ± SD, n = 8. EN: Enteral nutrition; IN: Immune nutrition; TP: Total protein; ALB: Albumin; PA: Prealbumin; TF: Transferrin.
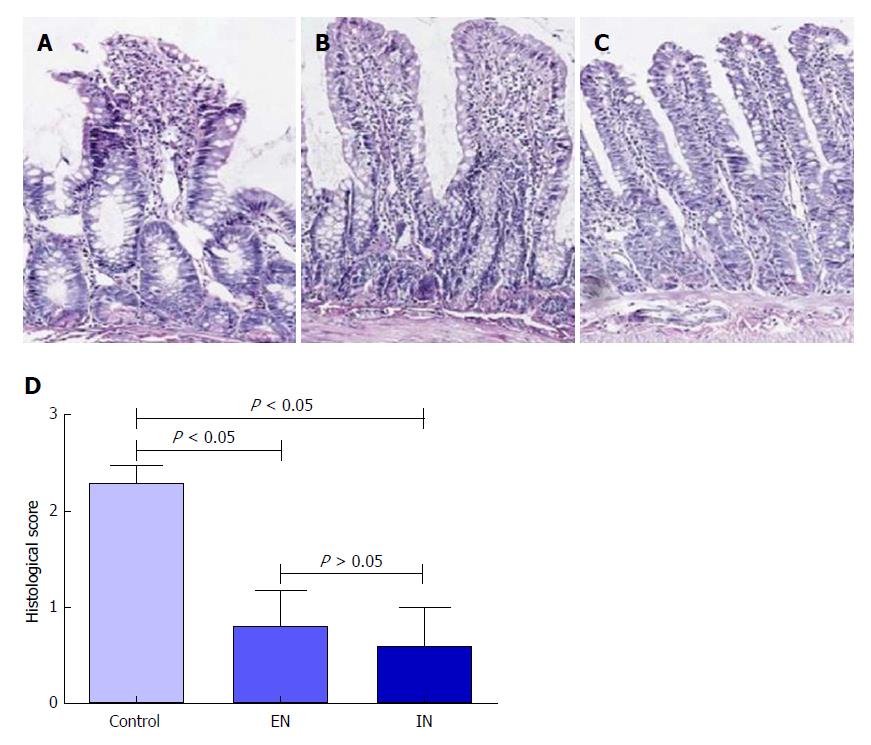
Figure 4 Hematoxylin and eosin staining of the ileal pouch mucosa.
A: The integrity of the pouch’s mucosal villi was disrupted in the control group. The villus stroma was loose and irregular, and the villus epithelium showed necrosis, shedding, and atrophy, as well as edema in the lamina propria. The morphology of the pouch mucosa in the (B) EN and (C) IN groups was largely normal; the villus structure was intact and its arrangement was neat, the epithelial cells were arranged regularly, and there was occasional interstitial edema; D: Pathological scores were higher in the EN and IN groups compared with the control group (P < 0.05 for both). However, there was no significant difference between the EN and IN groups (P > 0.05 for both). Bars represent mean ± SD, n = 8. EN: Enteral nutrition; IN: Immune nutrition.
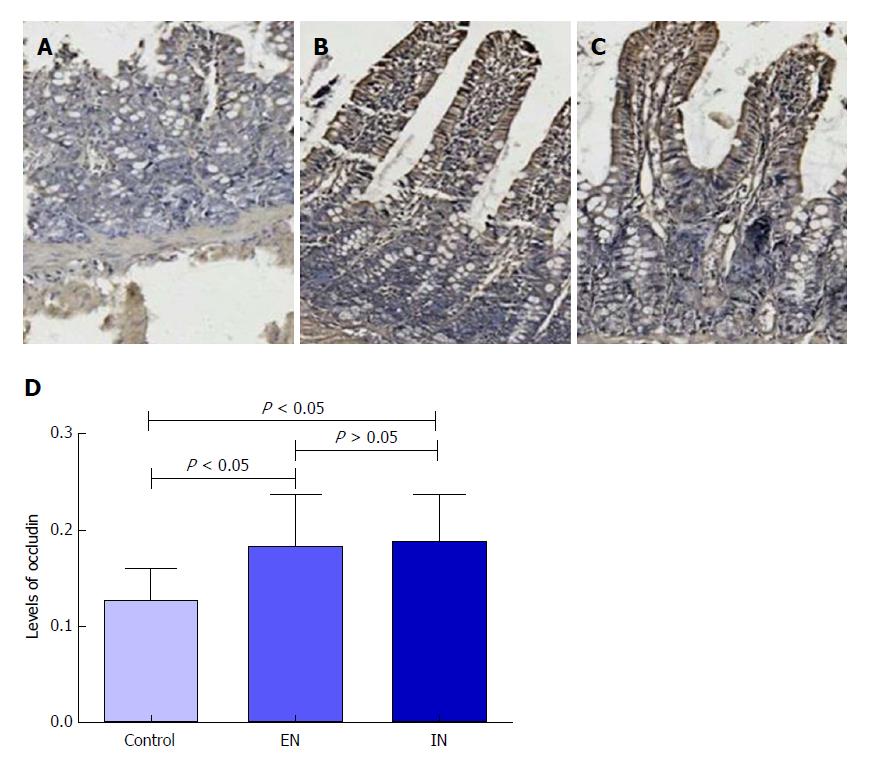
Figure 5 Immunohistochemical staining of the ileal pouch mucosa.
Immunohistochemical staining in the (A) control, (B) EN, and (C) IN groups are shown. D: Expression levels of occludin protein in the EN and IN groups were significantly higher compared with the control group (P < 0.05 for both), but there was no significant difference between the EN and IN groups (P > 0.05 for both). Bars represent mean ± SD, n = 8. EN: Enteral nutrition; IN: Immune nutrition.
- Citation: Xu YY, He AQ, Liu G, Li KY, Liu J, Liu T. Enteral nutrition combined with glutamine promotes recovery after ileal pouch-anal anastomosis in rats. World J Gastroenterol 2018; 24(5): 583-592
- URL: https://www.wjgnet.com/1007-9327/full/v24/i5/583.htm
- DOI: https://dx.doi.org/10.3748/wjg.v24.i5.583


