Copyright
©The Author(s) 2018.
World J Gastroenterol. Dec 28, 2018; 24(48): 5525-5536
Published online Dec 28, 2018. doi: 10.3748/wjg.v24.i48.5525
Published online Dec 28, 2018. doi: 10.3748/wjg.v24.i48.5525
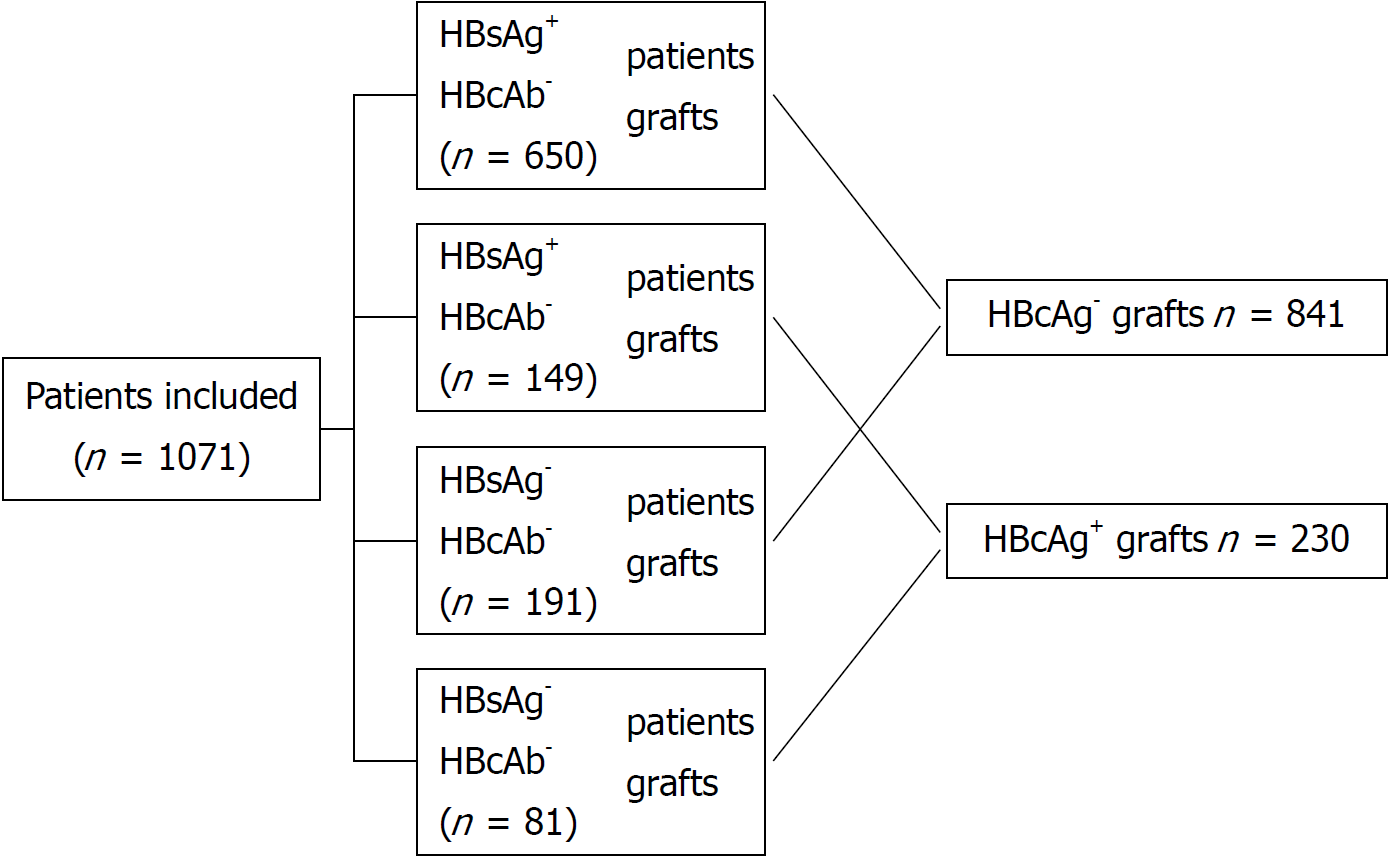
Figure 1 Flow diagram showing the allocation of hepatitis B virus core antibody positive liver grafts and hepatitis B virus surface antigen status in the whole cohort.
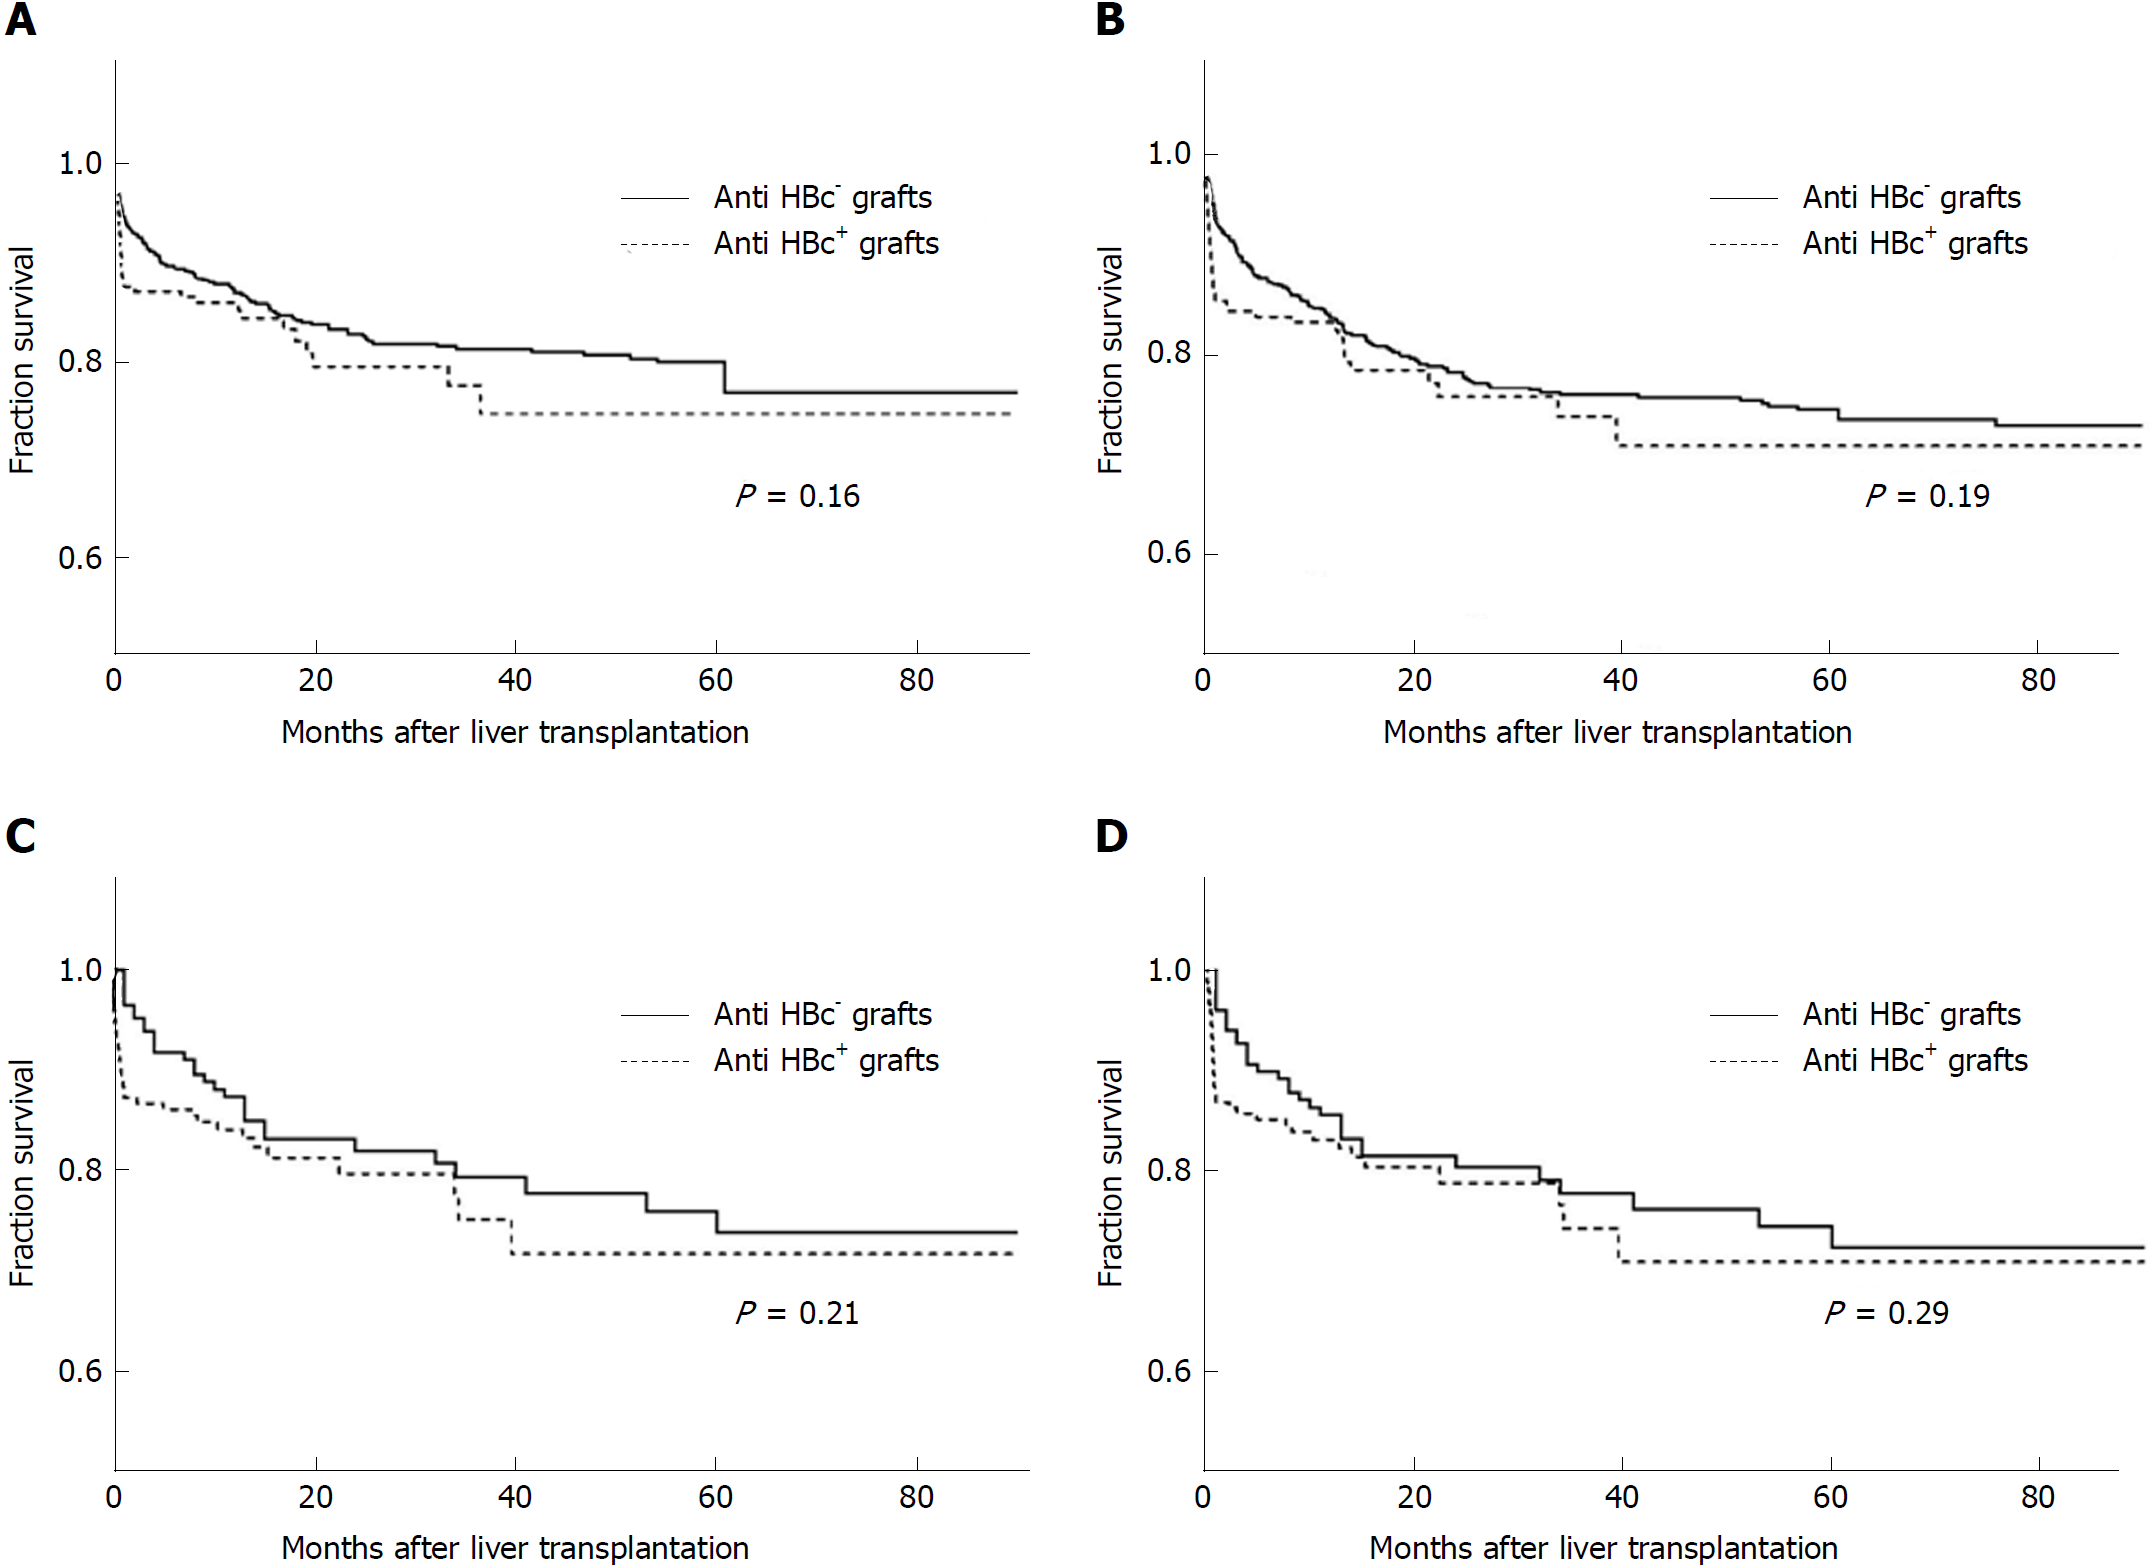
Figure 2 Patient survival and graft survival analysis of anti-hepatitis B core positive liver graft recipients and anti-hepatitis B core negative liver graft recipients.
A: Patient survival in original cohort (n = 1071); B: Graft survival in original cohort (n = 1071); C: Patient survival in propensity score-matched cohort (n = 420); D: Graft survival in propensity score-matched cohort (n = 420).
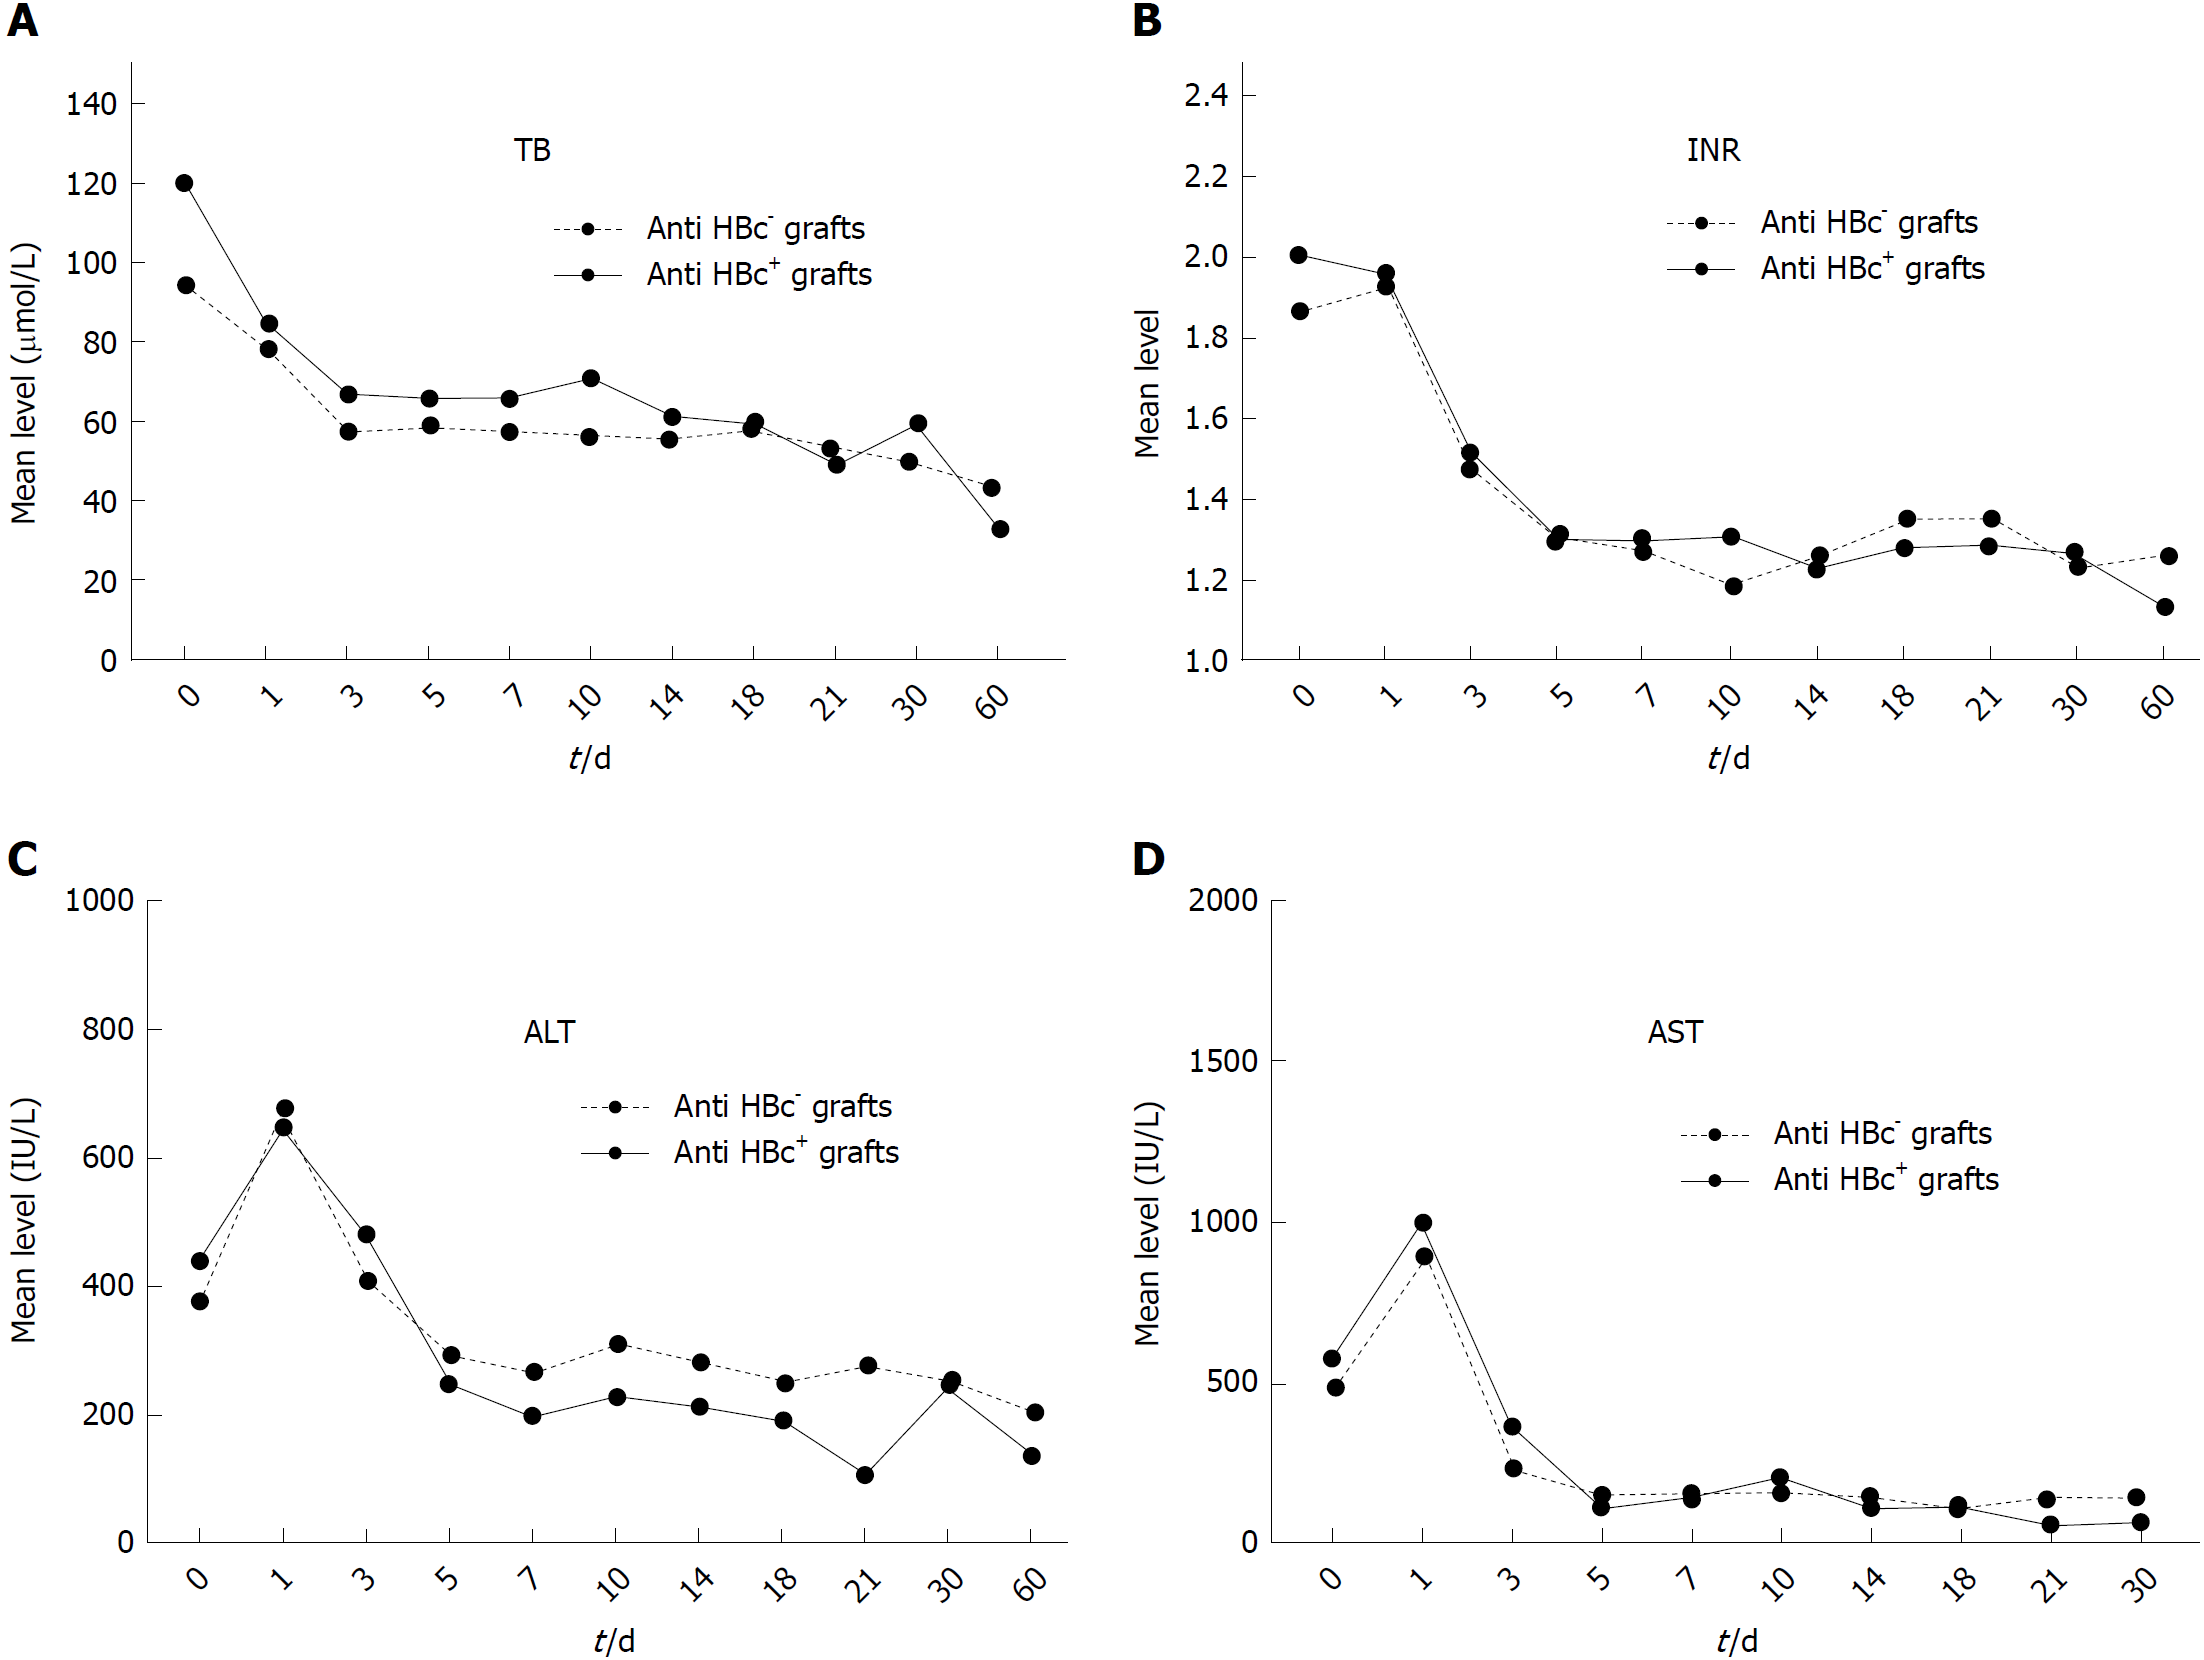
Figure 3 Comparison of graft function recovery after liver transplantation [0 d (right after operation) to 2 mo after operation] of patients who received hepatitis B virus core antibody positive grafts vs those who received hepatitis B virus core antibody negative grafts.
Each plot represents the mean value of the illustrated parameter in either group. A: Total bilirubin level between the two groups; B: International normalized ratio level between the two groups; C: Alanine transaminase level between the two groups; D: Aspartate aminotransferase level between the two groups. ALT: Alanine transaminase; AST: Aspartate aminotransferase; TB: Total bilirubin; INR: International normalized ratio.
Figure 4 Overall de novo hepatitis B virus infection rate in hepatitis B virus surface antigen negative recipients who received liver grafts from anti-hepatitis B virus core positive donors in relation to their hepatitis B virus serological status before transplant.
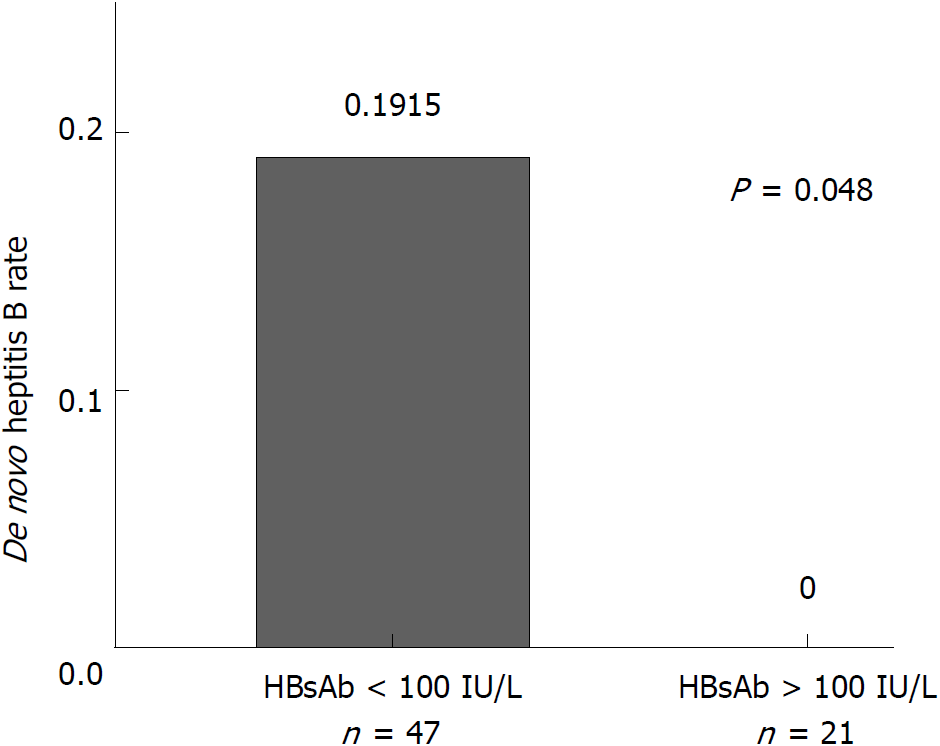
Figure 5 Hepatitis B virus infection rates post-transplant between recipients with hepatitis B virus surface antibody titer above and below 100 IU/L before transplantation.
- Citation: Lei M, Yan LN, Yang JY, Wen TF, Li B, Wang WT, Wu H, Xu MQ, Chen ZY, Wei YG. Safety of hepatitis B virus core antibody-positive grafts in liver transplantation: A single-center experience in China. World J Gastroenterol 2018; 24(48): 5525-5536
- URL: https://www.wjgnet.com/1007-9327/full/v24/i48/5525.htm
- DOI: https://dx.doi.org/10.3748/wjg.v24.i48.5525


