Copyright
©The Author(s) 2018.
World J Gastroenterol. Dec 28, 2018; 24(48): 5477-5490
Published online Dec 28, 2018. doi: 10.3748/wjg.v24.i48.5477
Published online Dec 28, 2018. doi: 10.3748/wjg.v24.i48.5477
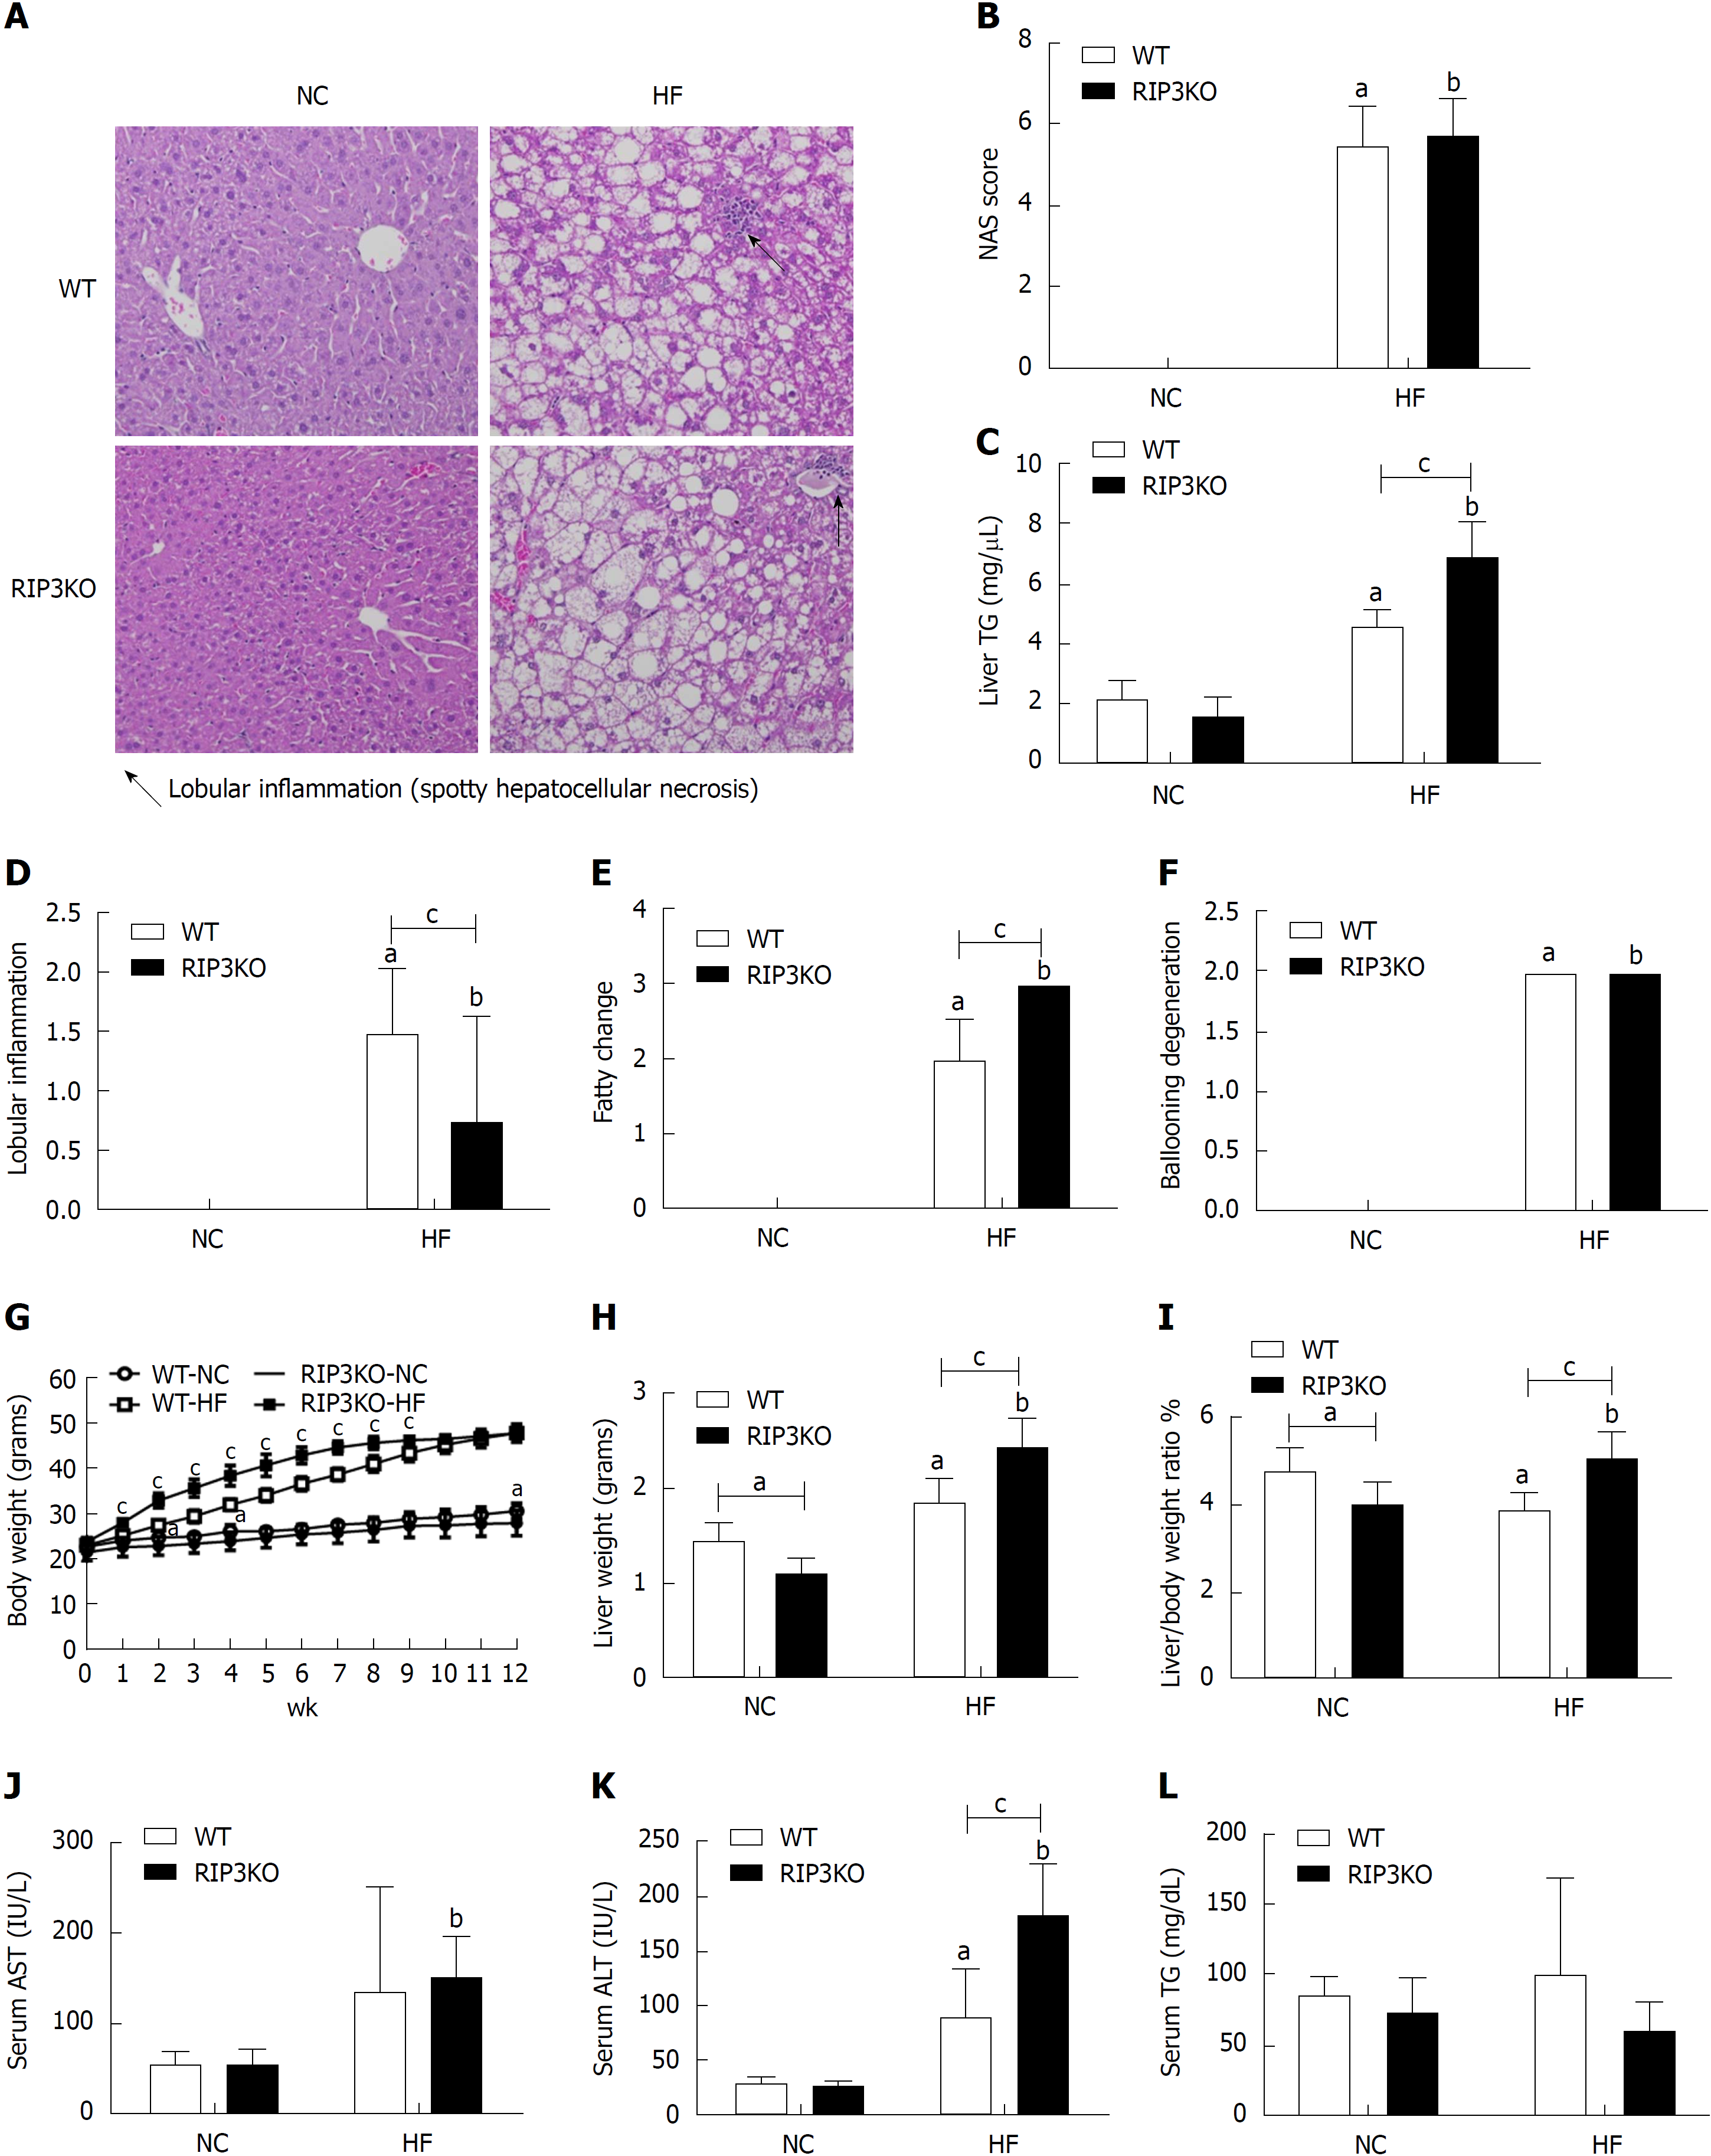
Figure 1 Receptor interacting protein kinase-3 deletion exacerbates HF diet induced steatosis.
A: Following 12-wk HF diet, the liver tissue hematoxylin & eosin staining showed increased steatosis in RIP3KO-HF group compared to WT-HF group. B-F: Liver TG contents were significantly increased in the RIP3KO-HF group compared to the WT-HF group. RIP3KO-HF group had increased steatosis and decreased lobular inflammation. G-L: HF diet fed RIP3KO mice had increased liver weight and liver/body weight ratio compared to HF diet fed WT mice. The RIP3KO-HF group had increased serum AST and ALT but decreased serum TG compared to the WT-HF group. aP < 0.05 by Mann-Whitney U test, compared to NC diet fed WT group; bP < 0.05 by Mann-Whitney U test, compared to NC diet fed RIP3-KO group; cP < 0.05 by Mann-Whitney U test, compared to HF diet fed WT group. HF: High fat; NC: Normal chow; WT: Wild-type; KO: Knockout; RIP3: Receptor interacting protein kinase-3; AST: Aspartate aminotransferase; ALT: Alanine aminotransferase; TG: Triglycerides.
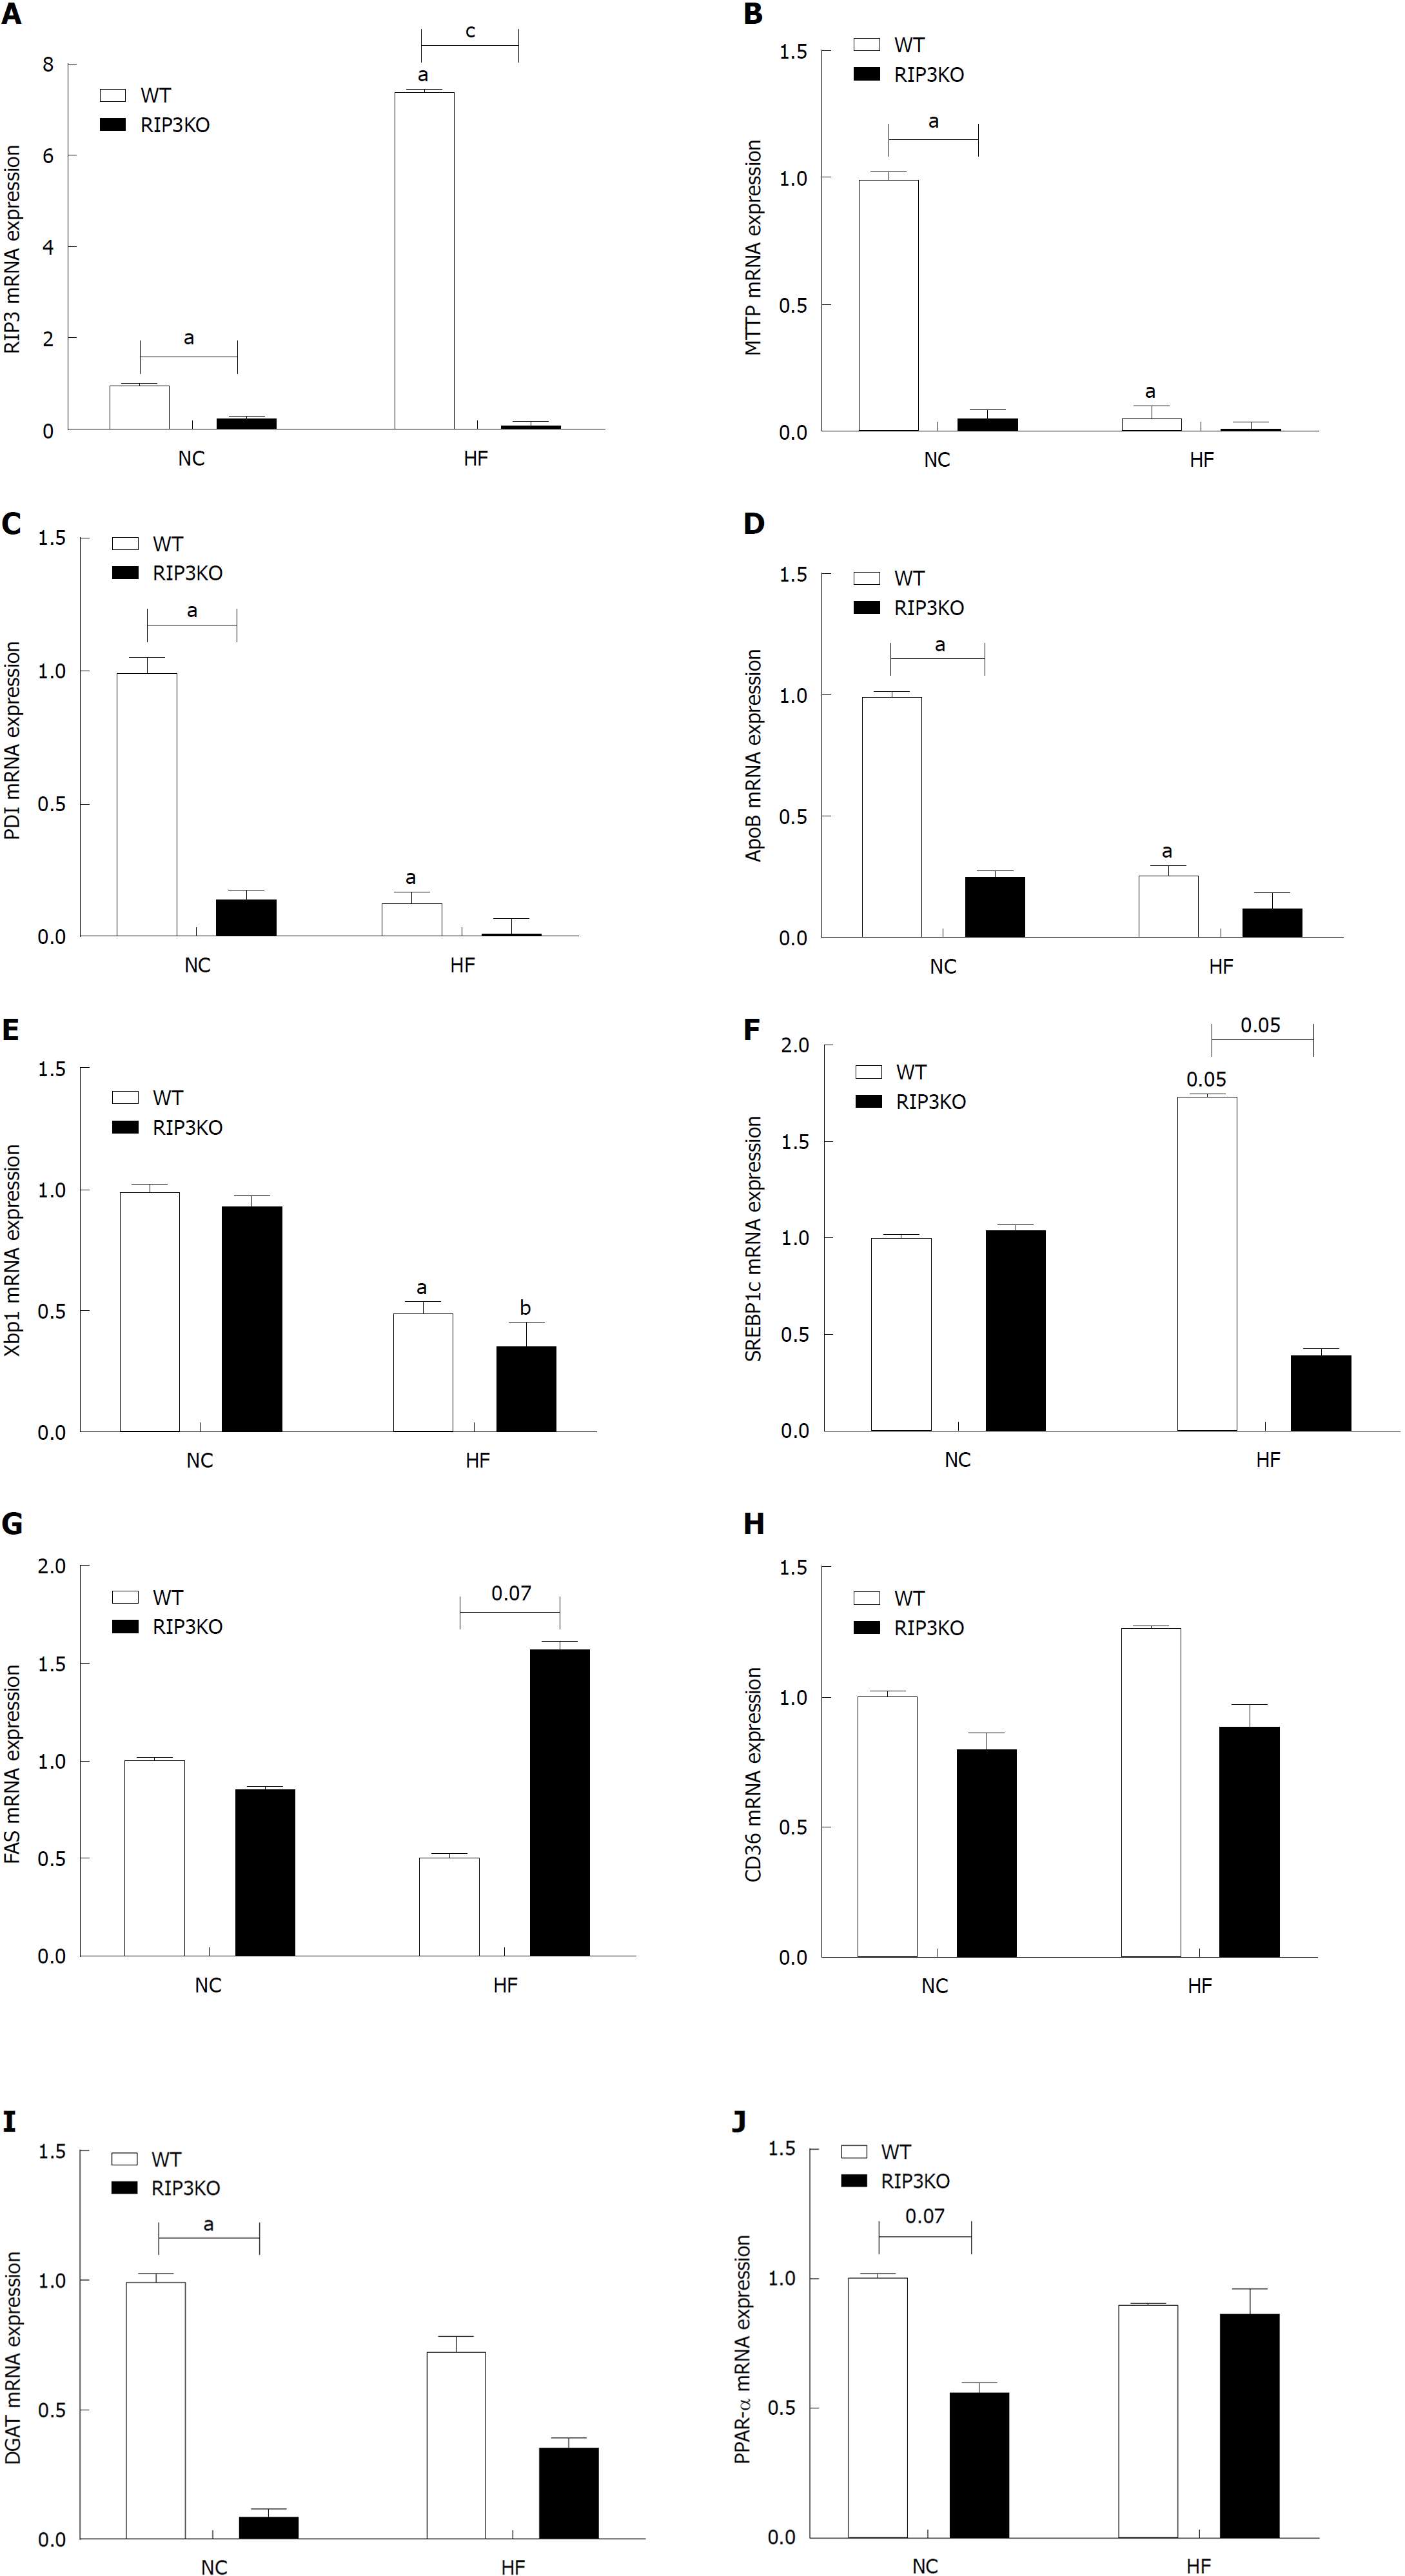
Figure 2 Effect of receptor interacting protein kinase-3 deletion on fat synthesis.
A-J: Quantitative real-time PCR analysis showed an increased expression of RIP3 the WT-HF group after HF diet feeding. Interestingly, very-low-density lipoprotein secretion markers including apolipoprotein-B, microsomal triglyceride transfer protein, protein disulfide isomerase, and X-box binding protein-1 were decreased in the RIP3KO-HF group compared to the WT-HF group. The differences in SREBP1c, FAS, CD36, DGAT, and PPAR-α were not definite. aP < 0.05 by Mann-Whitney U test, compared to NC diet fed WT group; bP < 0.05 by Mann-Whitney U test, compared to NC diet fed RIP3-KO group; cP < 0.05 by Mann-Whitney U test, compared to HF diet fed WT group. HF: High fat; KO: Knockout; NC: Normal chow; WT: Wild-type; RIP3: Receptor interacting protein kinase-3; VLDL: Very-low-density lipoproteins; ApoB: Apolipoprotein-B; MTTP: Microsomal triglyceride transfer protein; PDI: Protein disulfide isomerase; XBP1: X-box binding protein-1; SREBP1c: Sterol regulatory element-binding protein-1c; FAS: Fatty acid synthase; CD36: Cluster of differentiation-36; DGAT: Diglyceride acyltransferase; PPAR-α: Peroxisome proliferator-activated receptor alpha.
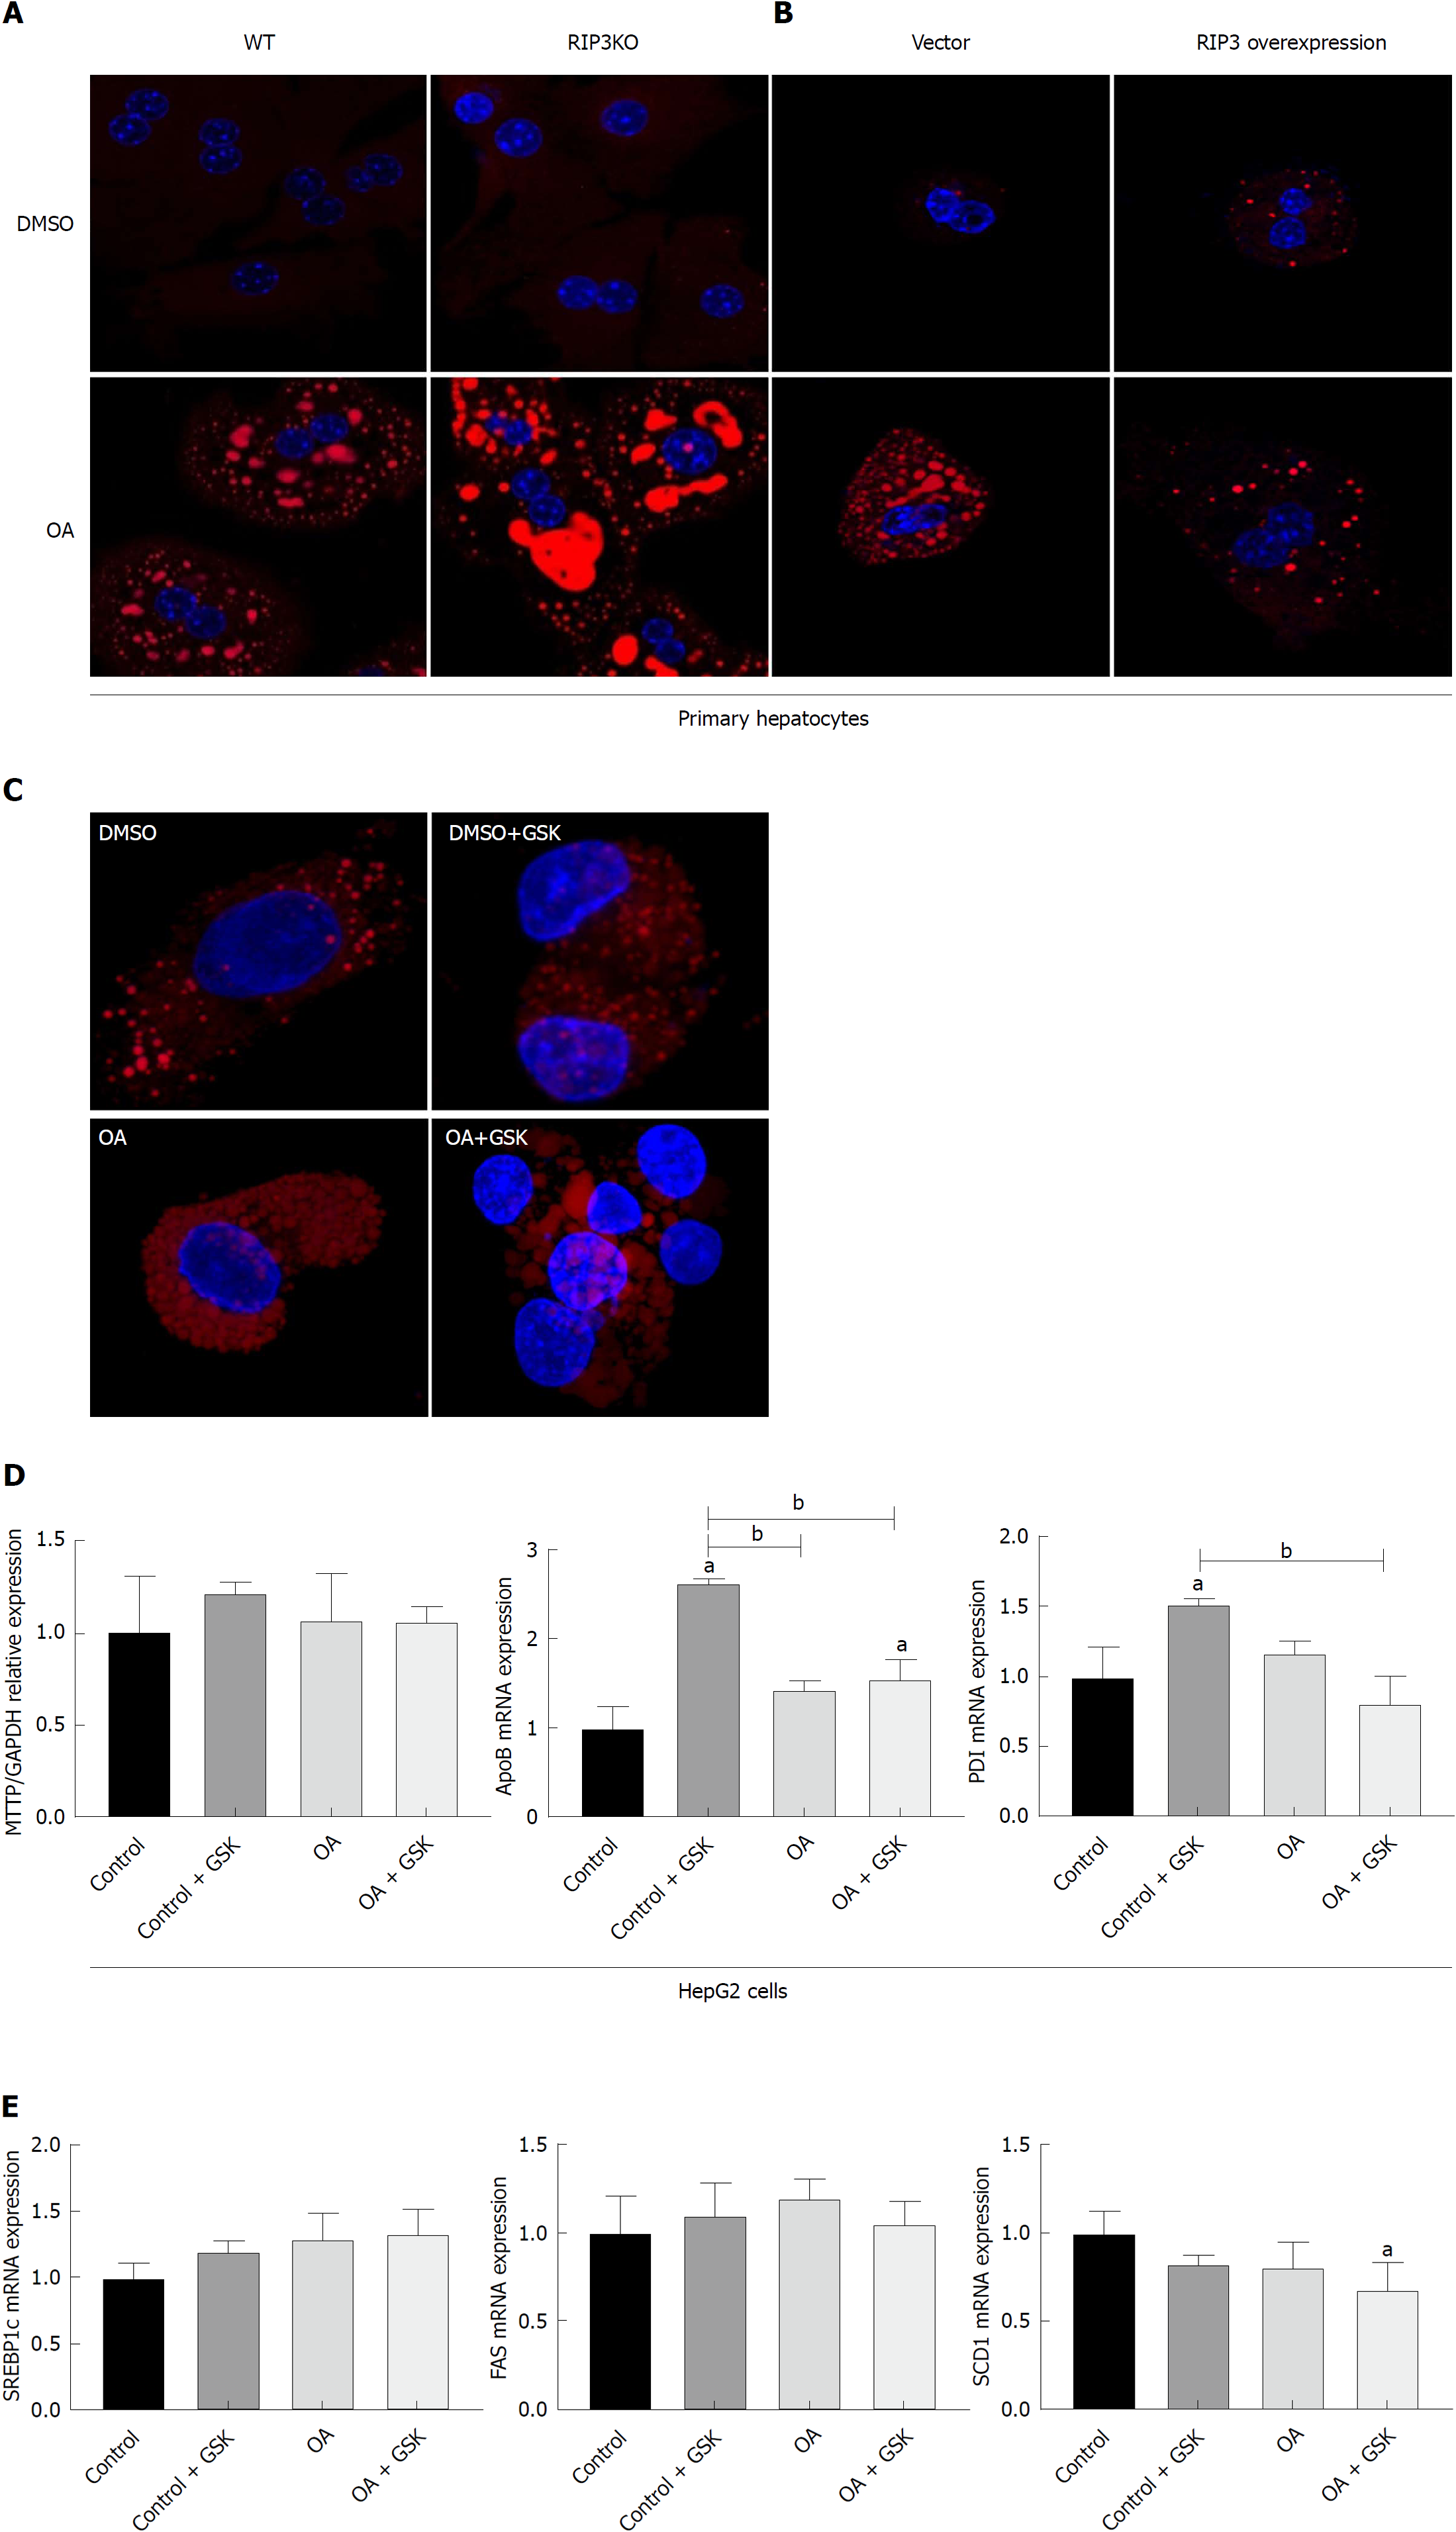
Figure 3 RIP3 deletion increases hepatic fat storage.
A and B: The primary hepatocytes from WT and RIP3KO mice were treated with DMSO and OA. The RIP3KO primary hepatocytes had increased Nile red staining compared to WT primary hepatocytes. RIP3 overexpression decreased Nile red staining compared to the vector group treated with OA. C and D: HepG2 cells treated with GSK'843 did not show increase Nile red staining. The expression of MTTP, PDI, and ApoB was also not decreased in GSK'843 treated HepG2 cells. E: GSK'843 treatment did not increase the expression of SREBP1c, FAS, and SCD-1 in HepG2 cells. aP < 0.05 by ANOVA, Duncan post hoc analysis, compared to control; bP < 0.05 by ANOVA, Duncan post hoc analysis. WT: Wild-type; RIP3: Receptor interacting protein kinase-3; KO: Knockout; DMSO: Dimethyl sulfoxide; OA: Oleic acid; ApoB: Apolipoprotein-B; MTTP: Microsomal triglyceride transfer protein; PDI: Protein disulfide isomerase; XBP1: X-box binding protein-1; SREBP1c: Sterol regulatory element-binding protein-1c; FAS: Fatty acid synthase; SCD-1: Stearyl-CoA desaturase-1; ANOVA, Analysis of variance.
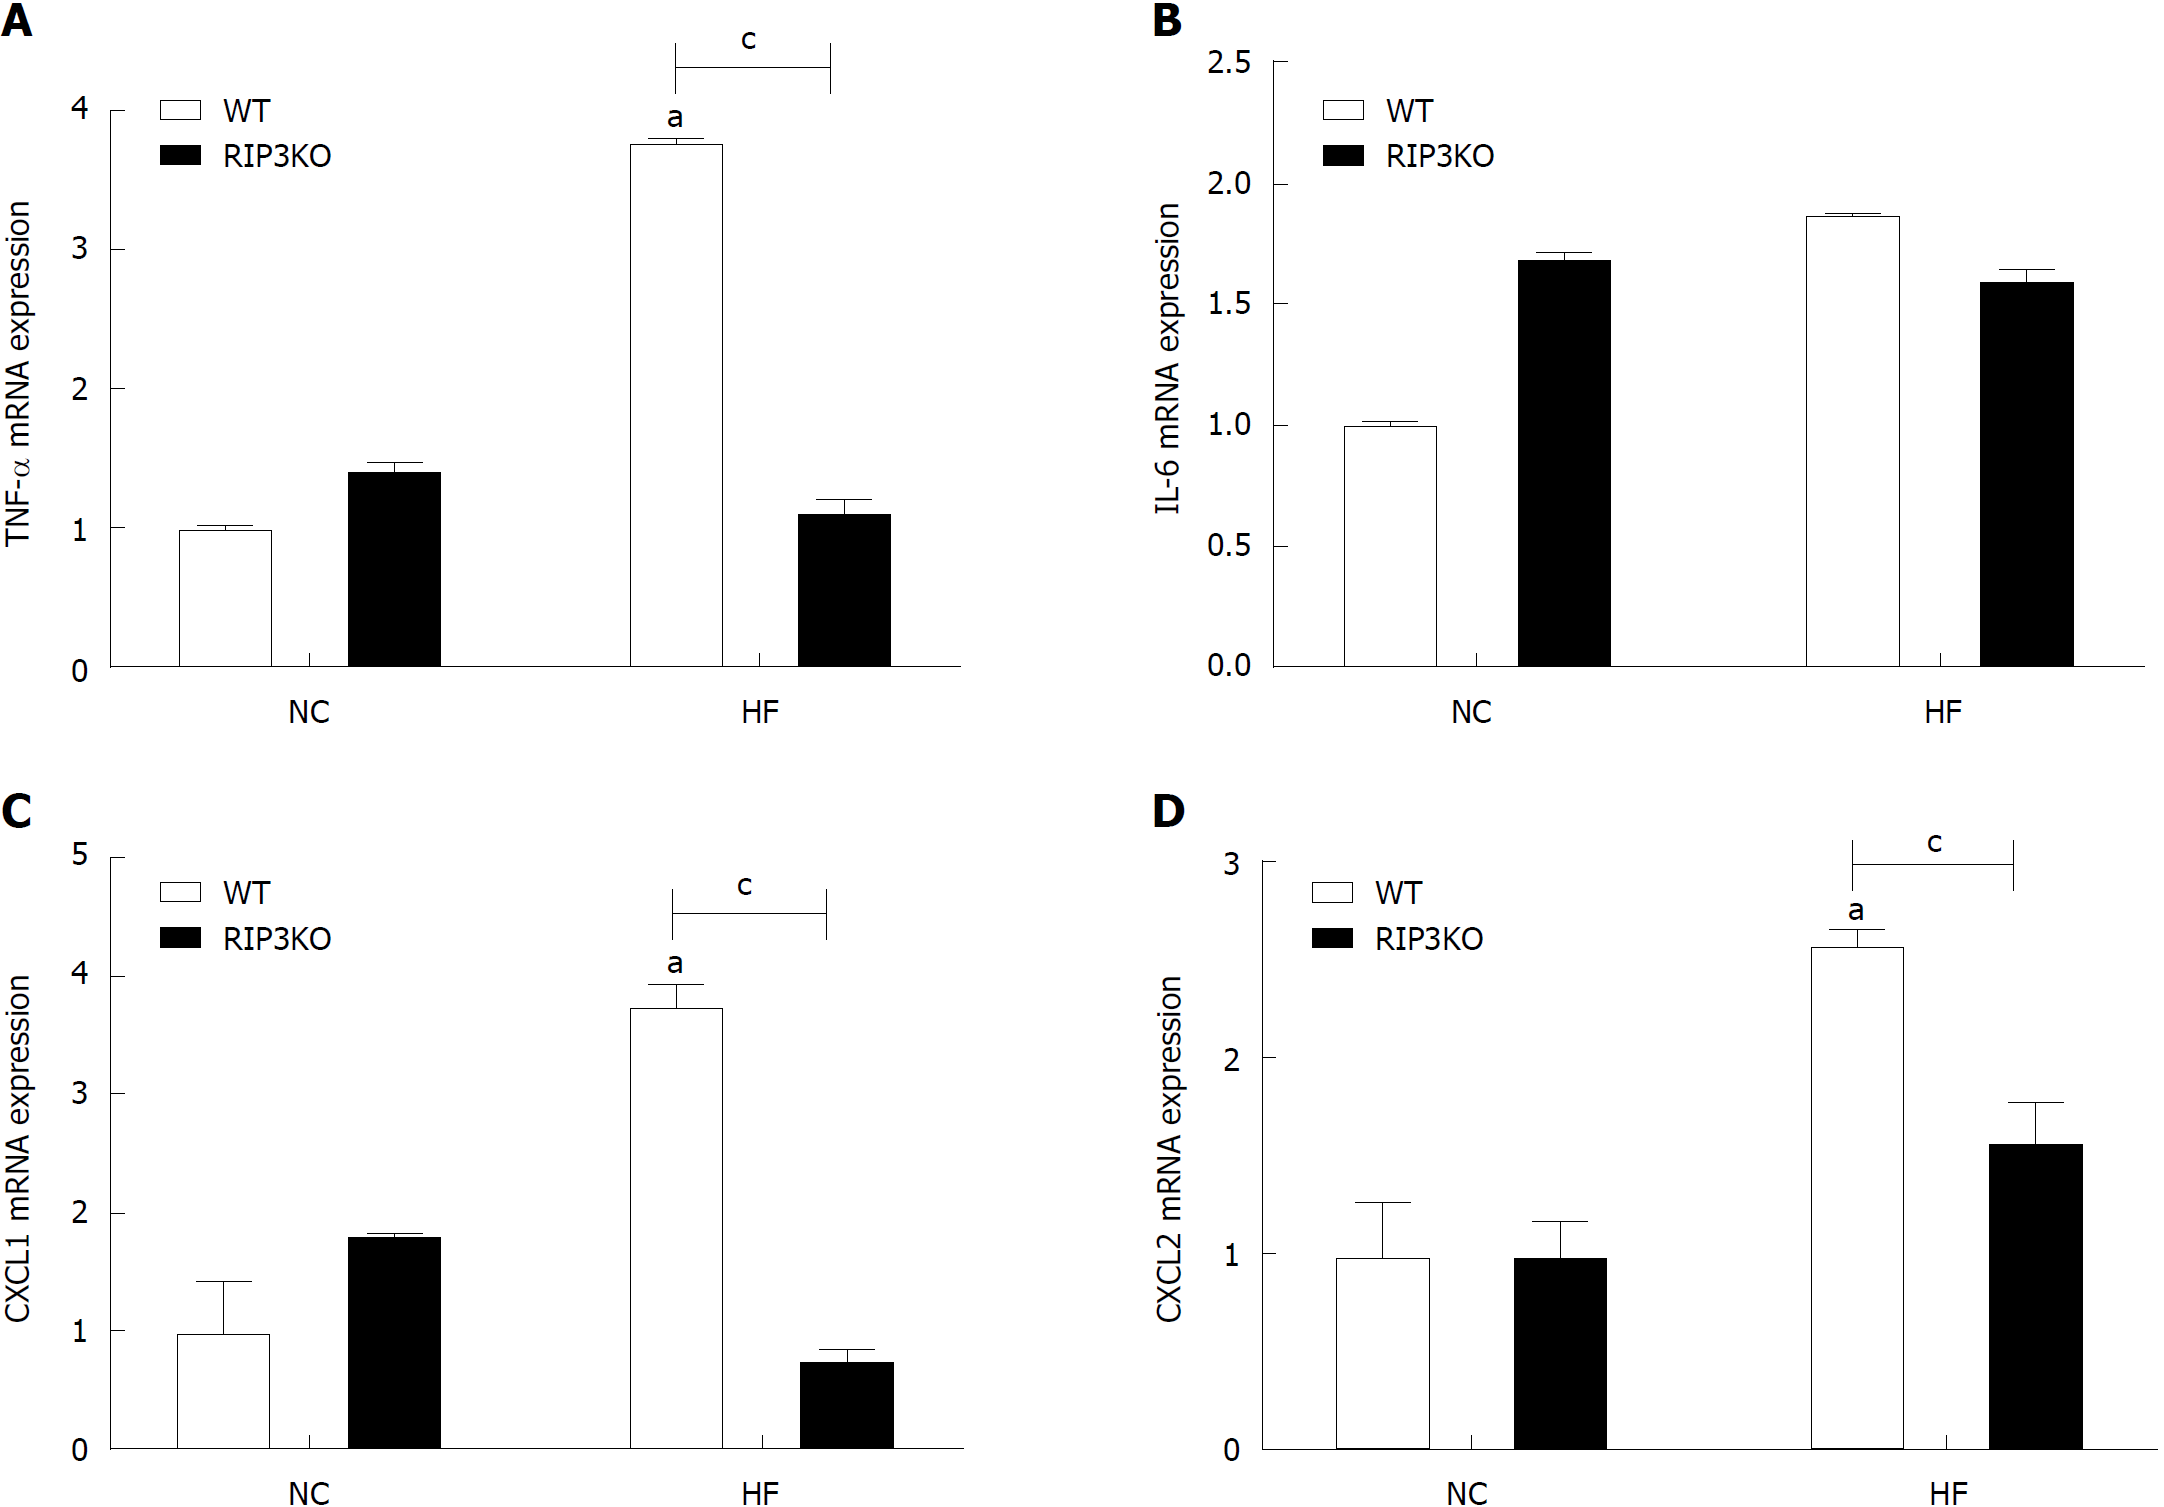
Figure 4 RIP3 reduces inflammation in liver tissue.
Following HF diet feeding, RIP3KO mice had reduced expression of TNF-α, CXCL1, and CXCL2 compared to HF diet fed WT mice. aP < 0.05 by Mann-Whitney U test, compared to NC diet fed WT group; cP < 0.05 by Mann-Whitney U test, compared to HF diet fed WT group. HF: High fat; KO: Knockout; WT: Wild-type; NC: Normal chow; RIP3: Receptor interacting protein kinase-3; TNF-α: Tumor necrosis factor alpha; CXCL1: Chemokine (C-X-C motif) ligand-1; CXCL2: Chemokine (C-X-C motif) ligand-2.
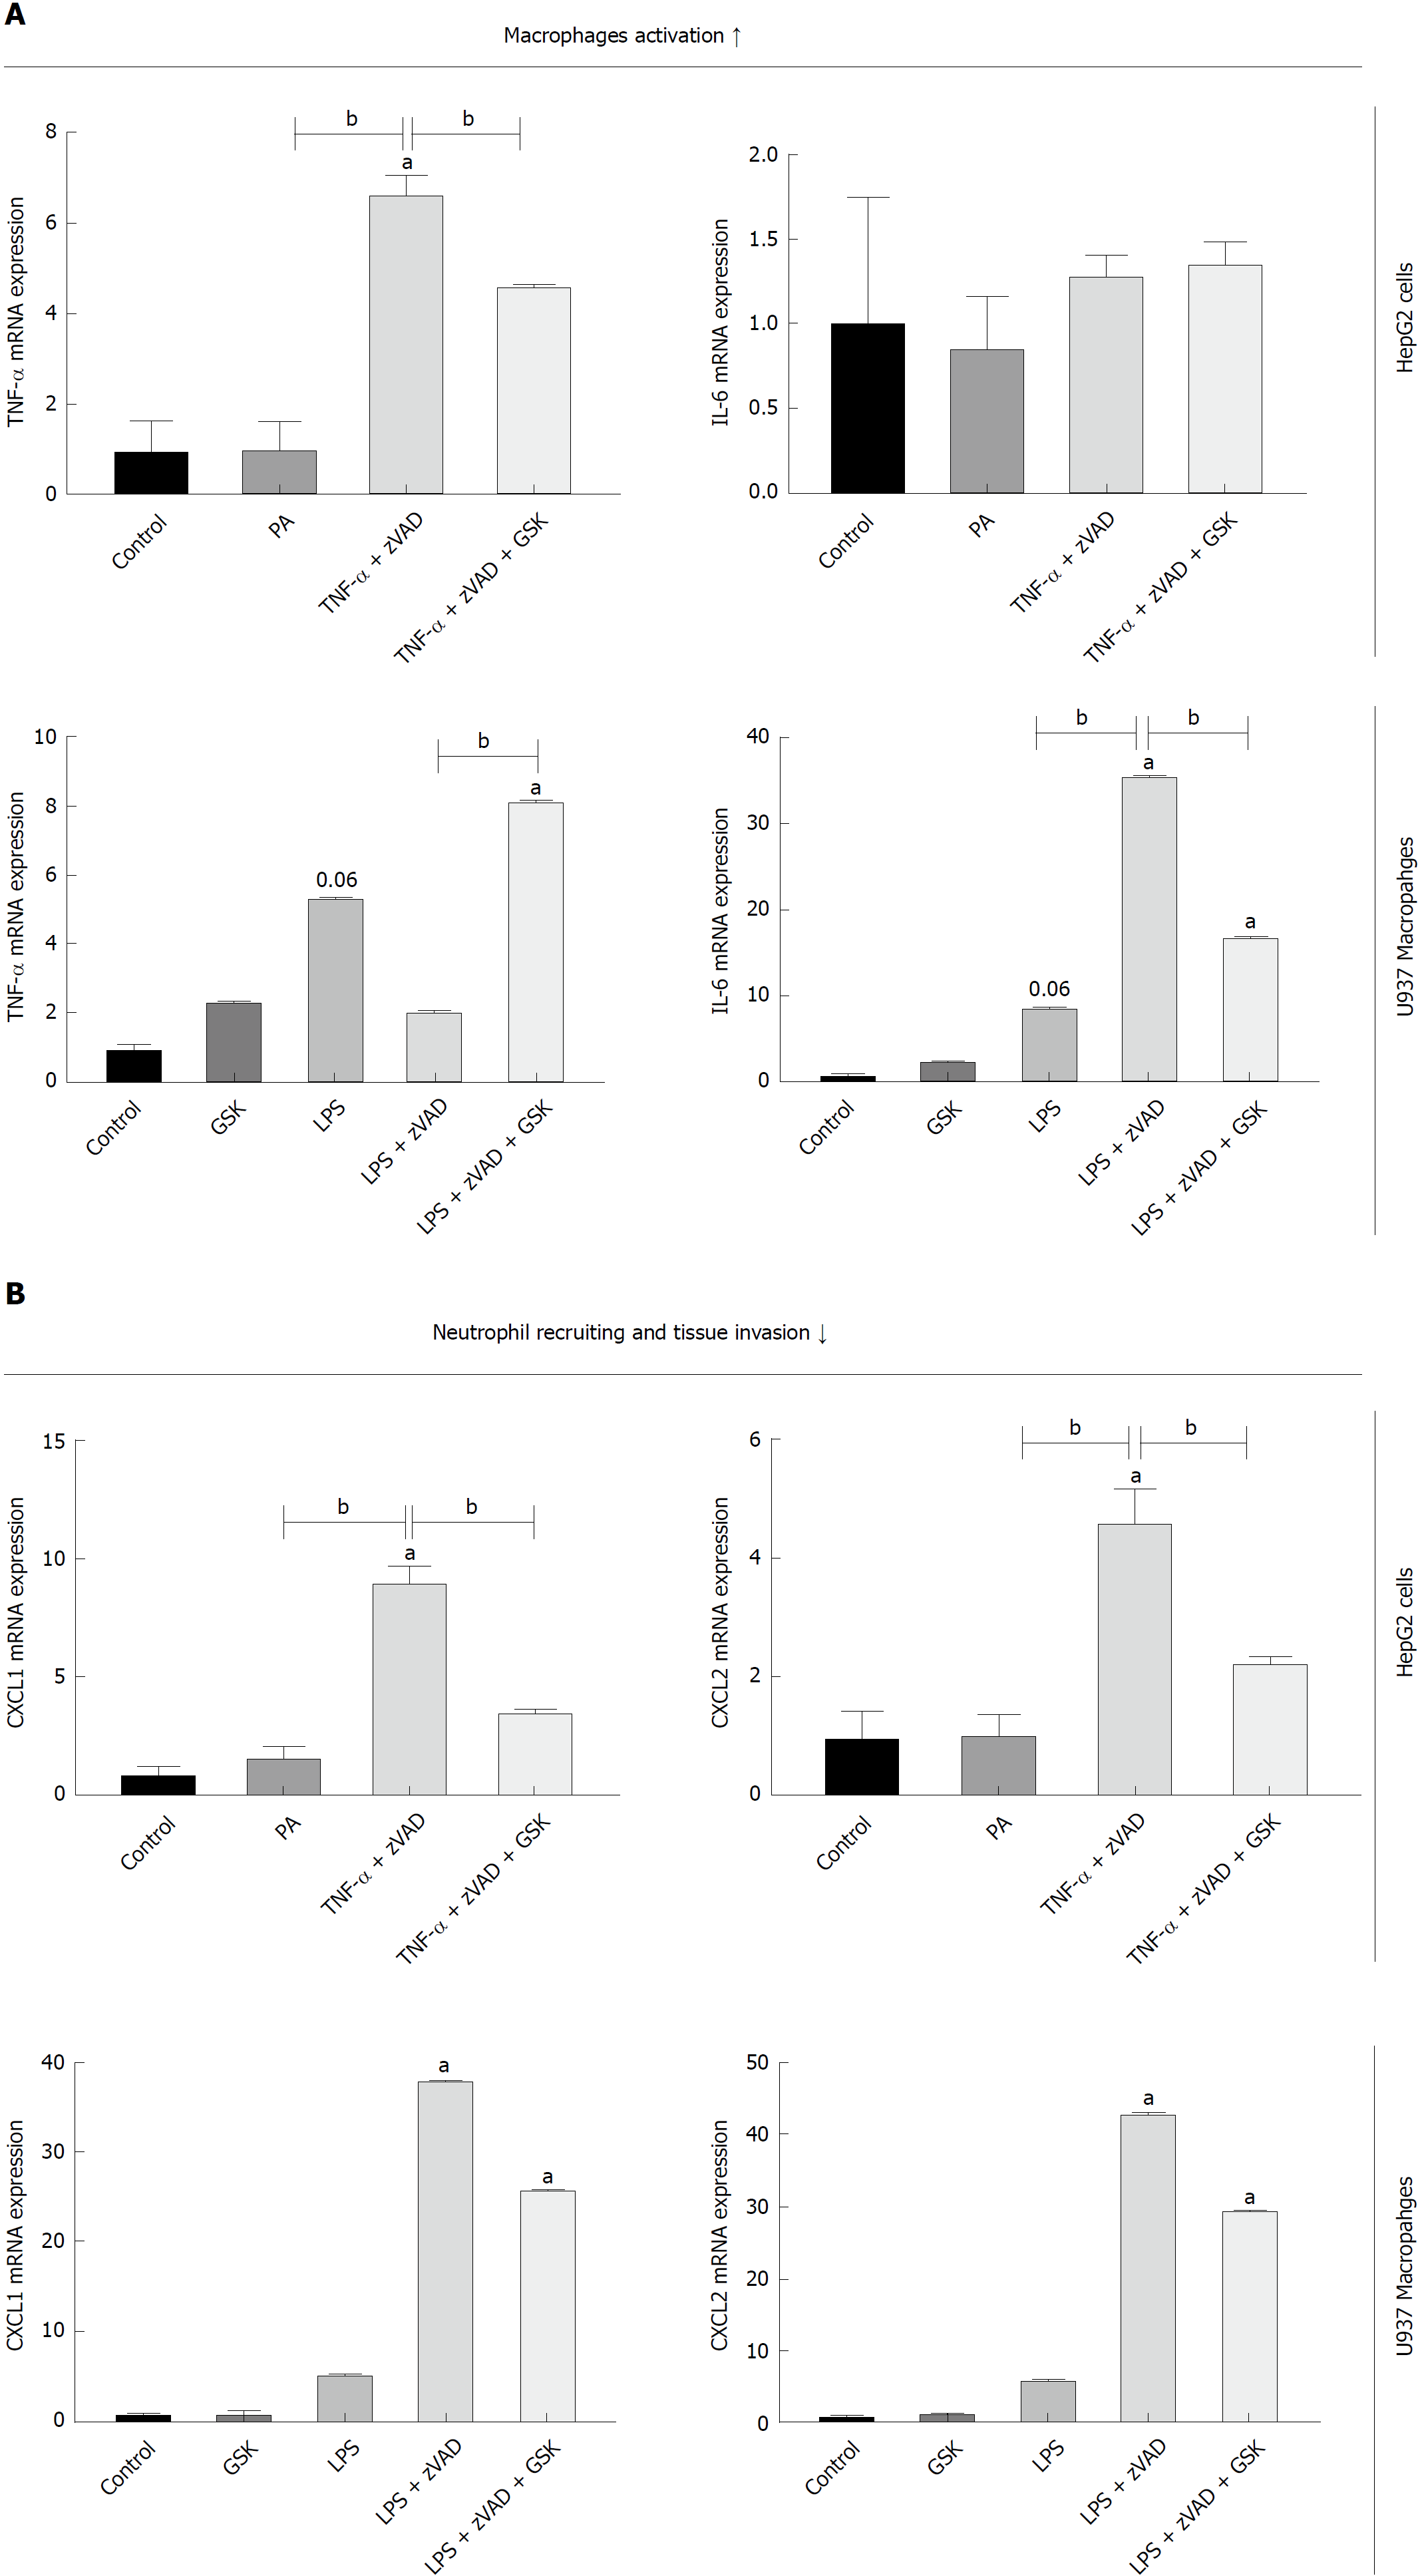
Figure 5 Effect of RIP3 on inflammatory markers.
A and B: TNF-α/LPS + zVAD induced increase in TNF-α expression was exacerbated with GSK'843 treatment. TNF-α/LPS + zVAD induced increased expression of CXCL1 and CXCL2 was decreased with GSK'843 treatment. aP < 0.05 by ANOVA, Duncan post hoc analysis, compared to control; bP < 0.05 by ANOVA, Duncan post hoc analysis. TNF-α: Tumor necrosis factor alpha; LPS: Lipopolysaccharide; zVAD: N-Benzyloxycarbonyl-Val-Ala-Asp(O-Me) fluoromethyl ketone; CXCL1: Chemokine (C-X-C motif) ligand-1; CXCL2: Chemokine (C-X-C motif) ligand-2; ANOVA, Analysis of variance.
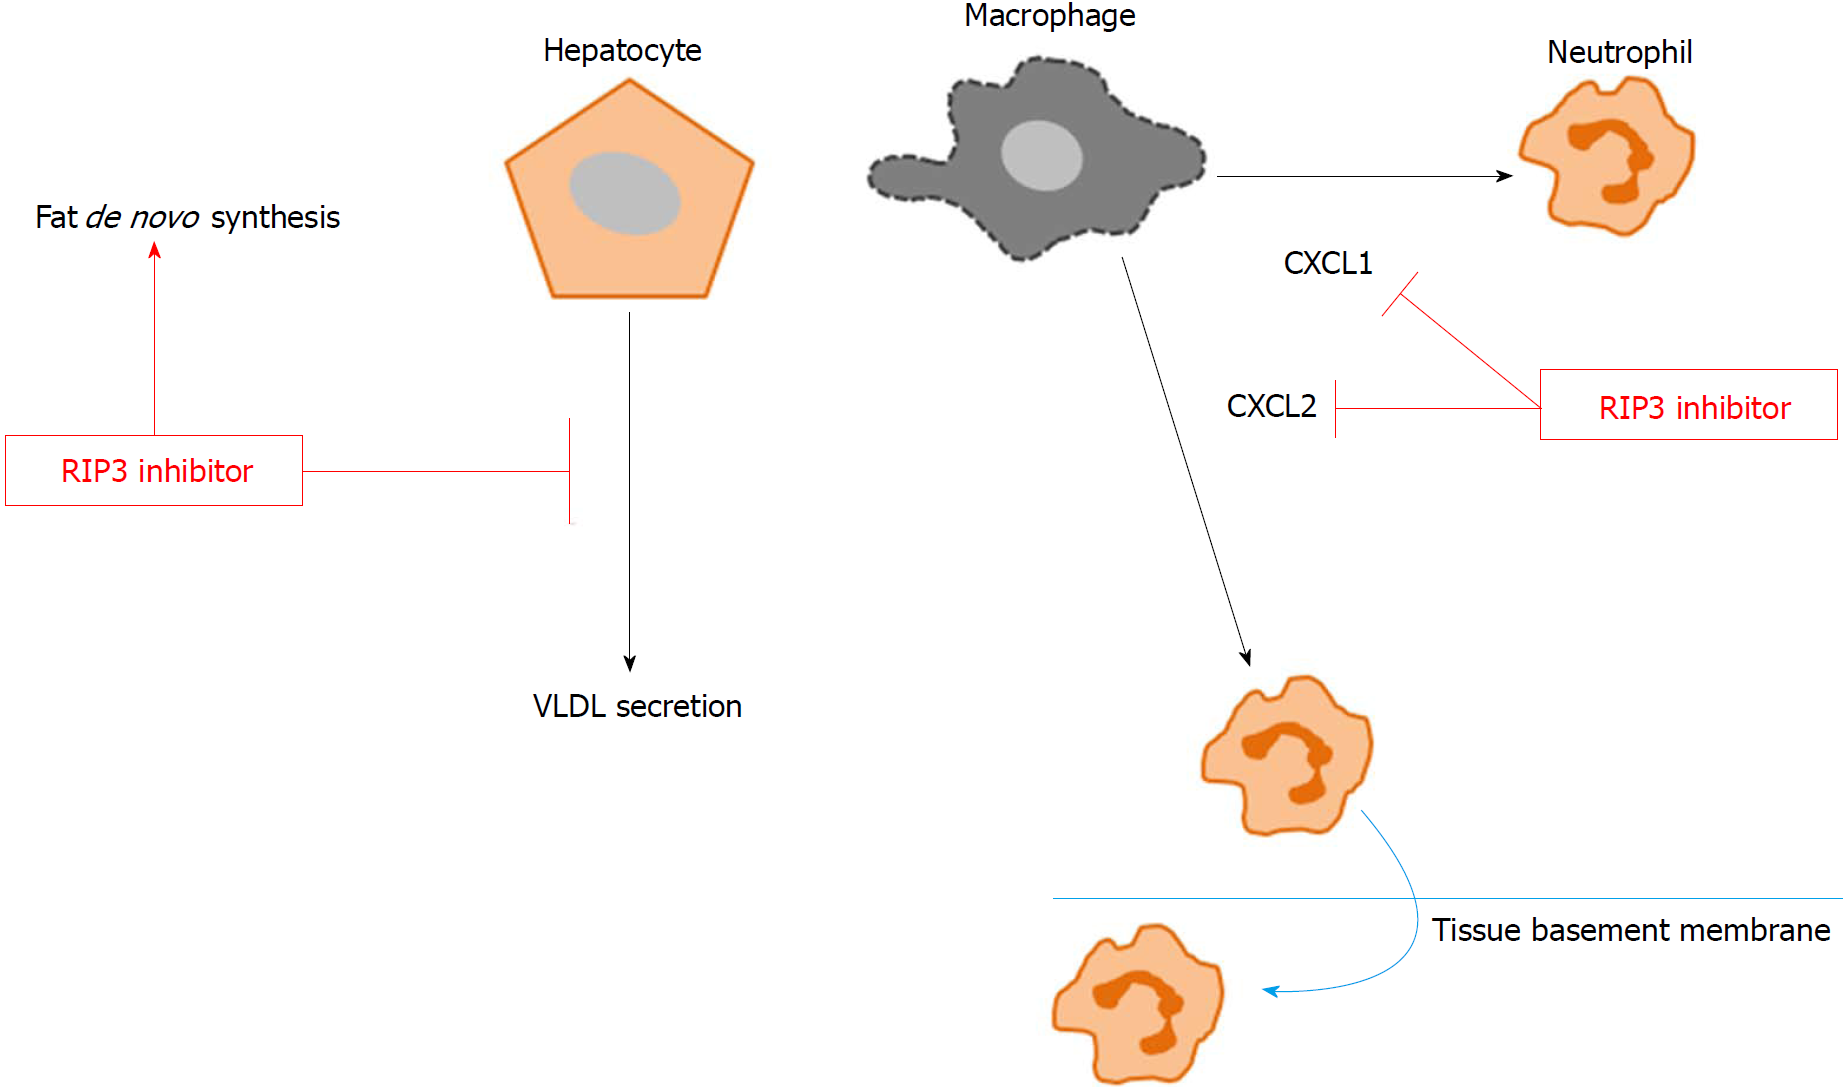
Figure 6 Conceptual diagram.
GSK'843 treatment decreases neutrophil recruitment markers, including CXCL1 and CXCL2, thereby reducing neutrophil recruitment to the tissue. However, RIP3 inhibition increases de novo fat synthesis while decreasing VLDL secretion. RIP3: Receptor interacting protein kinase-3; CXCL1: Chemokine (C-X-C motif) ligand-1; CXCL2: Chemokine (C-X-C motif) ligand-2; VLDL: Very-low-density lipoproteins.
- Citation: Saeed WK, Jun DW, Jang K, Ahn SB, Oh JH, Chae YJ, Lee JS, Kang HT. Mismatched effects of receptor interacting protein kinase-3 on hepatic steatosis and inflammation in non-alcoholic fatty liver disease. World J Gastroenterol 2018; 24(48): 5477-5490
- URL: https://www.wjgnet.com/1007-9327/full/v24/i48/5477.htm
- DOI: https://dx.doi.org/10.3748/wjg.v24.i48.5477


