Copyright
©The Author(s) 2018.
World J Gastroenterol. Dec 21, 2018; 24(47): 5312-5321
Published online Dec 21, 2018. doi: 10.3748/wjg.v24.i47.5312
Published online Dec 21, 2018. doi: 10.3748/wjg.v24.i47.5312
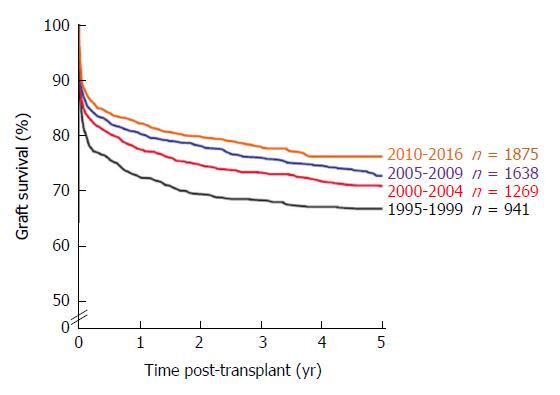
Figure 1 Graft survival of liver transplants in 0-17-year-old pediatric patients by transplant year from 1995-2016.
Collaborative Transplant Study data are derived from 95 transplant centers in 22 countries (87% European transplants).
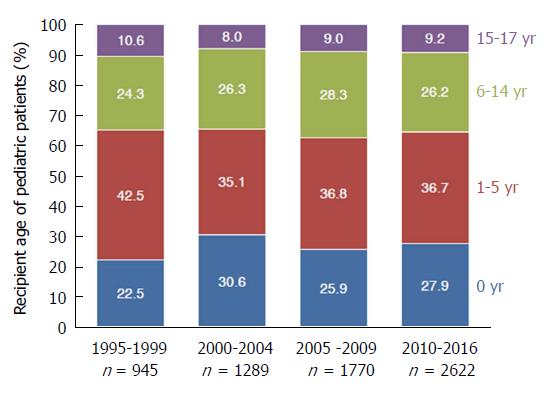
Figure 2 Different pediatric age groups and distribution of liver transplants by transplant year from 1995-2016.
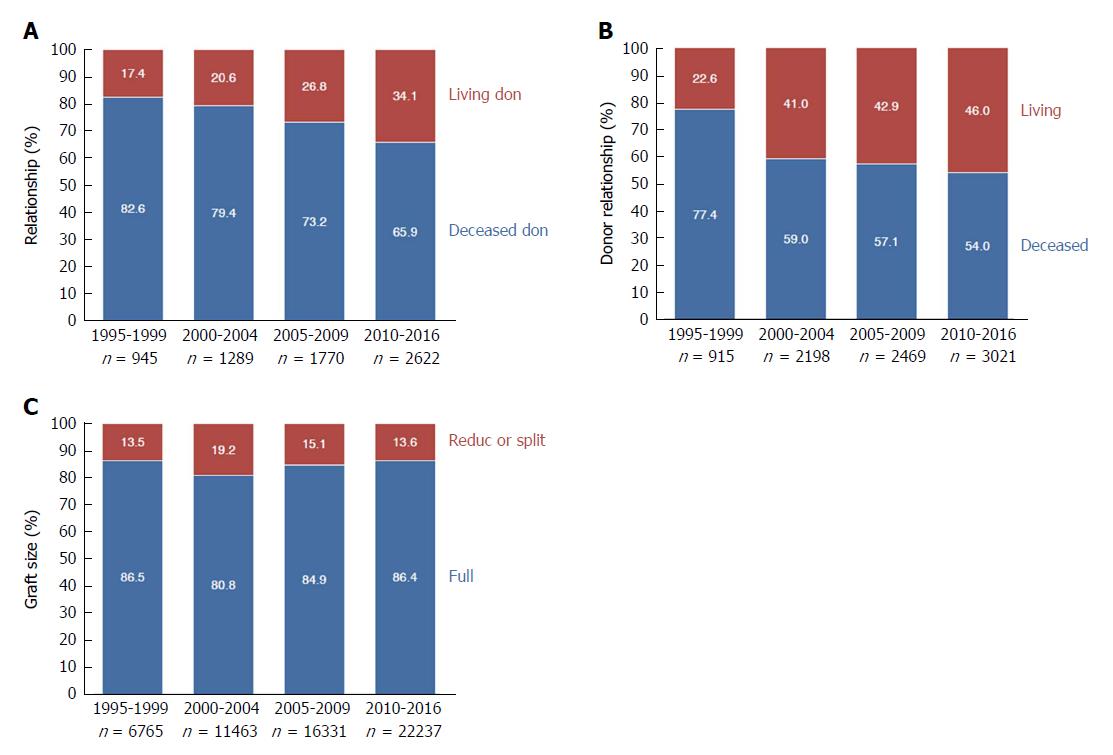
Figure 3 Pediatric (A) and split or reduced liver transplants from living or deceased donors (B) and all liver transplants categorized according to graft size (C) by transplant year from 1995-2016.
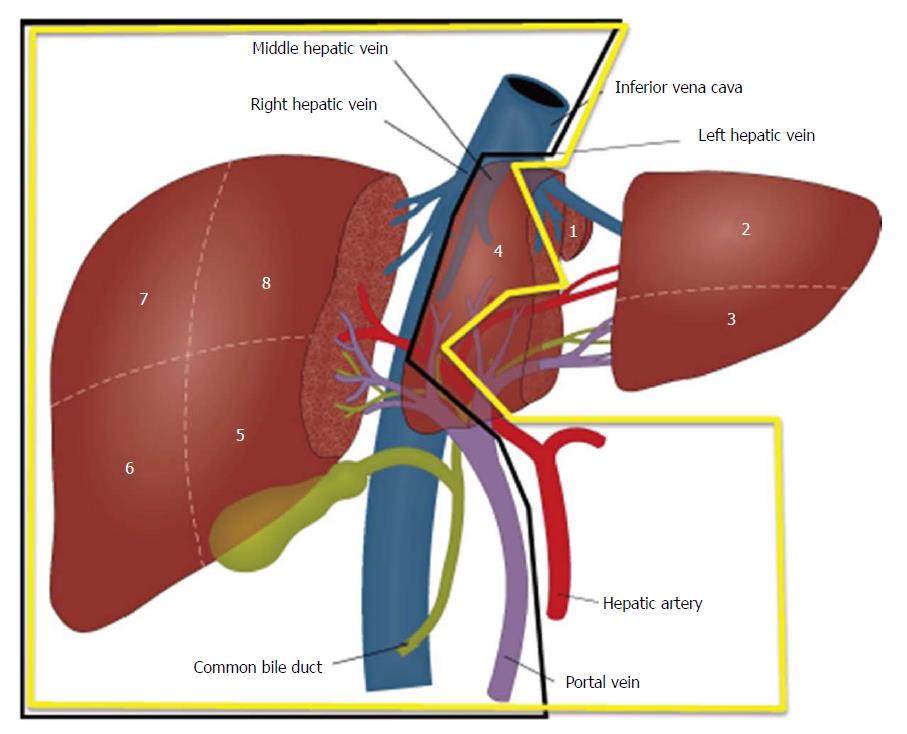
Figure 4 Scheme of a “classical” extended right lobe/left lateral lobe split (yellow line) and a full left/full right split (black line).
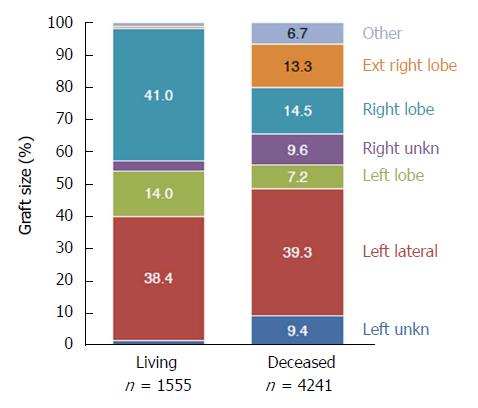
Figure 5 Split or reduced liver transplants from 1995-2016 categorized according to graft size.
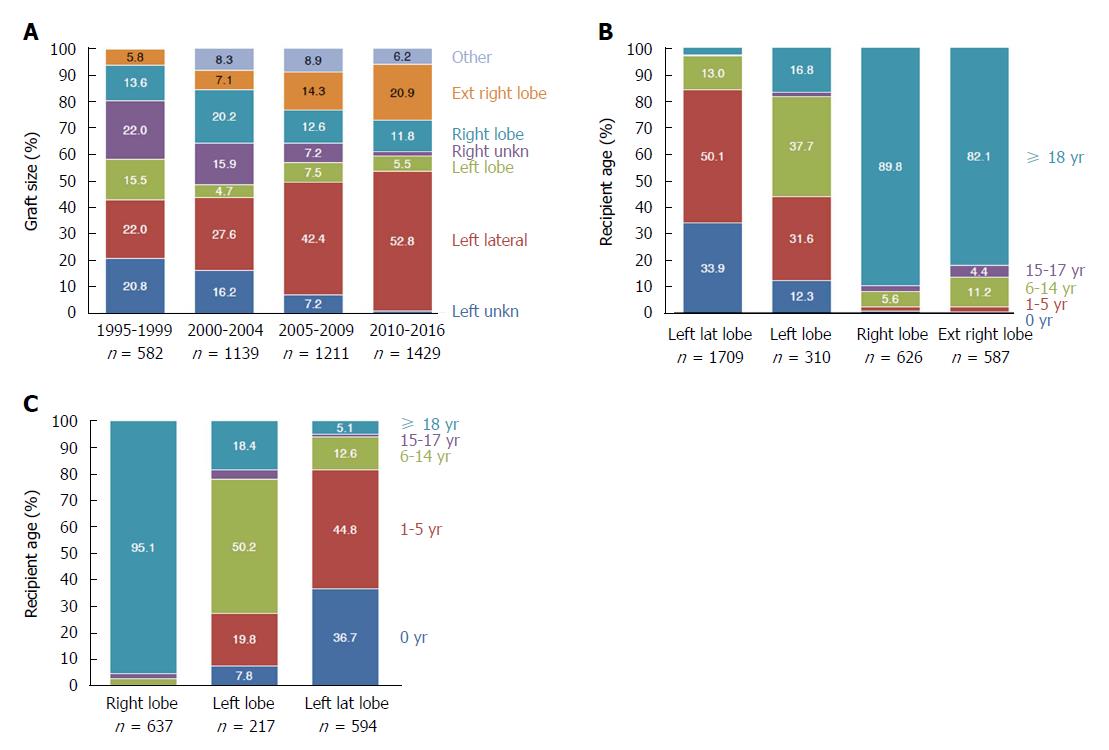
Figure 6 Split or reduced liver transplants from 1995-2016 from deceased donors categorized according to (A) graft size, (B) recipient age, and (C) from living donors categorized according to recipient age.
Figure 7 Distribution of donor age according to transplant year (A) and recipient age (B) in deceased donor split or reduced liver transplantations performed from 1995-2016.
- Citation: Hackl C, Schmidt KM, Süsal C, Döhler B, Zidek M, Schlitt HJ. Split liver transplantation: Current developments. World J Gastroenterol 2018; 24(47): 5312-5321
- URL: https://www.wjgnet.com/1007-9327/full/v24/i47/5312.htm
- DOI: https://dx.doi.org/10.3748/wjg.v24.i47.5312


