Copyright
©The Author(s) 2018.
World J Gastroenterol. Nov 28, 2018; 24(44): 5025-5033
Published online Nov 28, 2018. doi: 10.3748/wjg.v24.i44.5025
Published online Nov 28, 2018. doi: 10.3748/wjg.v24.i44.5025
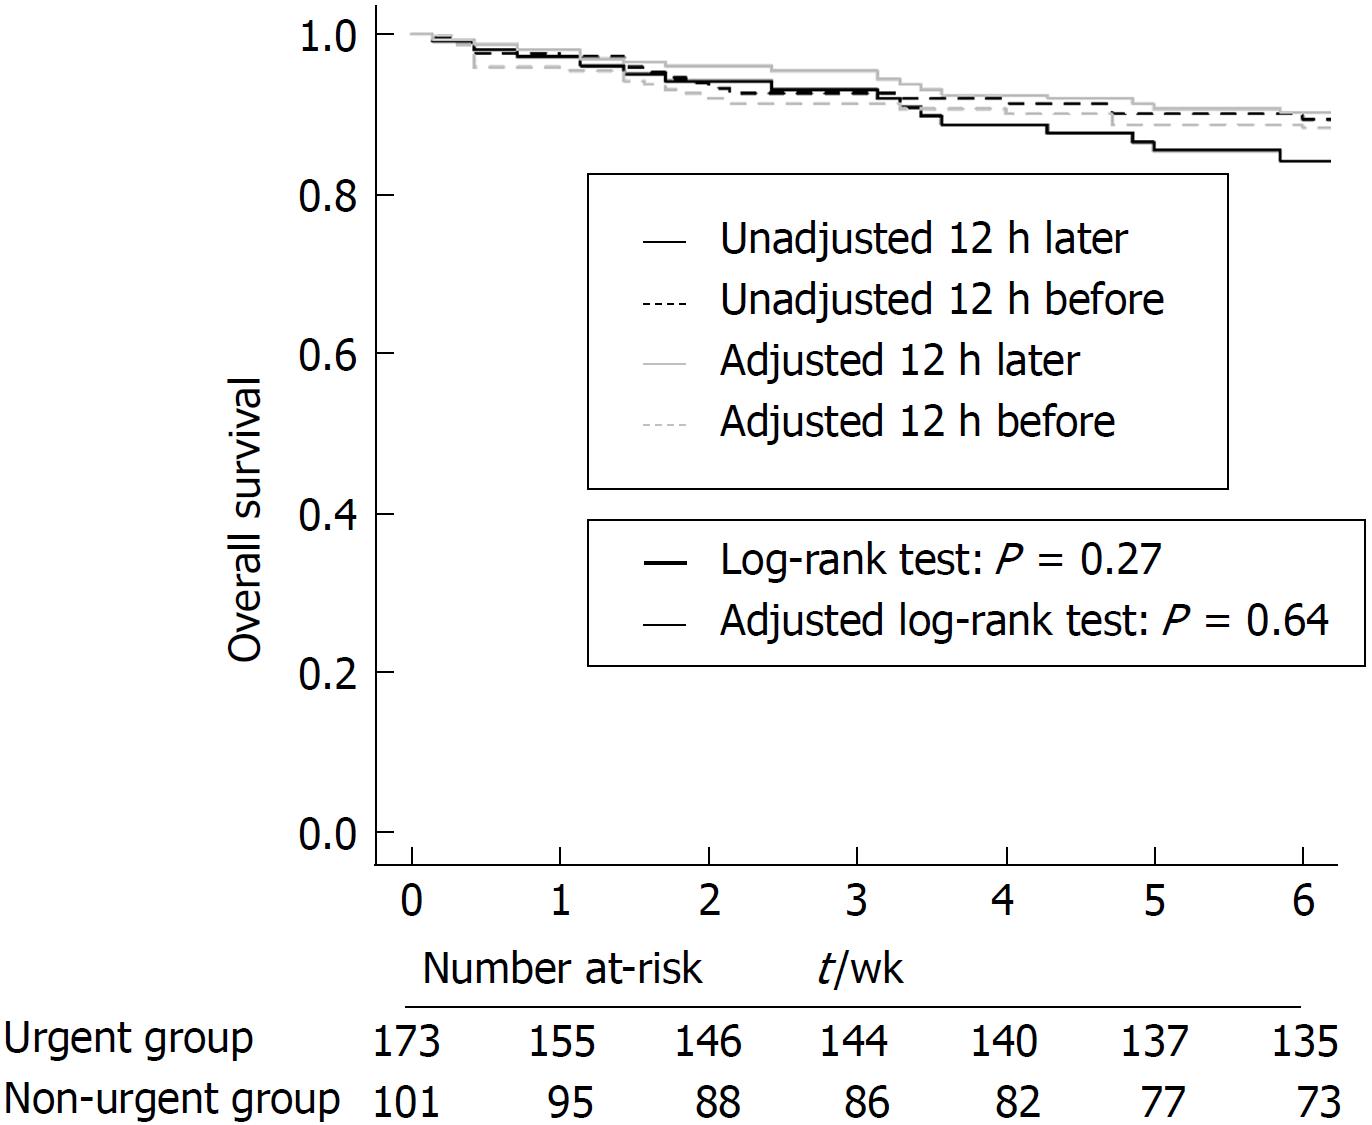
Figure 1 Comparison of 6-wk survival in the urgent and the non-urgent endoscopy groups.
Kaplan-Meier survival plot stratified by timing of endoscopy of all patients. The dotted line indicates urgent endoscopy and the solid line indicates non-urgent endoscopy. The black line is the unadjusted cumulative survival graph before inverse probability weighting (IPW), and the gray line is the adjusted after the IPW correction.
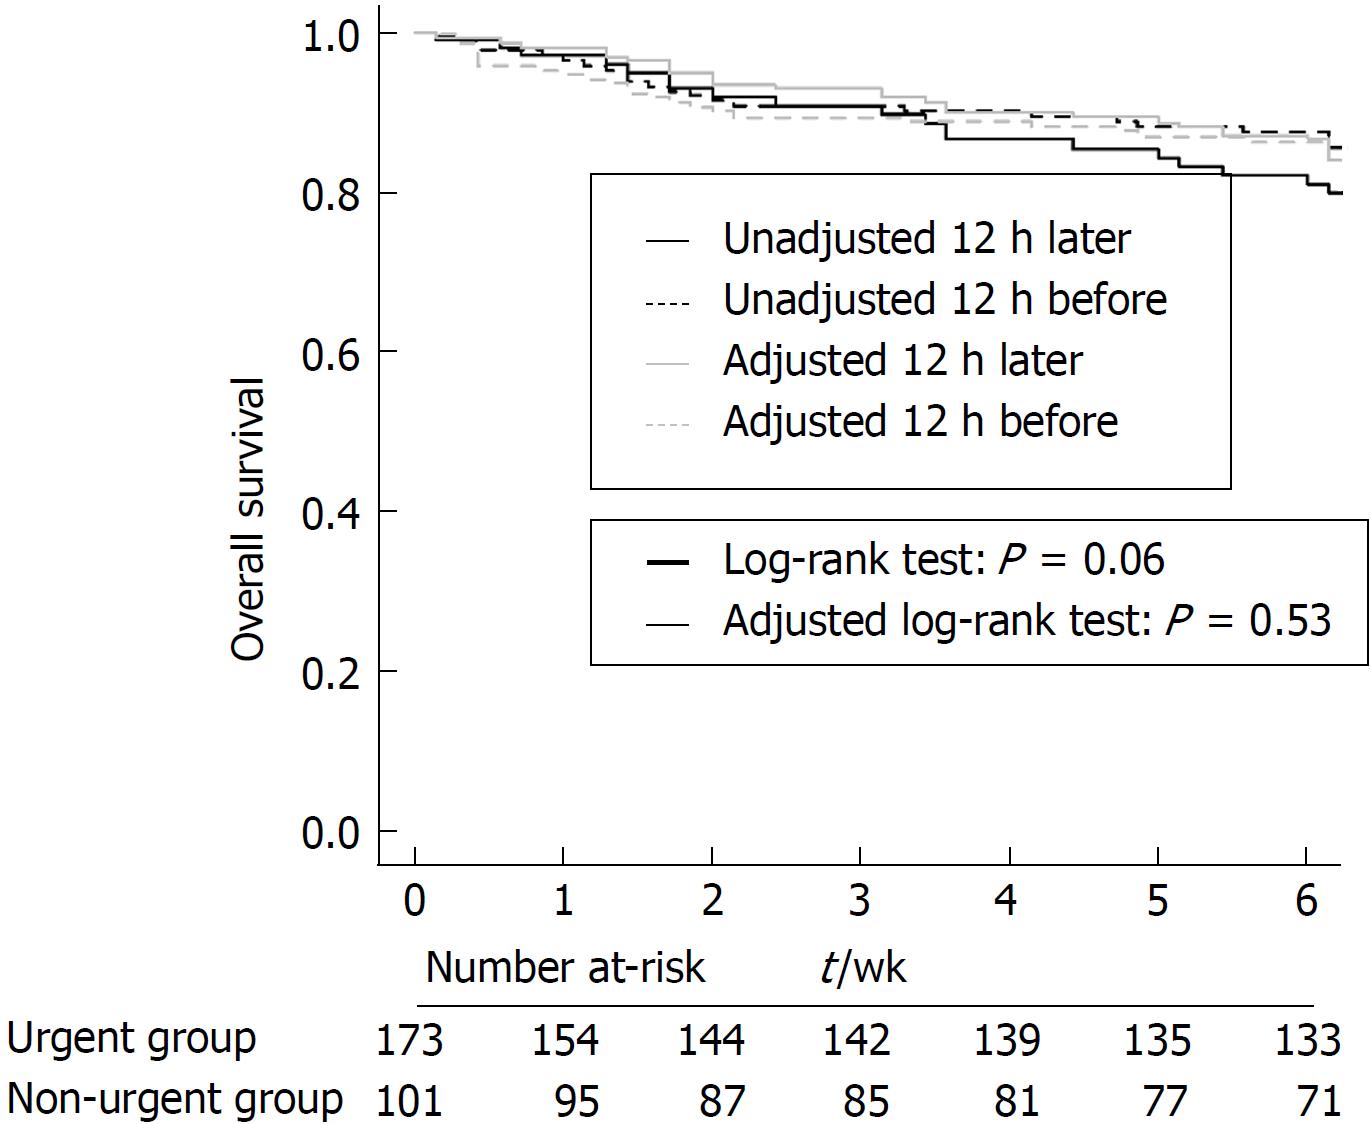
Figure 2 Comparison of 6-wk transplant-free survival in the urgent and the non-urgent endoscopy groups.
Kaplan-Meier survival plot stratified by timing of endoscopy of all patients. The dotted line indicates urgent endoscopy and the solid line indicates non-urgent endoscopy. The black line is the unadjusted cumulative graph before inverse probability weighting (IPW), and the gray line is the adjusted after the IPW correction.
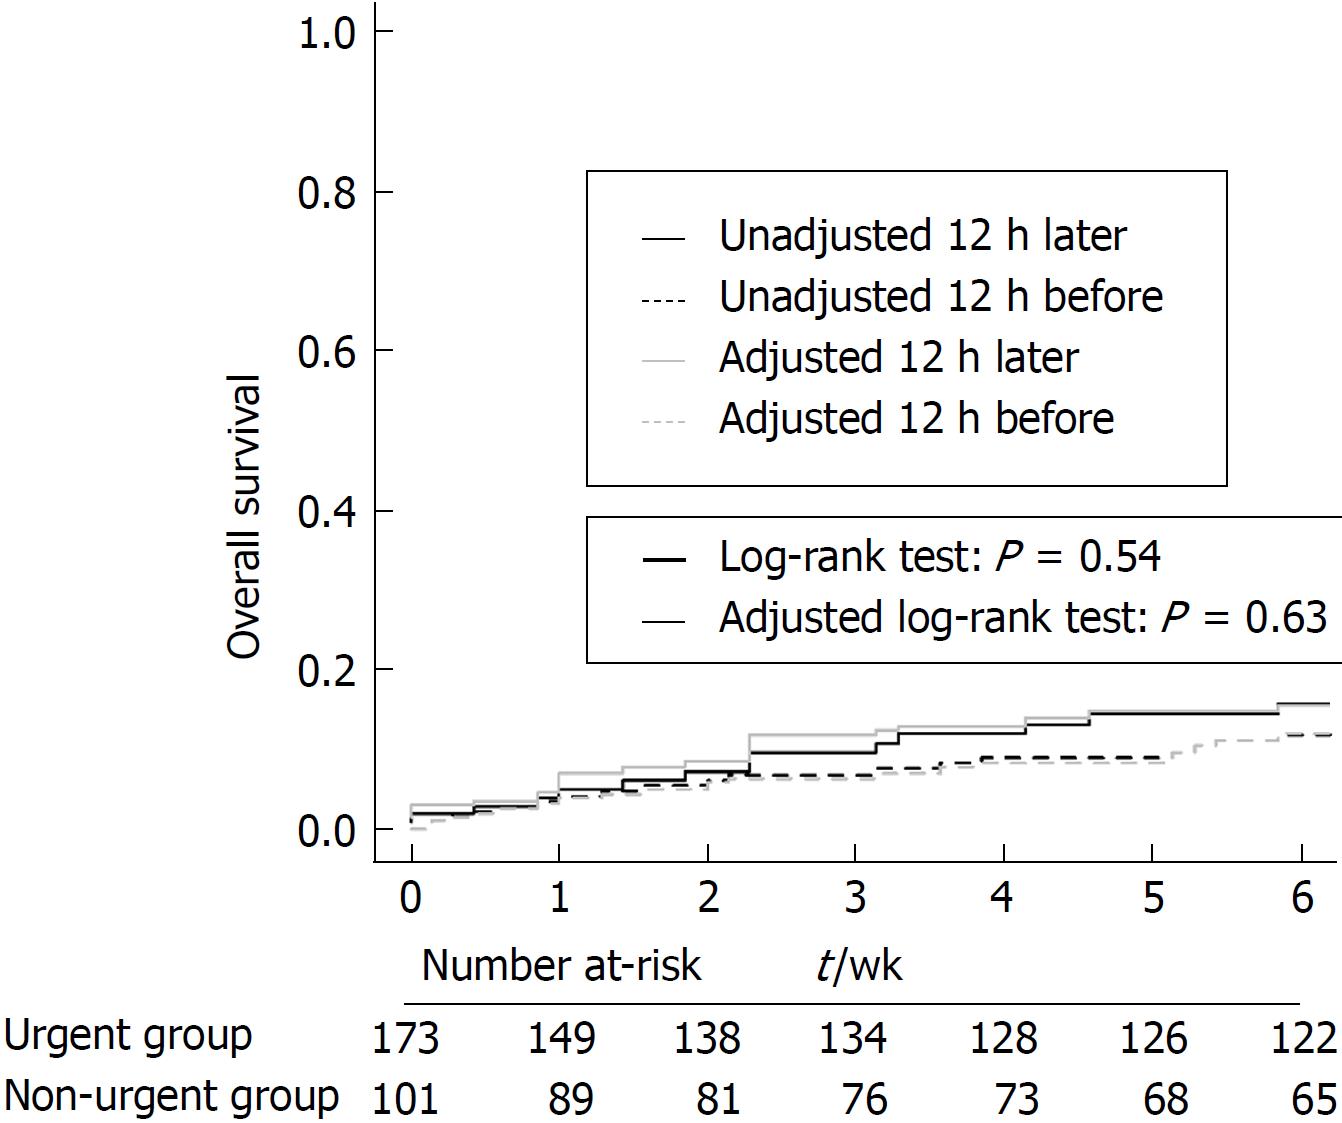
Figure 3 Comparison of 6-wk re-bleeding rate in the urgent and the non-urgent endoscopy groups.
Kaplan-Meier survival plot stratified by timing of endoscopy of all patients. The dotted line indicates urgent endoscopy and the solid line indicates non-urgent endoscopy. The black line is the unadjusted cumulative graph before inverse probability weighting (IPW), and the gray line is the adjusted after the IPW correction.
- Citation: Yoo JJ, Chang Y, Cho EJ, Moon JE, Kim SG, Kim YS, Lee YB, Lee JH, Yu SJ, Kim YJ, Yoon JH. Timing of upper gastrointestinal endoscopy does not influence short-term outcomes in patients with acute variceal bleeding. World J Gastroenterol 2018; 24(44): 5025-5033
- URL: https://www.wjgnet.com/1007-9327/full/v24/i44/5025.htm
- DOI: https://dx.doi.org/10.3748/wjg.v24.i44.5025


