Copyright
©The Author(s) 2018.
World J Gastroenterol. Nov 21, 2018; 24(43): 4920-4927
Published online Nov 21, 2018. doi: 10.3748/wjg.v24.i43.4920
Published online Nov 21, 2018. doi: 10.3748/wjg.v24.i43.4920
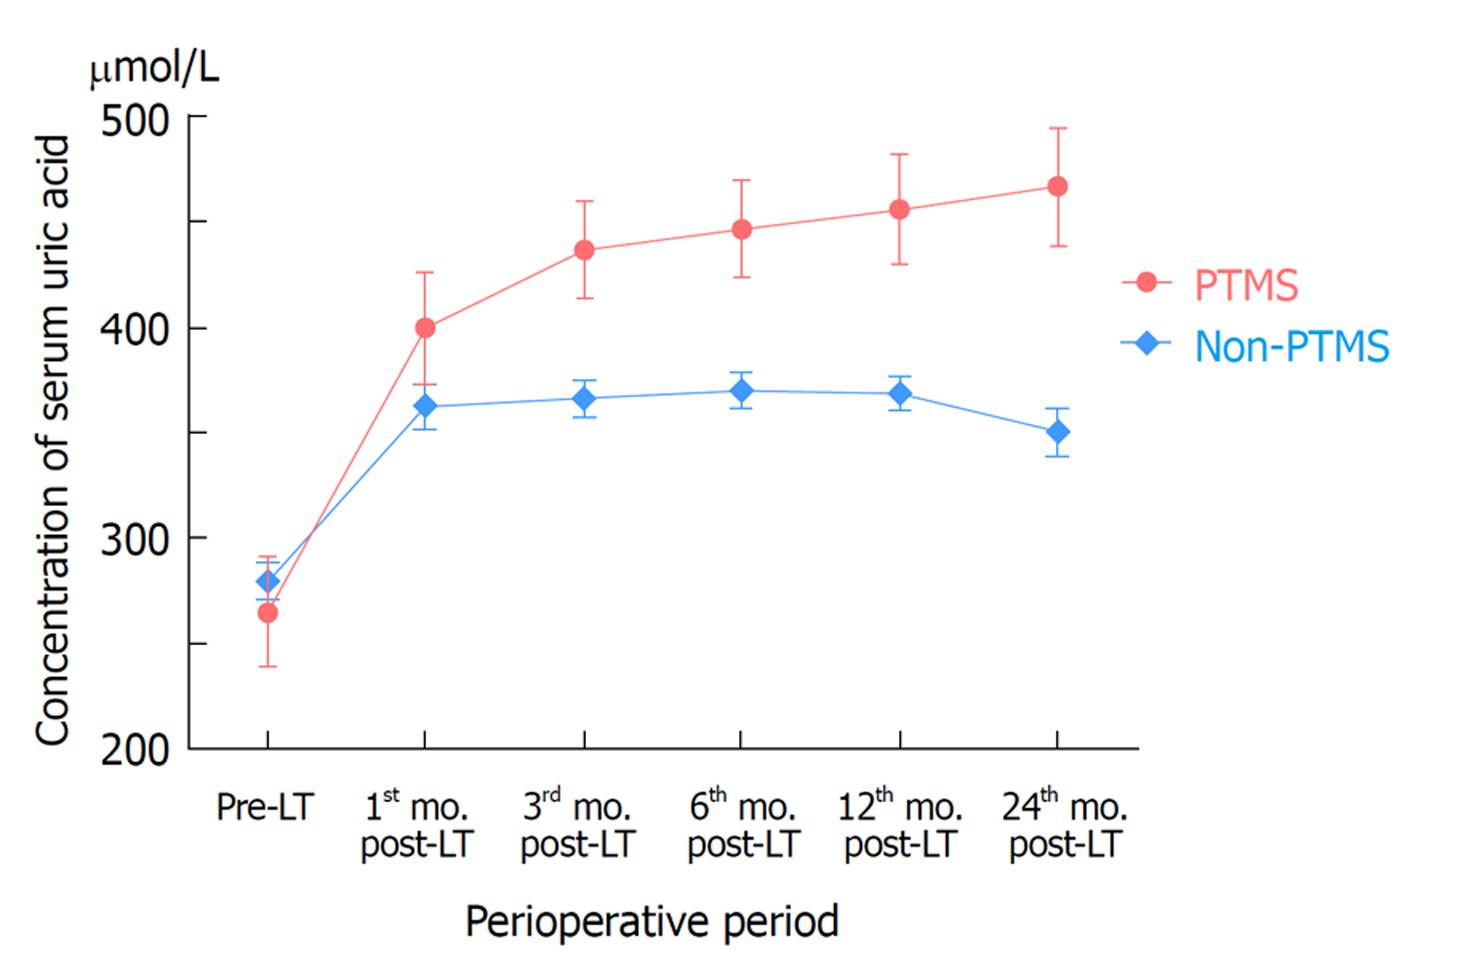
Figure 1 Posttransplant levels of serum uric acid in patients with and without posttransplant metabolic syndrome.
The red folding line reflects the serum uric acid level change of patients who did develop posttransplant metabolic syndrome (PTMS) [data are presented as mean ± standard error of mean (SEM), and n = 20], and the azure folding line reflects the situation of patients without PTMS (data are presented as mean ± SEM, and n = 127). The abscissa in the figure indicates the period from pre-liver transplantation to post-liver transplantation 24th mo. PTMS: Posttransplant metabolic syndrome; Post-LT: Post-liver transplantation.
- Citation: Hu LS, Chai YC, Zheng J, Shi JH, Zhang C, Tian M, Lv Y, Wang B, Jia A. Warm ischemia time and elevated serum uric acid are associated with metabolic syndrome after liver transplantation with donation after cardiac death. World J Gastroenterol 2018; 24(43): 4920-4927
- URL: https://www.wjgnet.com/1007-9327/full/v24/i43/4920.htm
- DOI: https://dx.doi.org/10.3748/wjg.v24.i43.4920


