Copyright
©The Author(s) 2018.
World J Gastroenterol. Nov 7, 2018; 24(41): 4679-4690
Published online Nov 7, 2018. doi: 10.3748/wjg.v24.i41.4679
Published online Nov 7, 2018. doi: 10.3748/wjg.v24.i41.4679
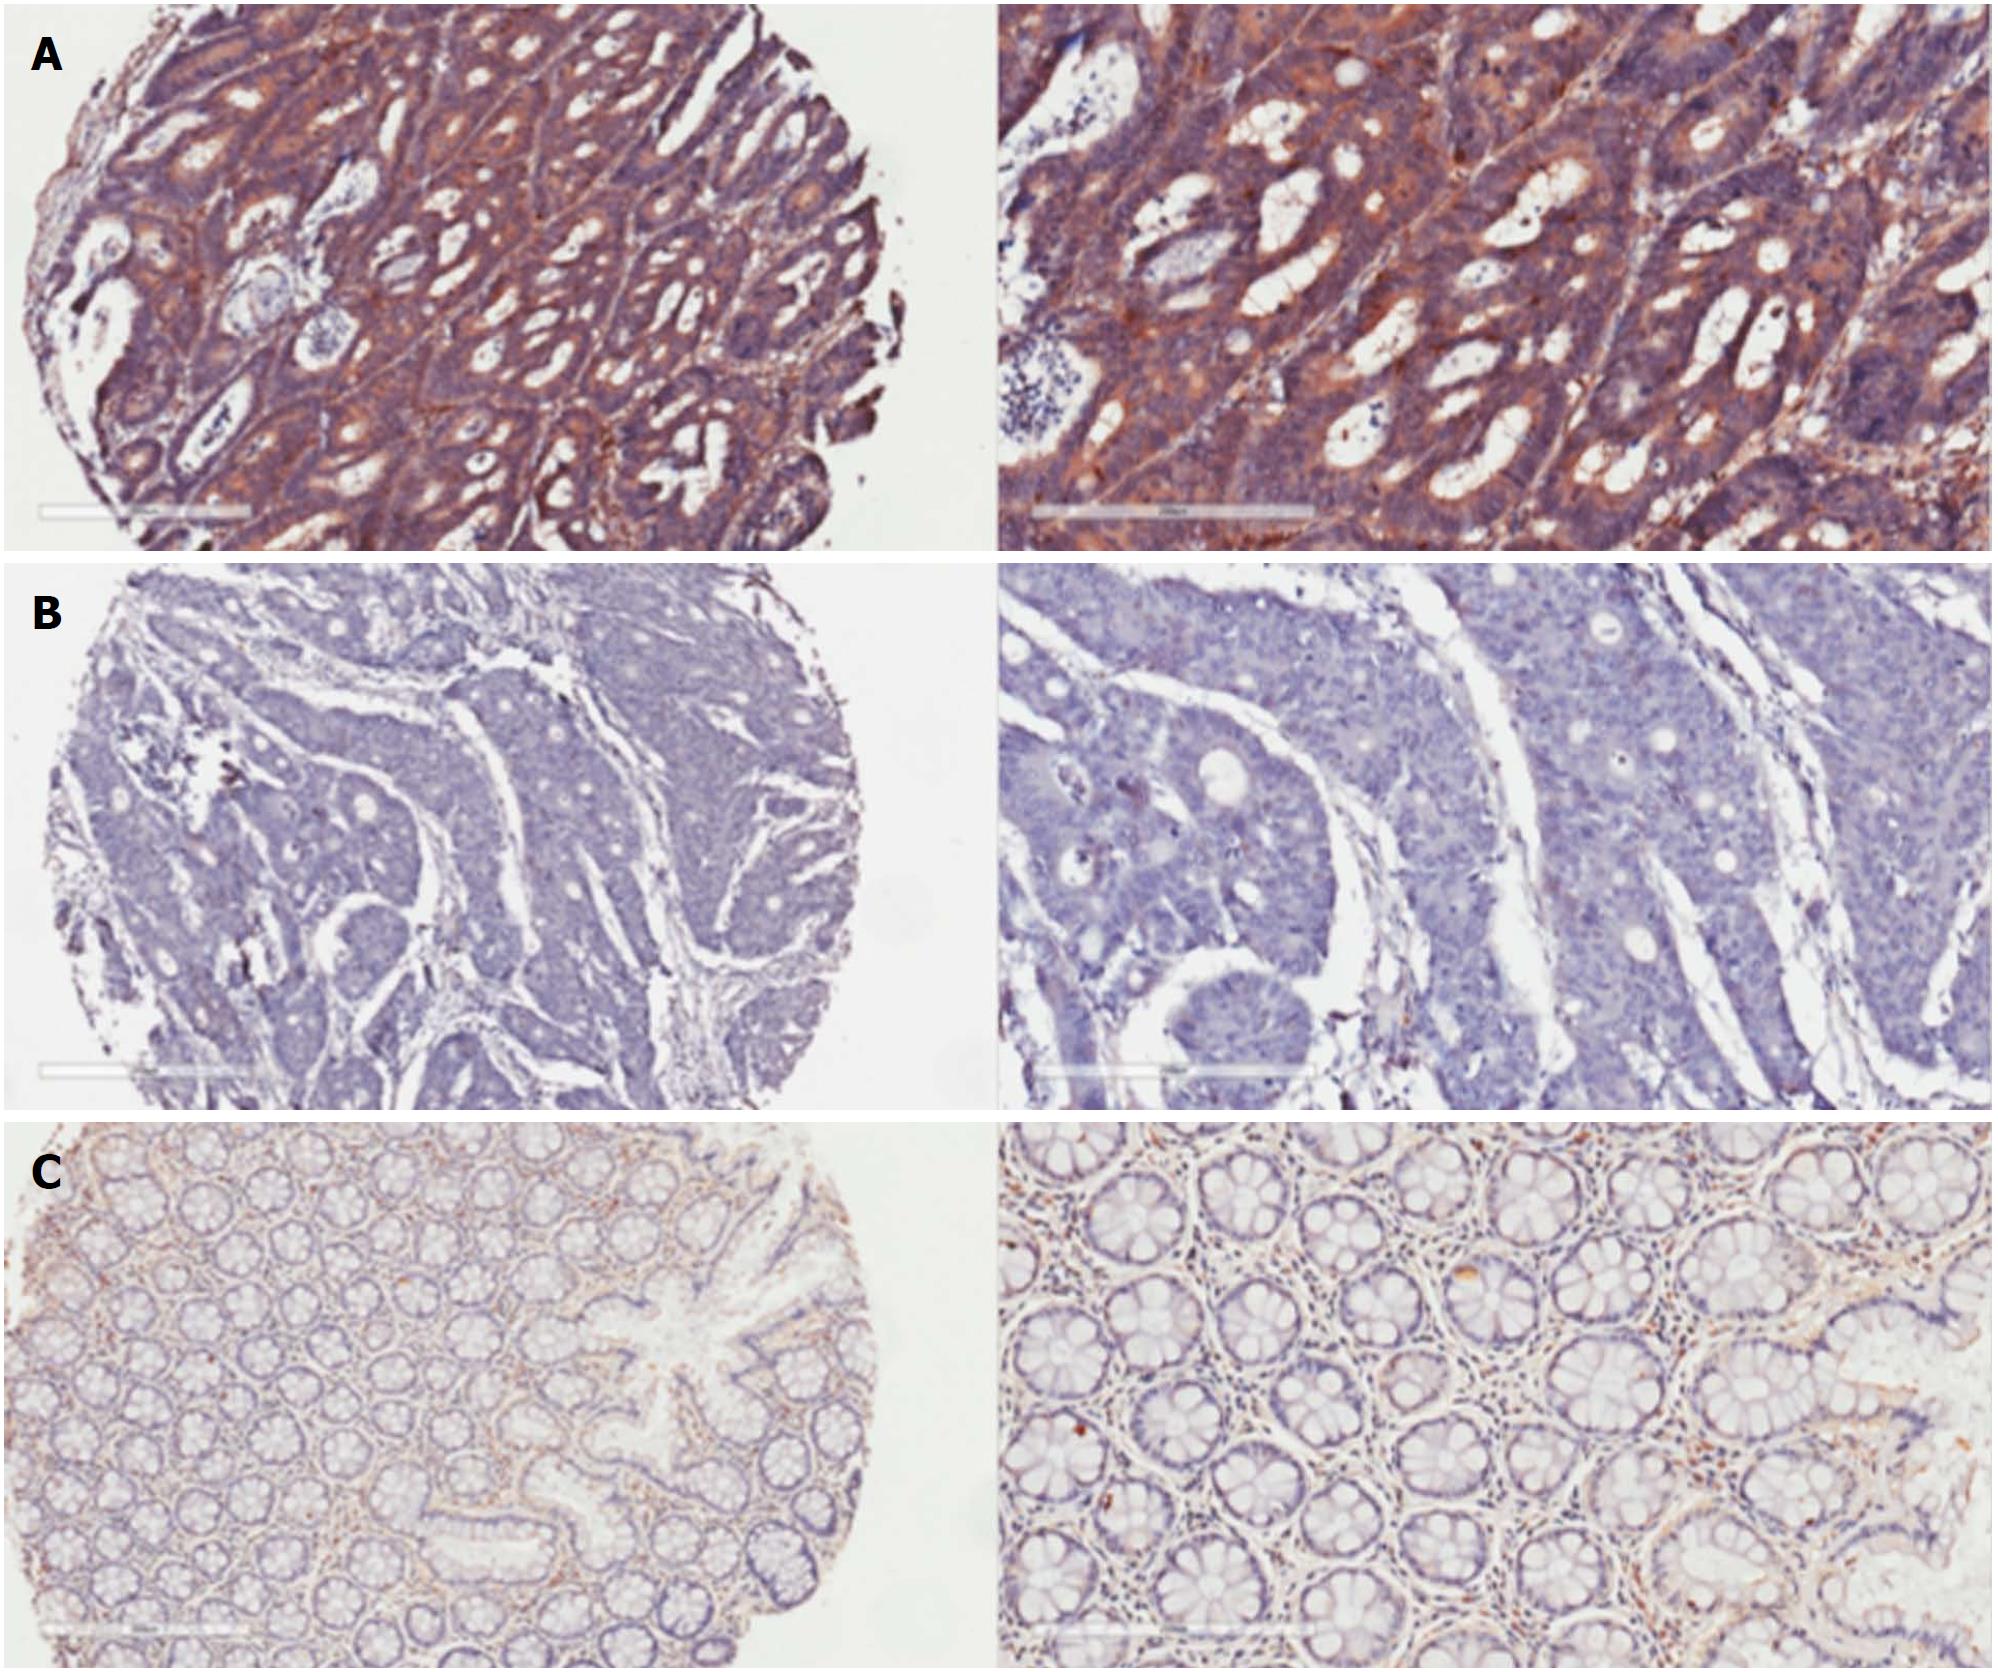
Figure 1 Immunohistochemistry staining of representative high- and low-G protein-coupled receptor 31-expressing samples of colorectal cancer and adjacent normal colorectal mucosa.
A: High G protein-coupled receptor 31 (GPR31) expression in colorectal cancer (CRC) tissue. The intensity was assigned a score of 3; B: Low GPR31 expression in CRC tissue. The intensity was assigned a score of 2; C: The corresponding adjacent mucosal tissue stains negative for GPR31 expression. GPR31: G protein-coupled receptor 31; CRC: colorectal cancer.
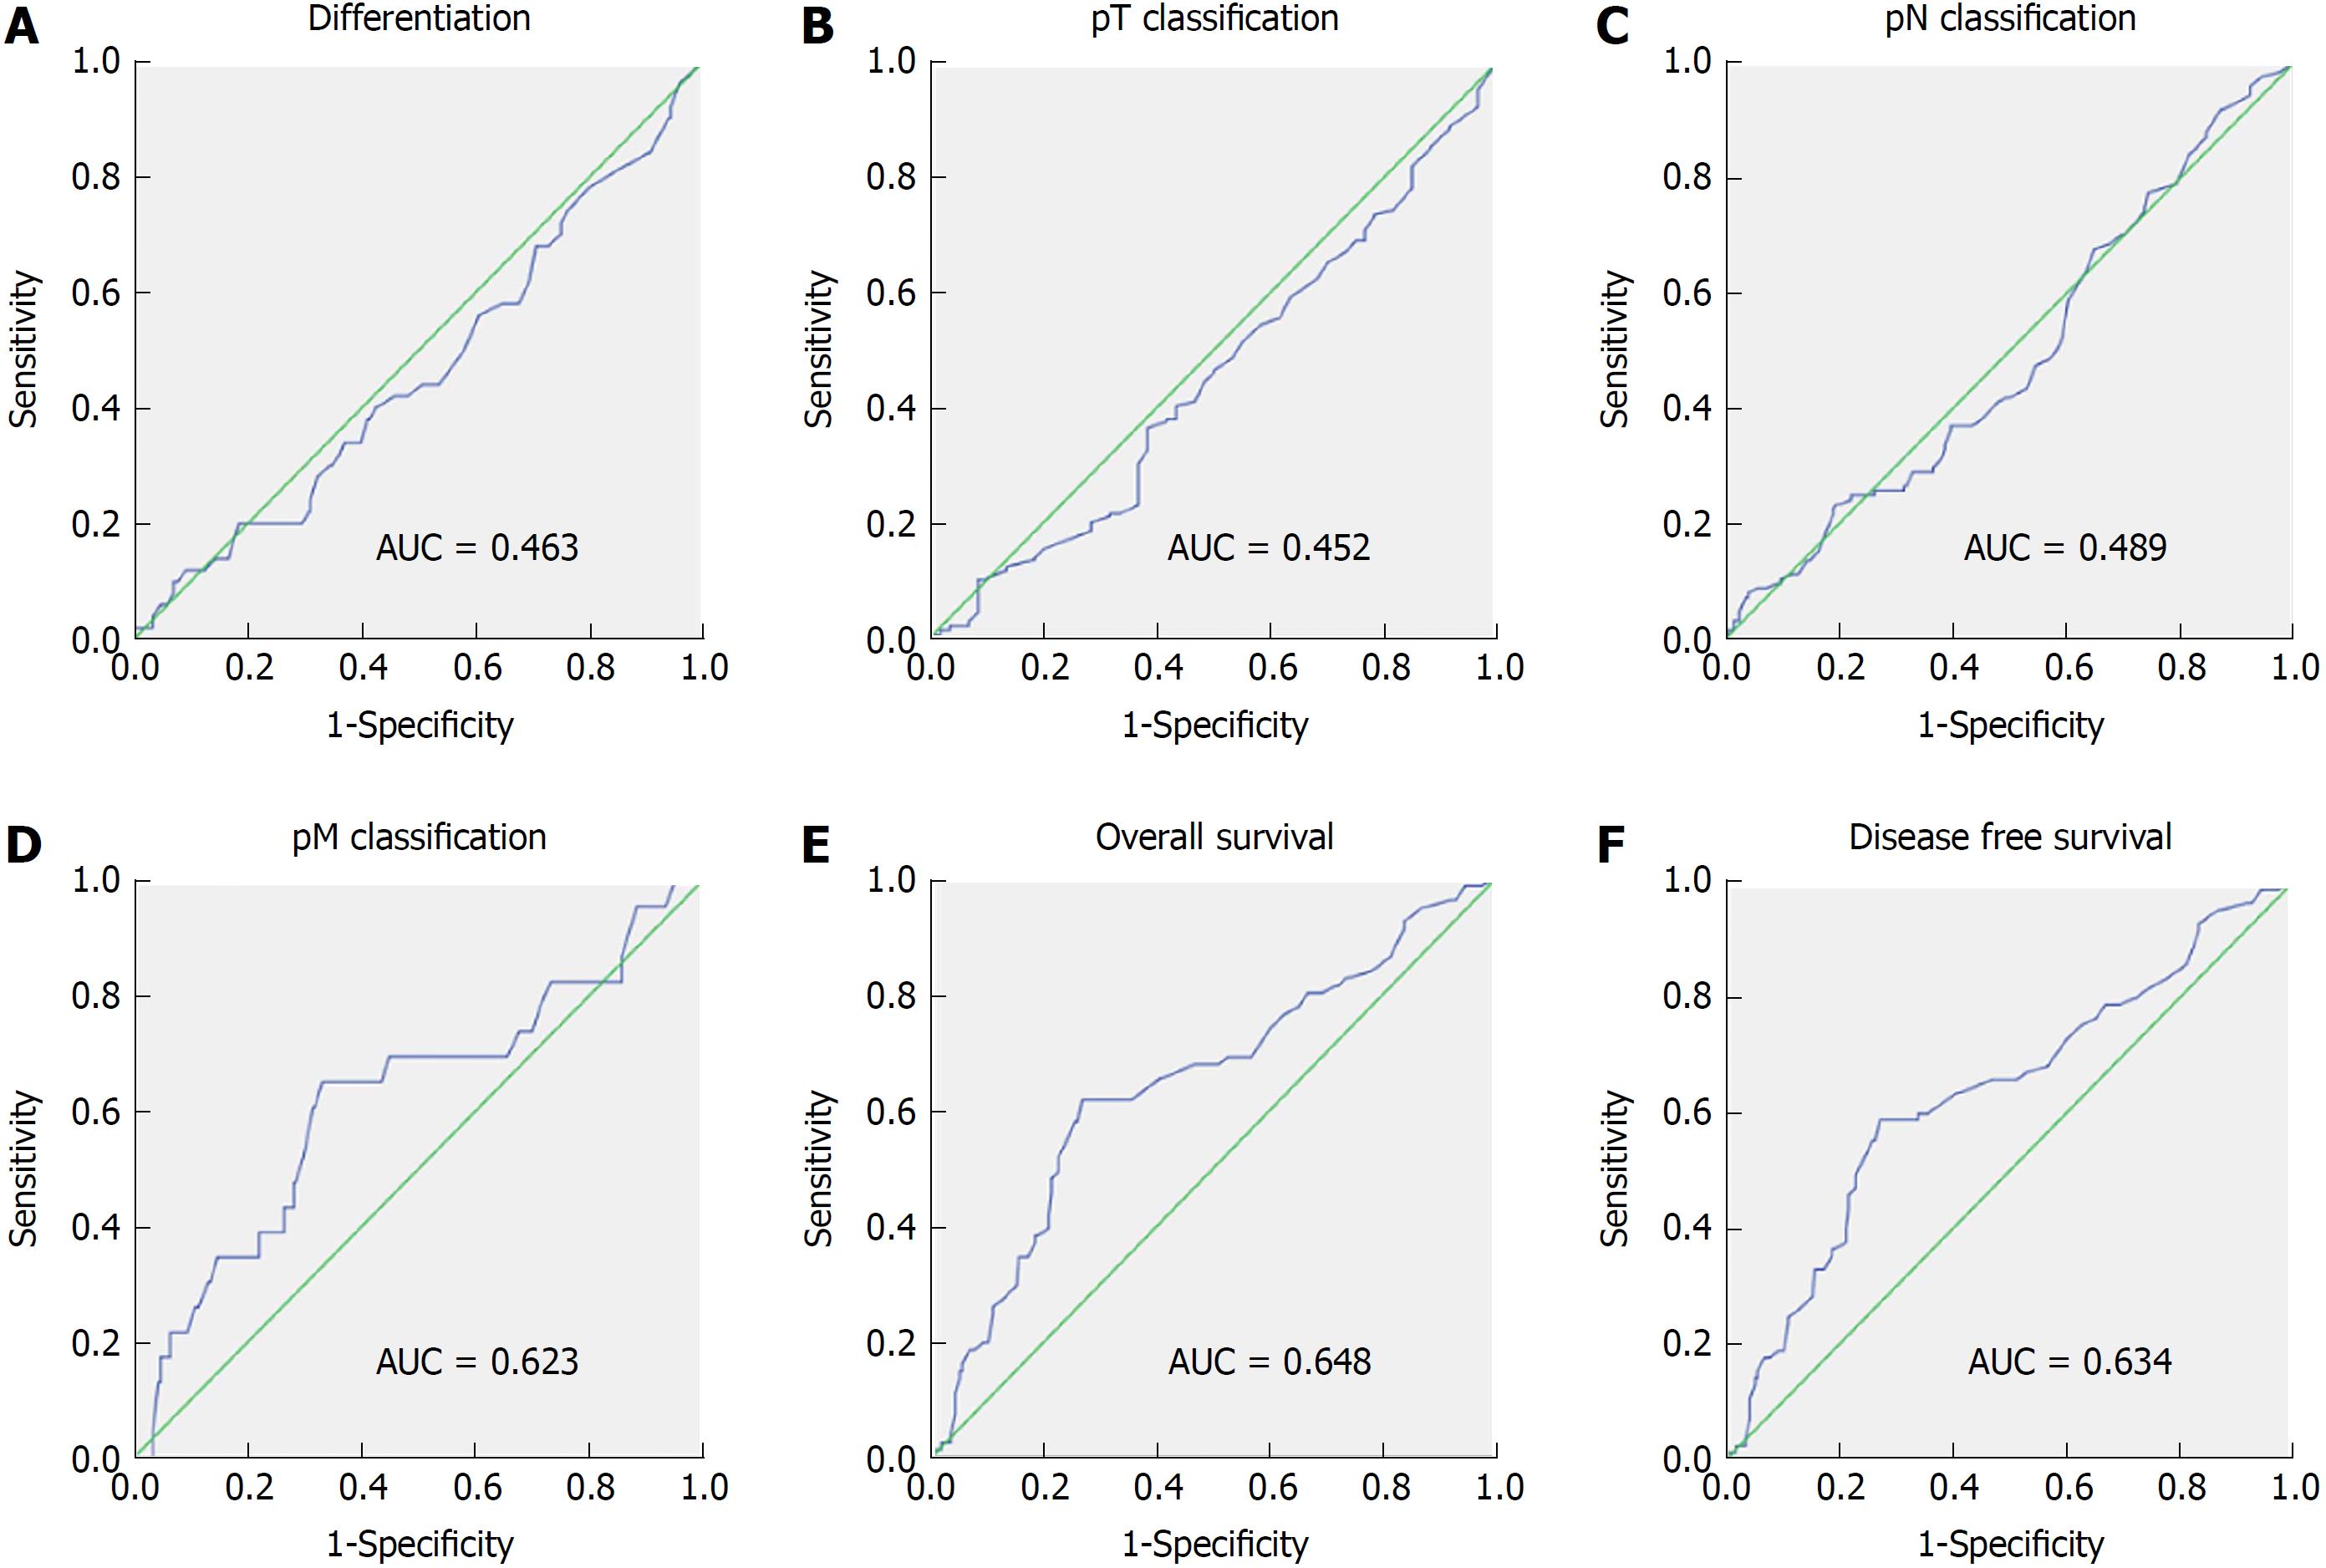
Figure 2 Receiver operating characteristic curve analysis used to determine the cutoff value for G protein-coupled receptor 31 expression levels in colorectal carcinoma.
The following sensitivity and specificity parameters for each outcome were plotted. A: Differentiation (AUC = 0.463); B: pT status (AUC = 0.452); C: pN status (AUC = 0.489); D: pM status (AUC = 0.623); E: Overall survival (AUC = 0.648); F: Disease-free survival (AUC = 0.634). AUC: Area under curve.
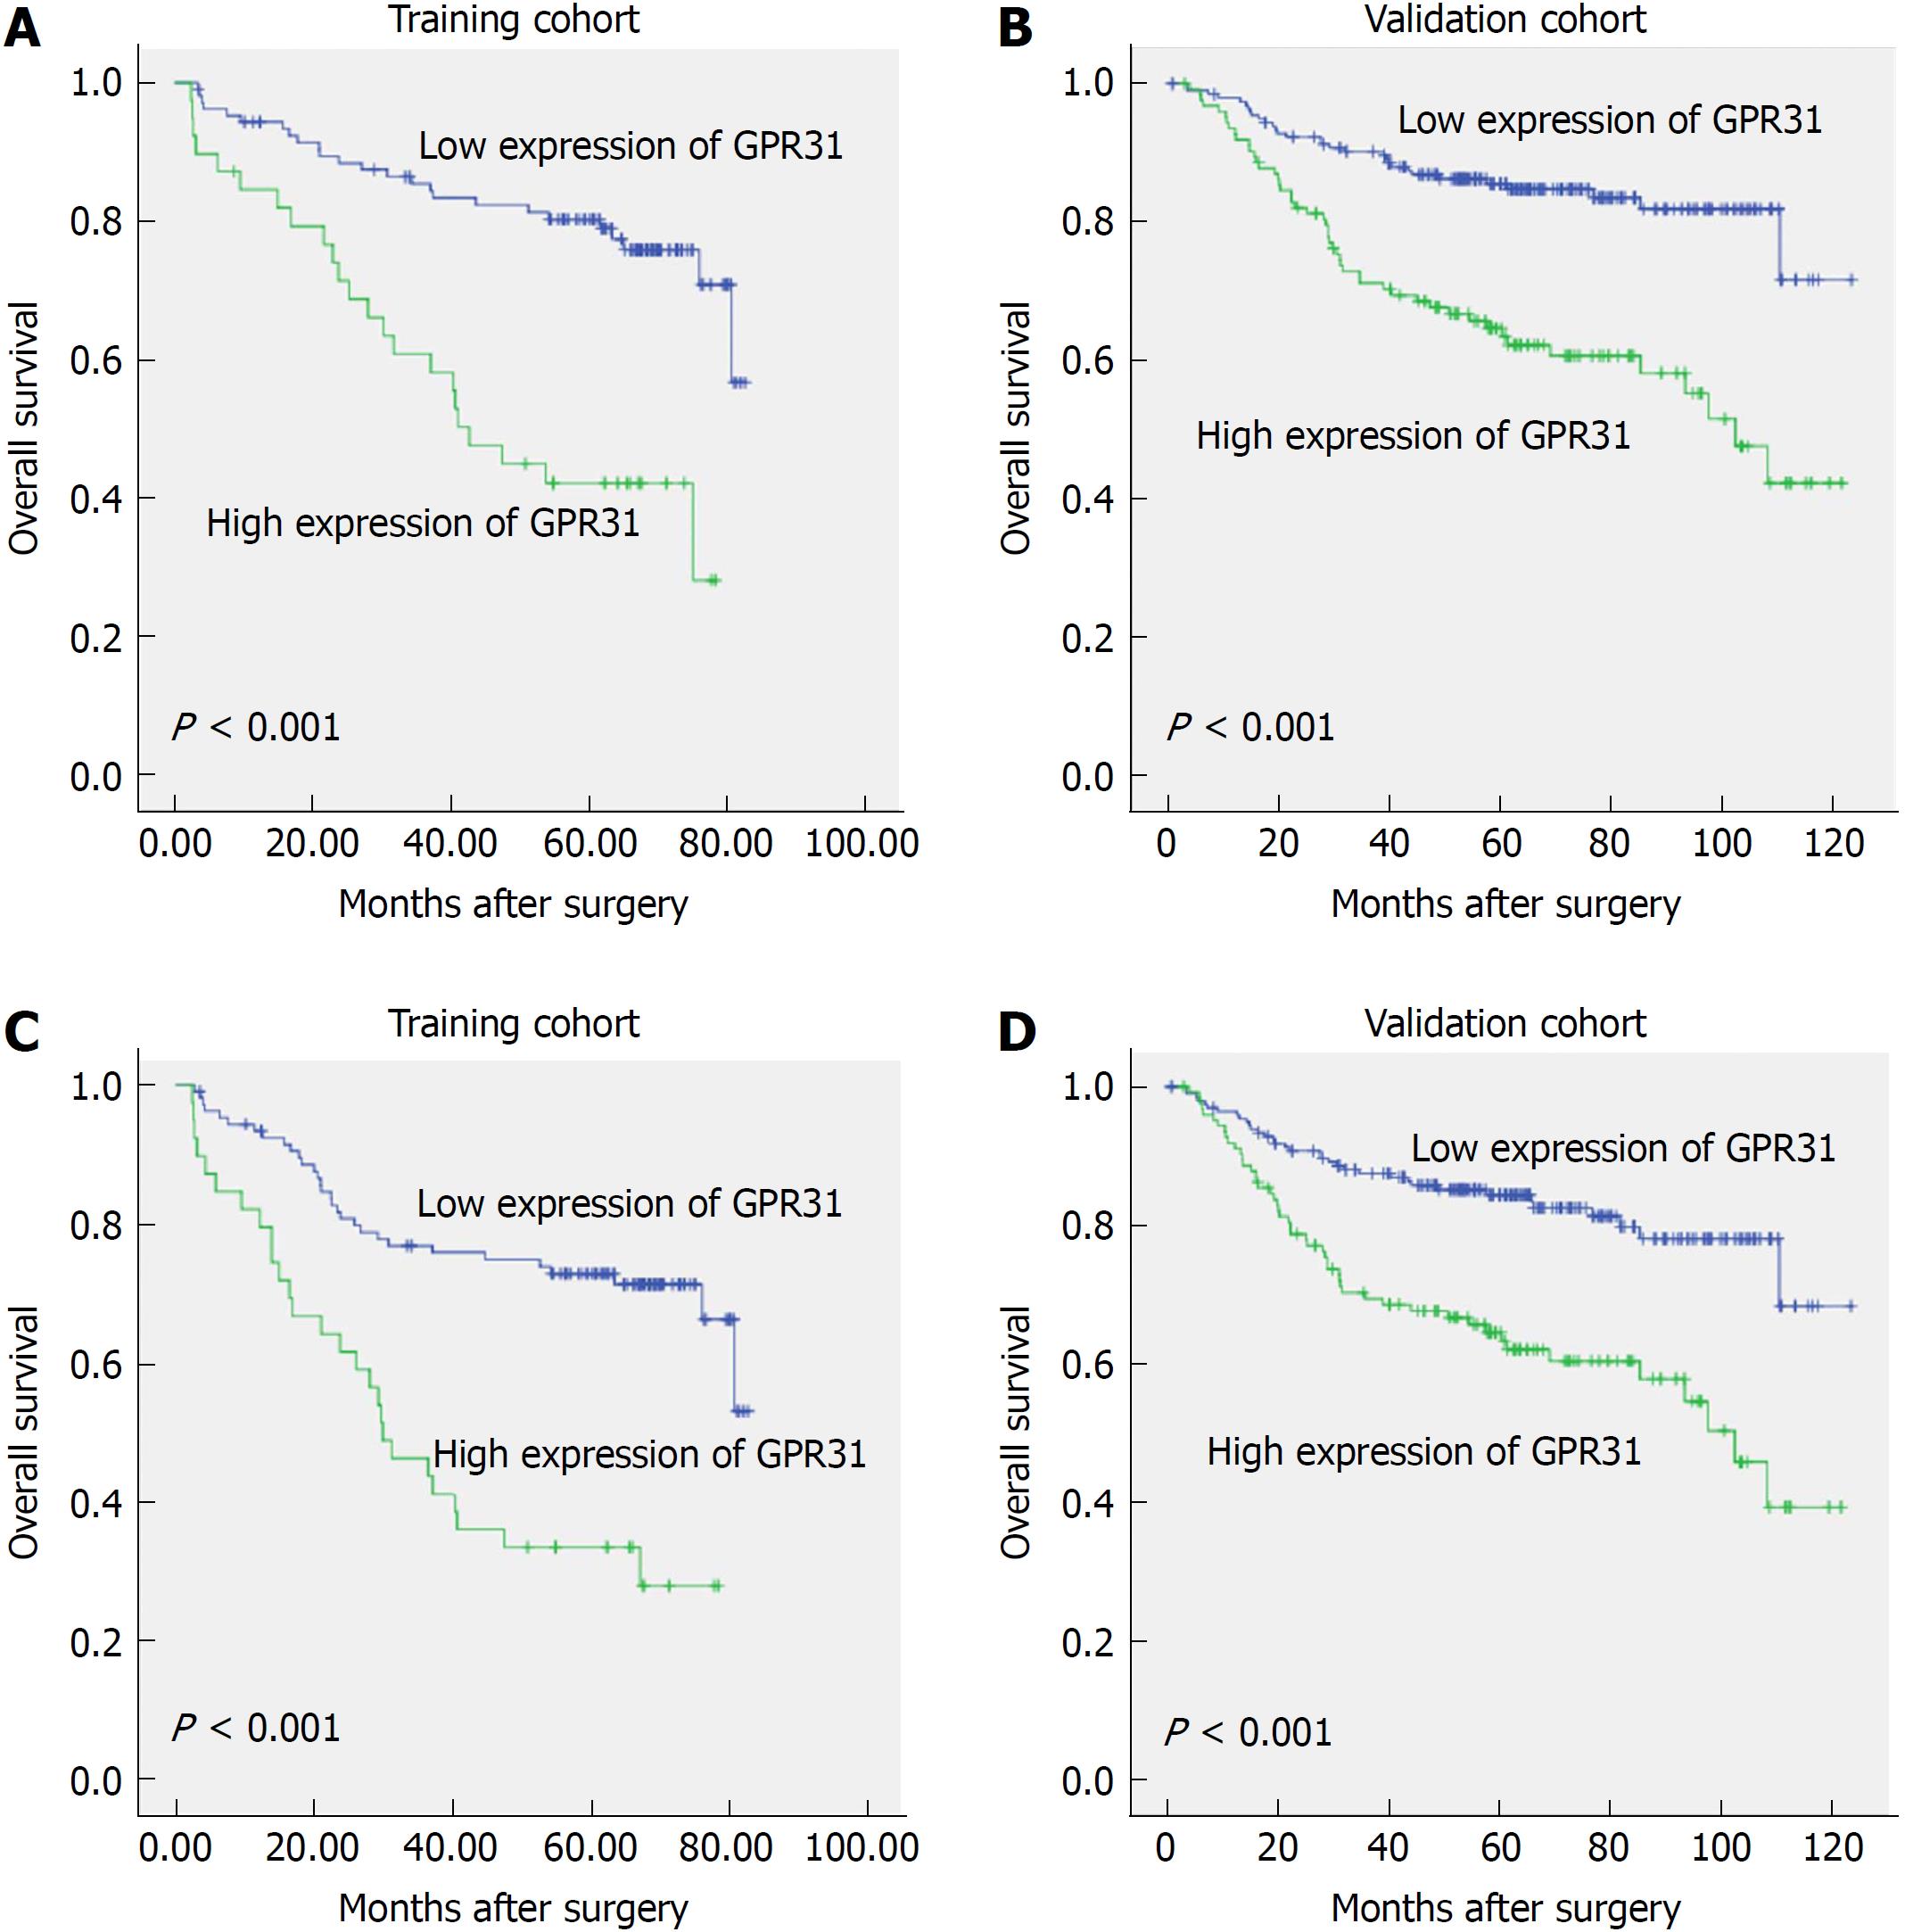
Figure 3 Survival curves for the training and validation cohorts according to G protein-coupled receptor 31 expression (log-rank test).
A: Overall survival of the training cohorts: Low G protein-coupled receptor 31 (GPR31) expression, n = 197; high GPR31 expression, n = 124 (P < 0.001); B: Overall survival of the validation cohort: low GPR31 expression, n = 106; high GPR31 expression, n = 39 (P < 0.001); C: Disease-free survival of the training cohorts (P < 0.001); D: Disease-free survival of the validation cohorts (P < 0.001). GPR31: G protein-coupled receptor 31.
- Citation: Rong YM, Huang XM, Fan DJ, Lin XT, Zhang F, Hu JC, Tan YX, Chen X, Zou YF, Lan P. Overexpression of G protein-coupled receptor 31 as a poor prognosticator in human colorectal cancer. World J Gastroenterol 2018; 24(41): 4679-4690
- URL: https://www.wjgnet.com/1007-9327/full/v24/i41/4679.htm
- DOI: https://dx.doi.org/10.3748/wjg.v24.i41.4679


