Copyright
©The Author(s) 2018.
World J Gastroenterol. Oct 14, 2018; 24(38): 4384-4392
Published online Oct 14, 2018. doi: 10.3748/wjg.v24.i38.4384
Published online Oct 14, 2018. doi: 10.3748/wjg.v24.i38.4384
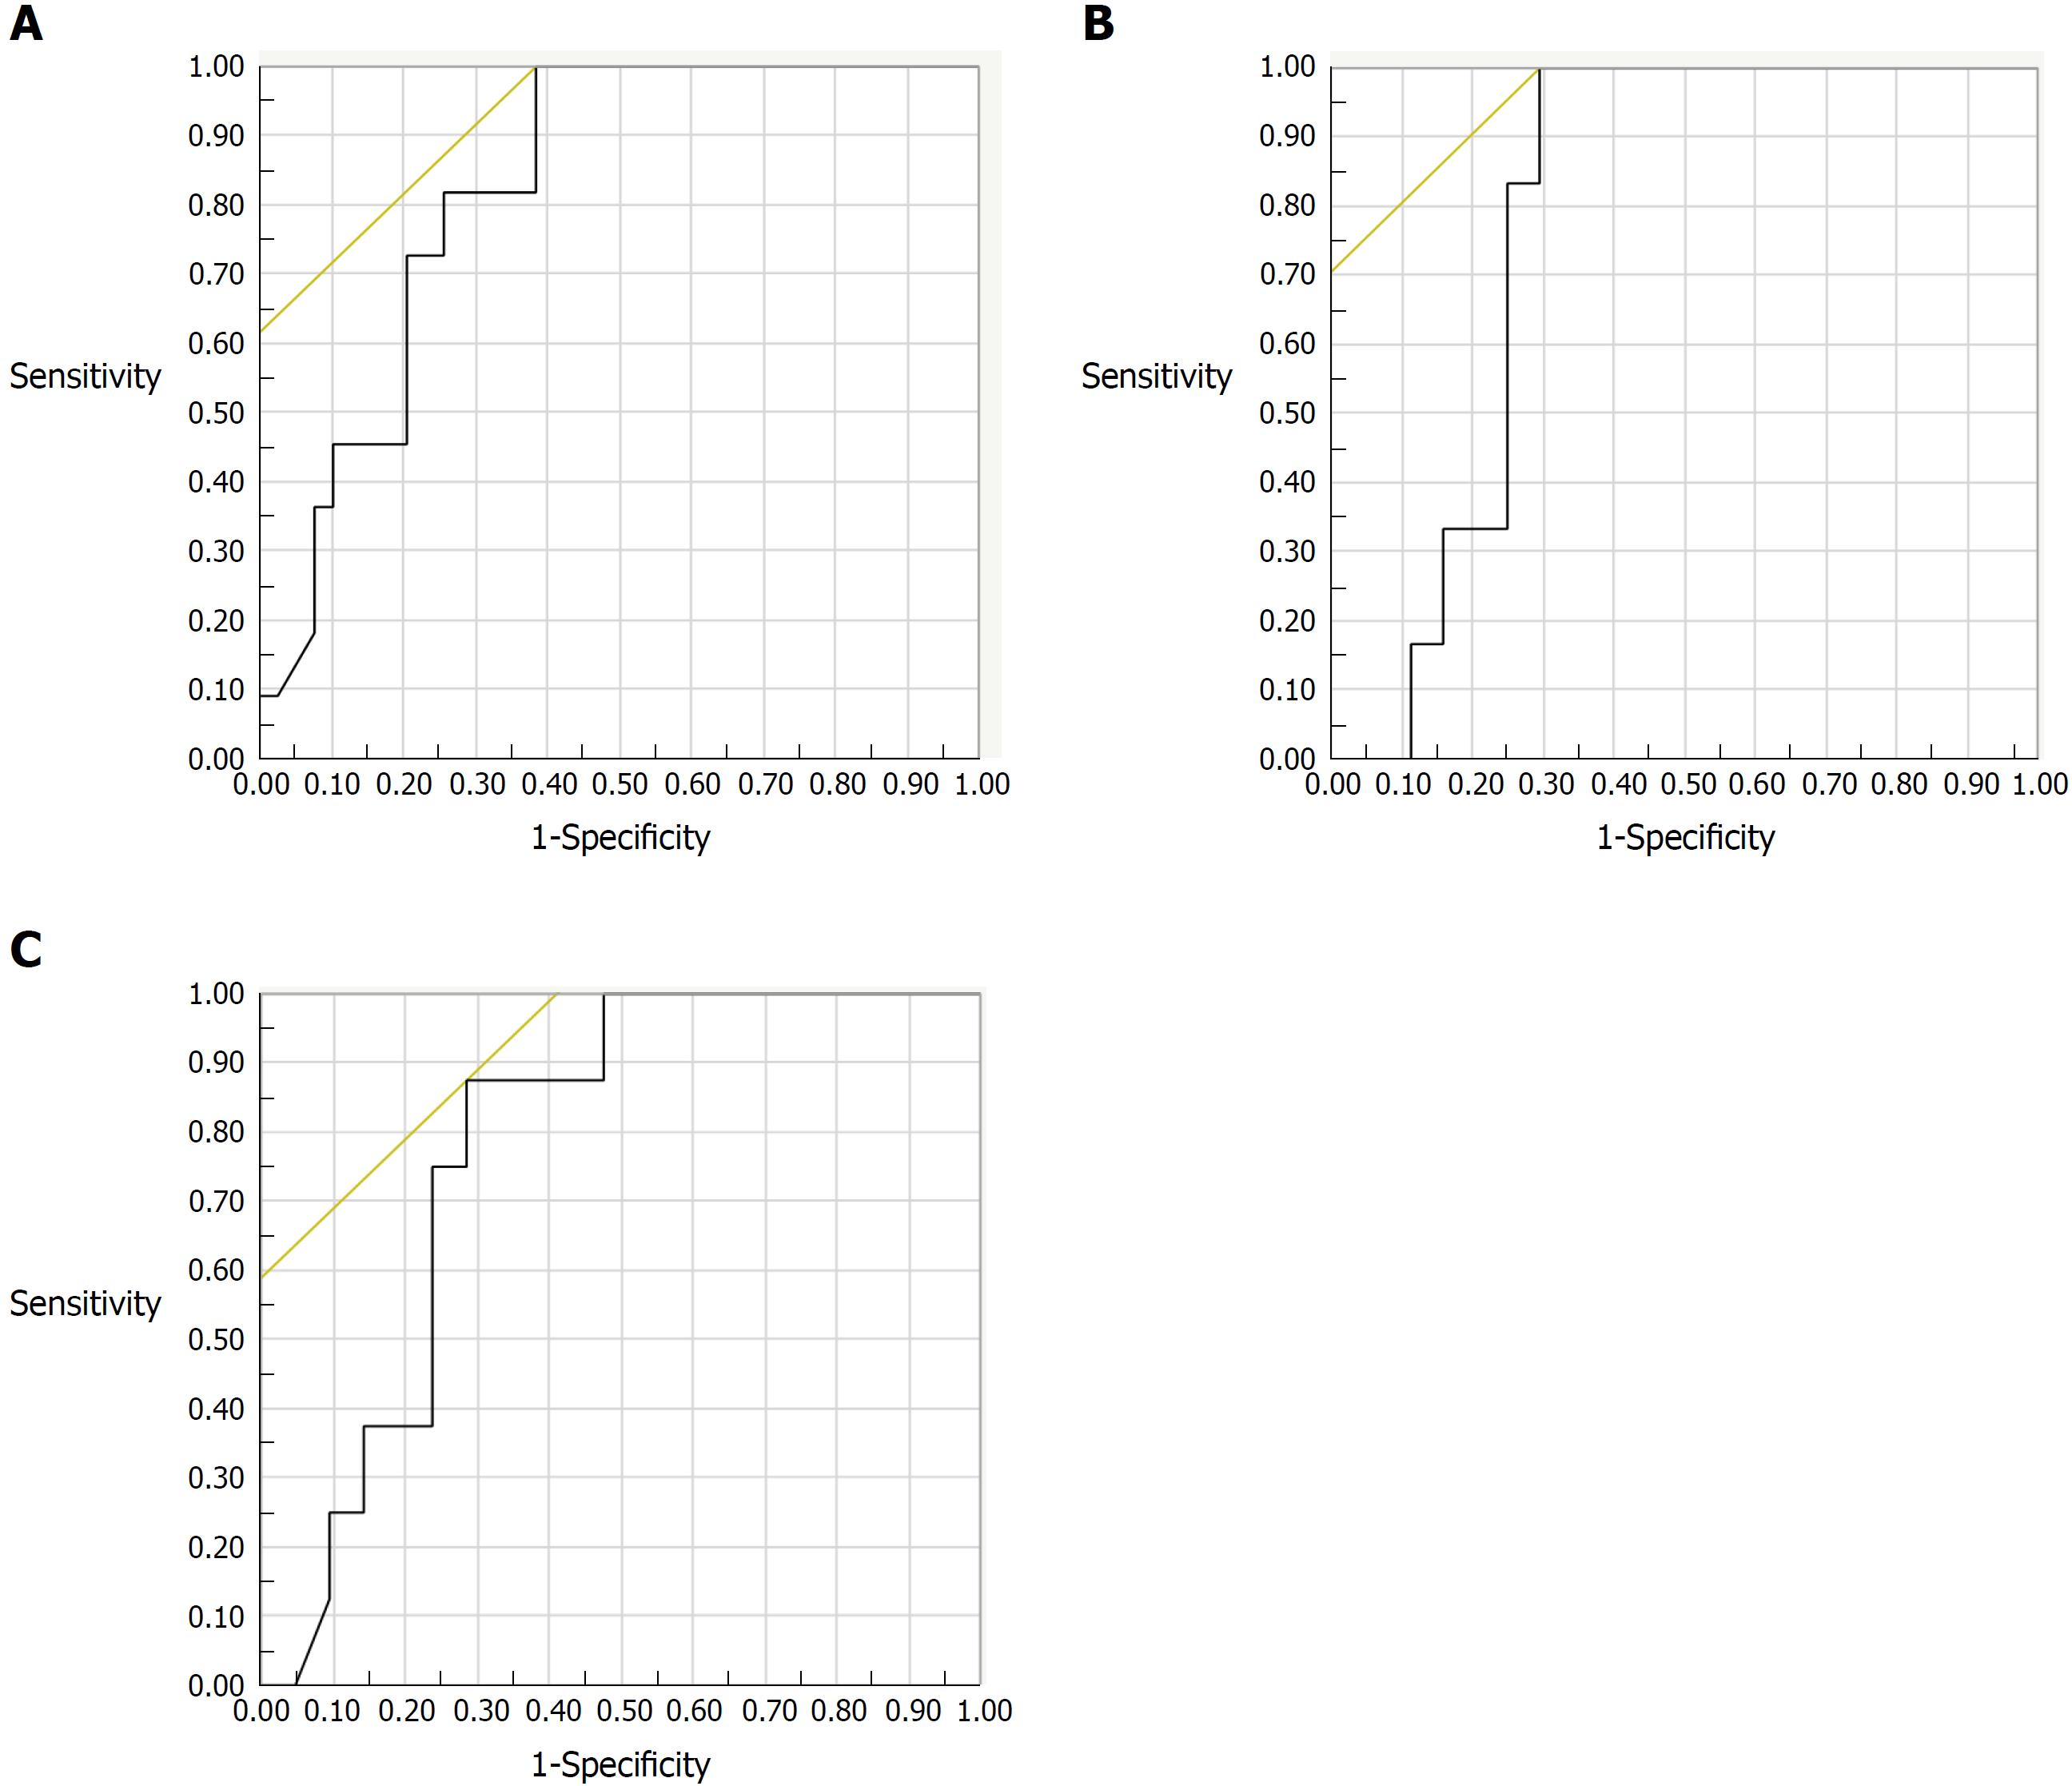
Figure 1 Receiver-operating characteristic curves for fecal calprotectin levels to predict endoscopic remission of ulcerative colitis (n = 50).
A: ROC for FC levels in predicting remission by Mayo endoscopic subscore. The AUC was 0.823, 95%CI: 0.707-0.939. The best cut-off value of FC was 490 μg/g, with a sensitivity of 100% and a specificity of 62%; B: ROC for FC in predicting remission by the Rachmilewitz endoscopic index. The AUC was 0.780, 95%CI: 0.658-0.903. The best cut-off value of FC was 288 μg/g, with a sensitivity of 100% and a specificity of 70%; C: ROC for FC level in predicting remission by the ulcerative colitis endoscopy index of severity. The AUC was 0.777, 95%CI: 0.645-0.909. The best cut-off value of FC was 288 μg/g, with a sensitivity of 88% and a specificity of 71%. ROC: Receiver-operating characteristic; FC: Fecal calprotectin; AUC: Area under the curve.
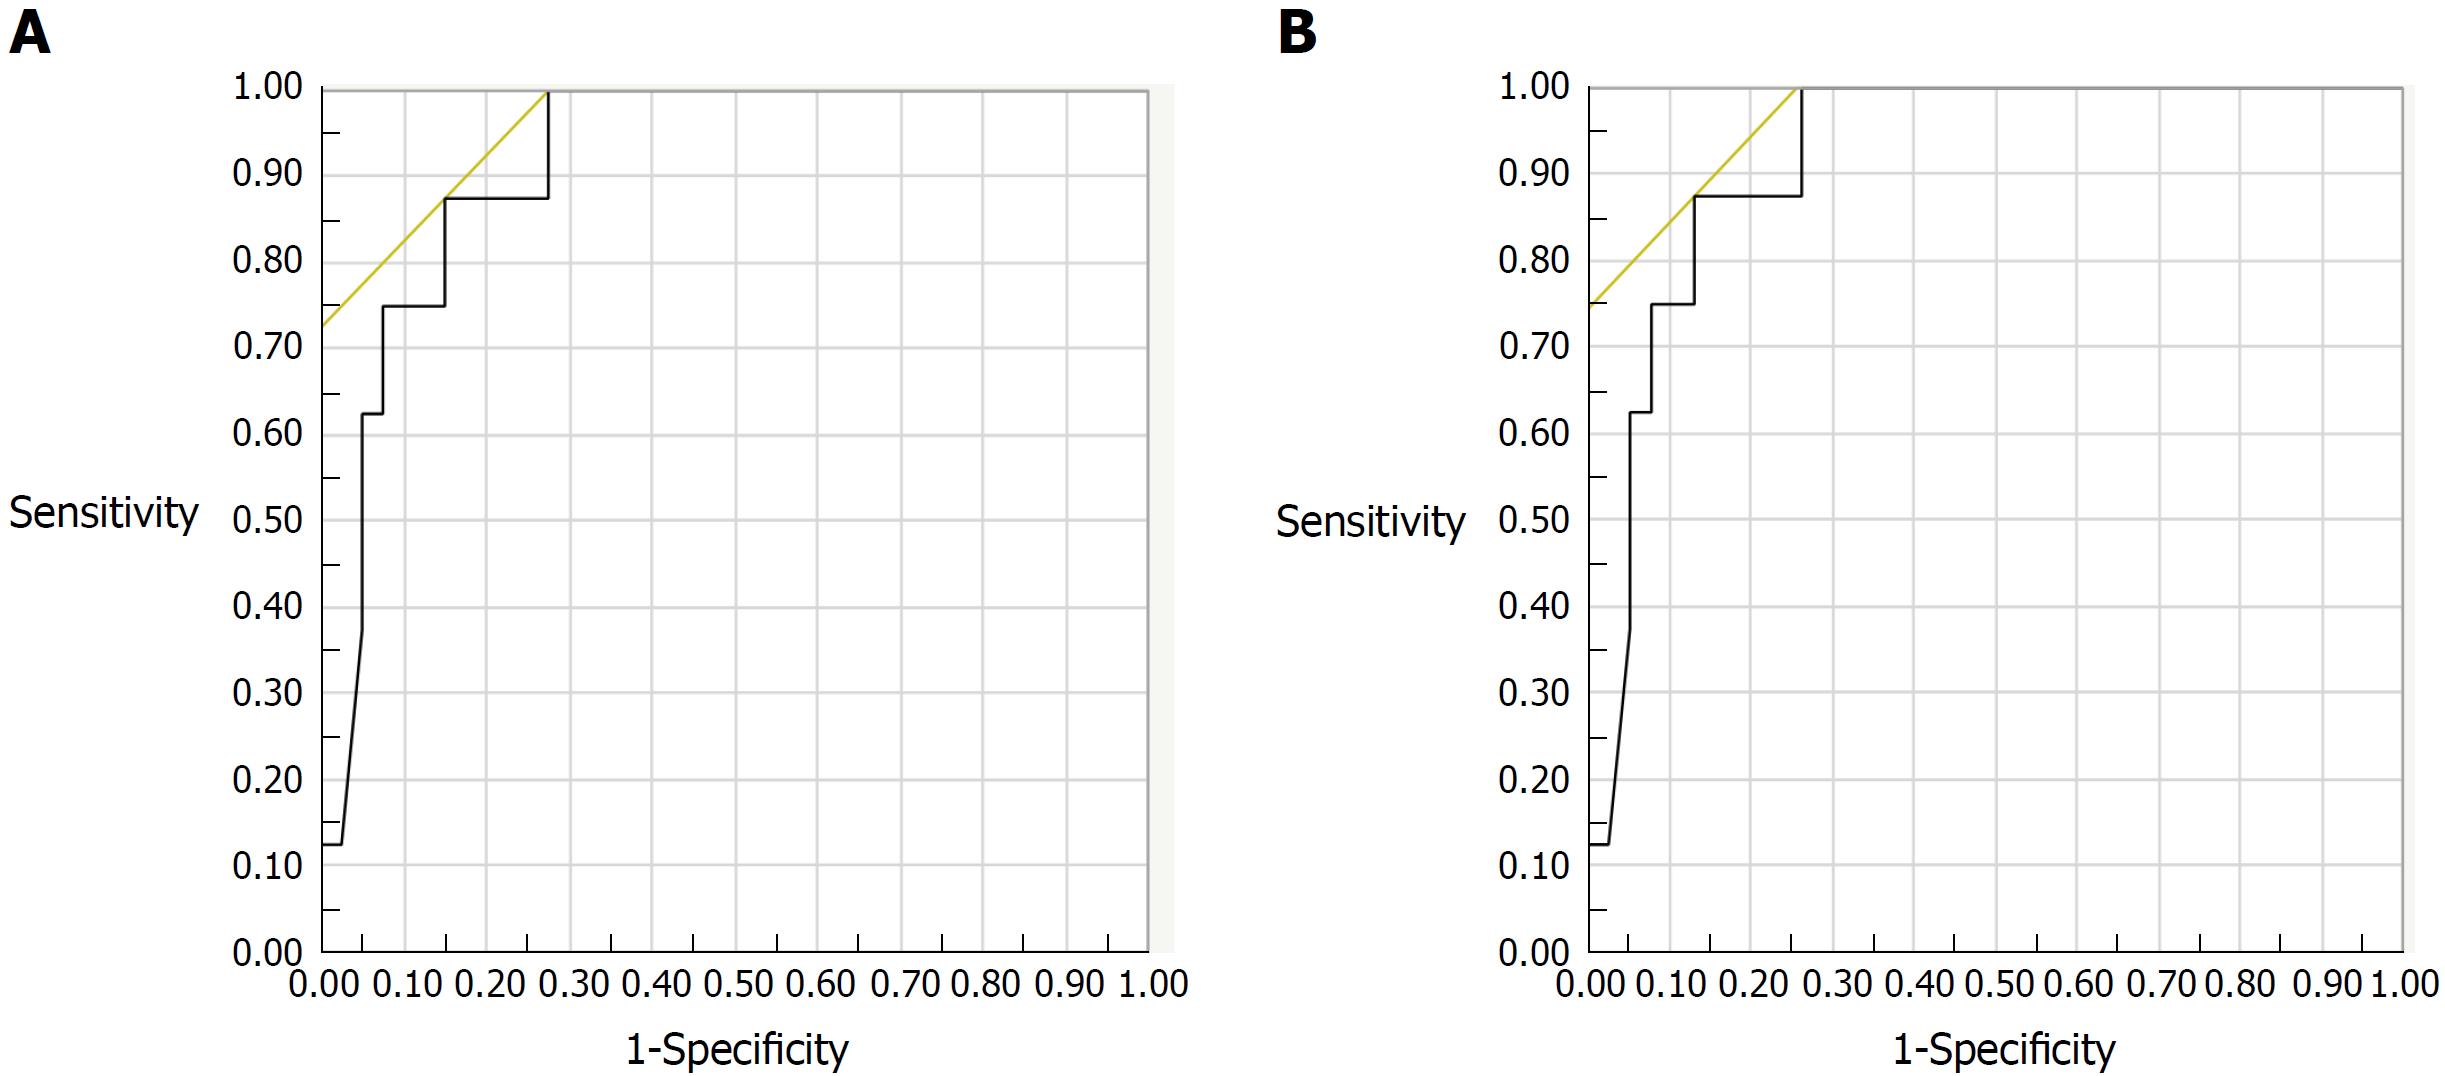
Figure 2 Receiver-operating characteristic curves for fecal calprotectin levels in predicting the histologic remission of ulcerative colitis (n = 46).
A: ROC for FC in predicting remission by Riley’s score. The AUC was 0.881, 95CI: 0.780-0.981. The best cut-off value of FC was 125 μg/g, with a sensitivity of 80% and a specificity of 86%; B: ROC for FC in predicting remission by Matts grade. The AUC was 0.918, 95%CI: 0.831-1.000. The best cut-off value of FC was 123 μg/g, with a sensitivity of 88% and a specificity of 87%. ROC: Receiver-operating characteristic; FC: Fecal calprotectin; AUC: Area under the curve.
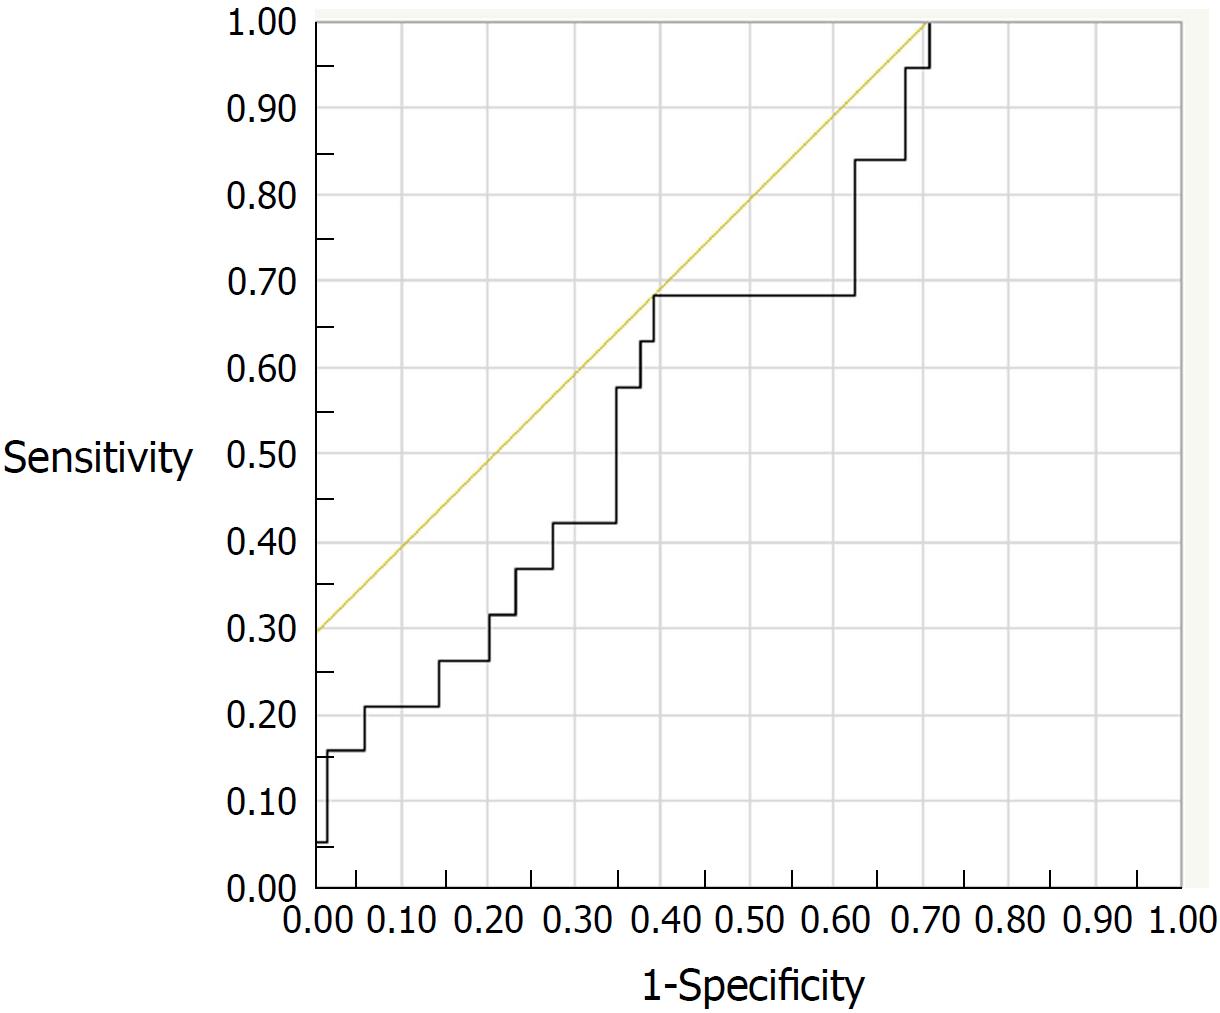
Figure 3 Receiver-operating characteristic curve for fecal calprotectin levels to predict relapse at the six-month follow-up assessment (AUC: 0.
648; 95%CI: 0.517-0.778). The best cut-off value was 175 μg/g, with a sensitivity of 68% and a specificity of 61%. AUC: Area under the curve.
- Citation: Urushikubo J, Yanai S, Nakamura S, Kawasaki K, Akasaka R, Sato K, Toya Y, Asakura K, Gonai T, Sugai T, Matsumoto T. Practical fecal calprotectin cut-off value for Japanese patients with ulcerative colitis. World J Gastroenterol 2018; 24(38): 4384-4392
- URL: https://www.wjgnet.com/1007-9327/full/v24/i38/4384.htm
- DOI: https://dx.doi.org/10.3748/wjg.v24.i38.4384


