Copyright
©The Author(s) 2018.
World J Gastroenterol. Sep 7, 2018; 24(33): 3786-3798
Published online Sep 7, 2018. doi: 10.3748/wjg.v24.i33.3786
Published online Sep 7, 2018. doi: 10.3748/wjg.v24.i33.3786
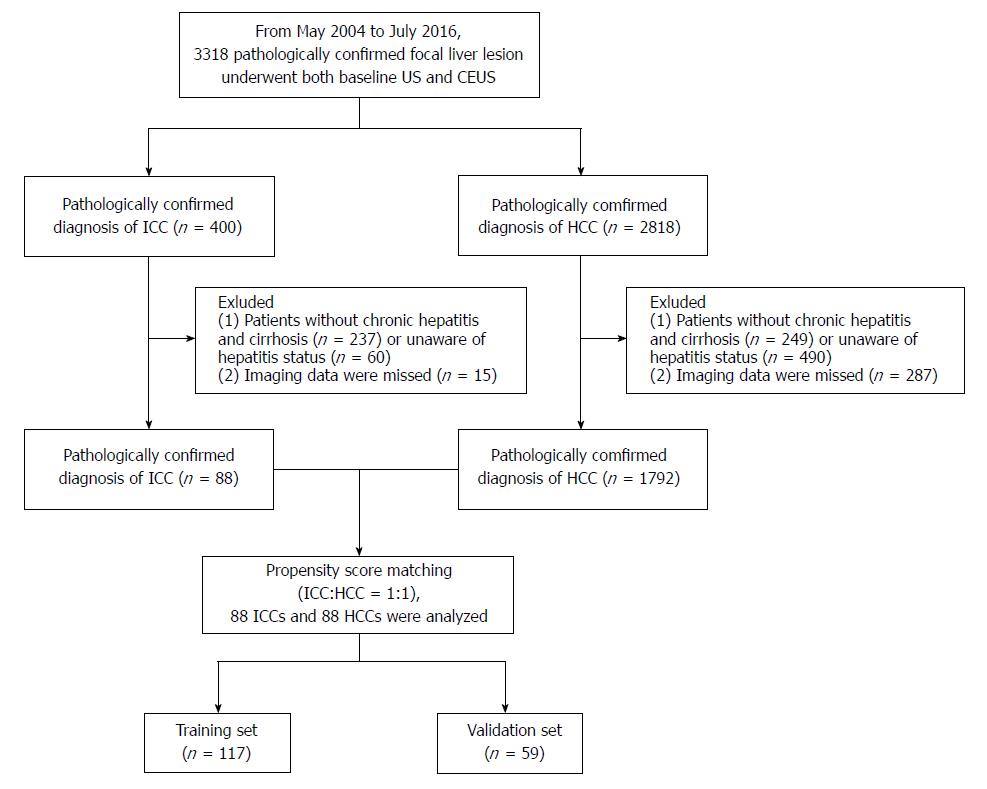
Figure 1 Flowchart of the intrahepatic cholangiocarcinoma and hepatocellular carcinoma patient selection process.
CEUS: Contrast-enhanced ultrasound; HCC: Hepatocellular carcinoma; ICC: Intrahepatic cholangiocarcinoma.
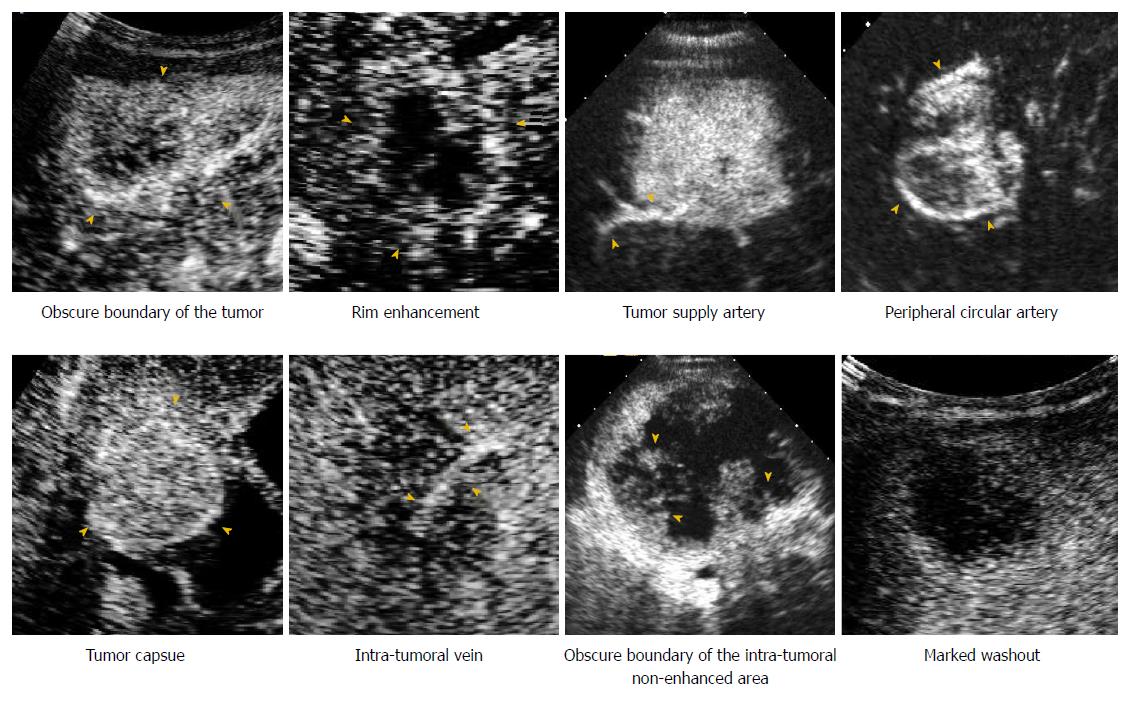
Figure 2 Contrast-enhanced ultrasound images demonstrate the enhancement features of intrahepatic cholangiocarcinoma and hepatocellular carcinoma.
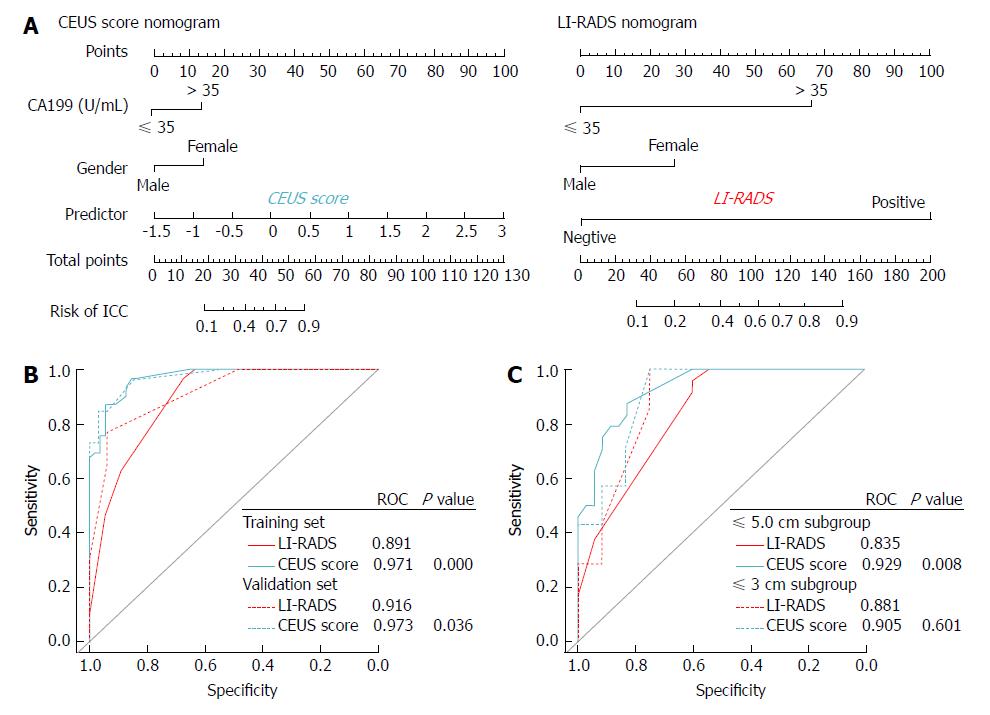
Figure 3 Contrast-enhanced ultrasound score nomogram and liver imaging reporting and data system nomogram for intrahepatic cholangiocarcinoma prediction.
A: Constructed contrast-enhanced ultrasound score nomogram and liver imaging reporting and data system nomogram; B: ROC curves for the two nomograms in the training and validation set; C: ROC curves for the two nomograms in ≤ 5.0 cm and ≤ 3.0 cm subgroup analysis. CEUS: Contrast-enhanced ultrasound; LI-RADS: Liver imaging reporting and data system; ICC: Intrahepatic cholangiocarcinoma; HCC: Hepatocellular carcinoma.
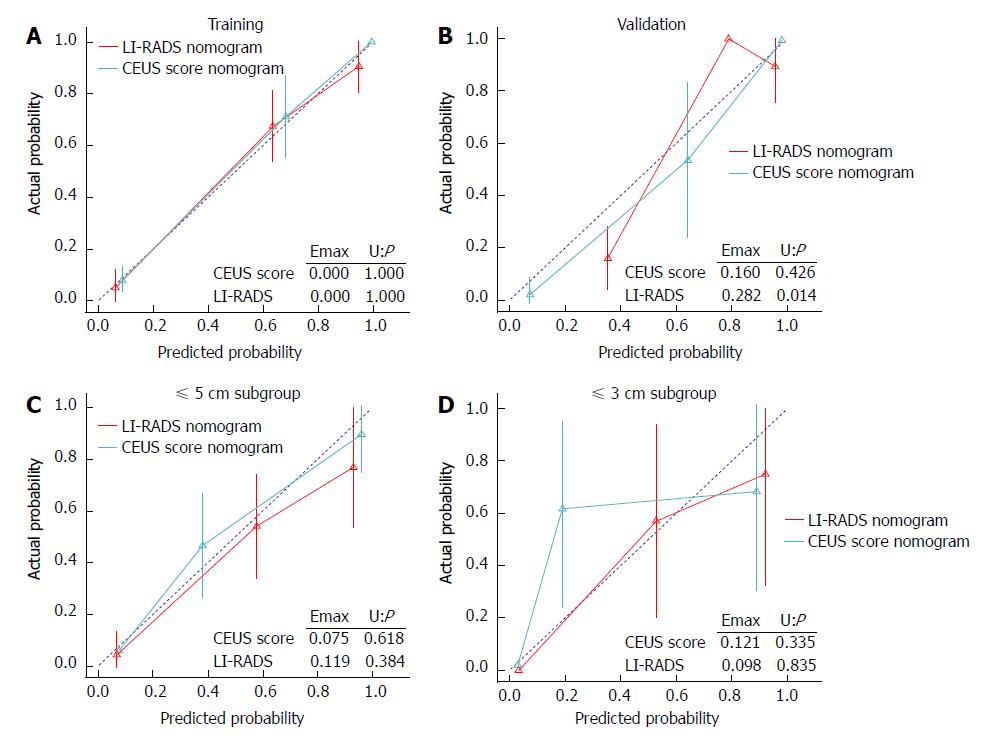
Figure 4 Calibration plots of the contrast-enhanced ultrasound score nomogram and liver imaging reporting and data system nomogram applied in the training (A), validation cohort (B), as well as ≤ 5.
0 cm (C) and ≤ 3.0 cm subgroup (D). CEUS: Contrast-enhanced ultrasound; LI-RADS: Liver imaging reporting and data system.
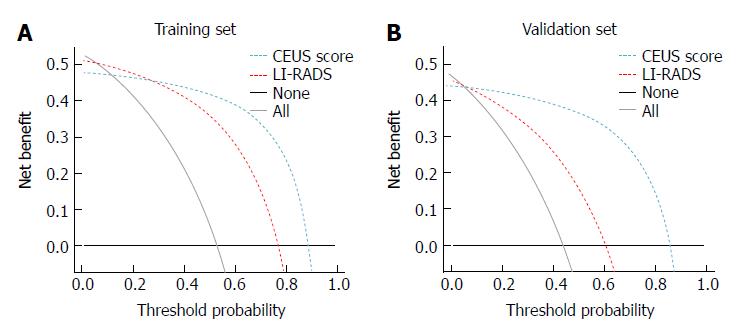
Figure 5 Decision curve analysis of the contrast-enhanced ultrasound score nomogram and liver imaging reporting and data system nomogram in the training (A) and validation cohort (B).
CEUS: Contrast-enhanced ultrasound; LI-RADS: Liver imaging reporting and data system.
- Citation: Chen LD, Ruan SM, Liang JY, Yang Z, Shen SL, Huang Y, Li W, Wang Z, Xie XY, Lu MD, Kuang M, Wang W. Differentiation of intrahepatic cholangiocarcinoma from hepatocellular carcinoma in high-risk patients: A predictive model using contrast-enhanced ultrasound. World J Gastroenterol 2018; 24(33): 3786-3798
- URL: https://www.wjgnet.com/1007-9327/full/v24/i33/3786.htm
- DOI: https://dx.doi.org/10.3748/wjg.v24.i33.3786


