Copyright
©The Author(s) 2018.
World J Gastroenterol. Aug 21, 2018; 24(31): 3538-3546
Published online Aug 21, 2018. doi: 10.3748/wjg.v24.i31.3538
Published online Aug 21, 2018. doi: 10.3748/wjg.v24.i31.3538
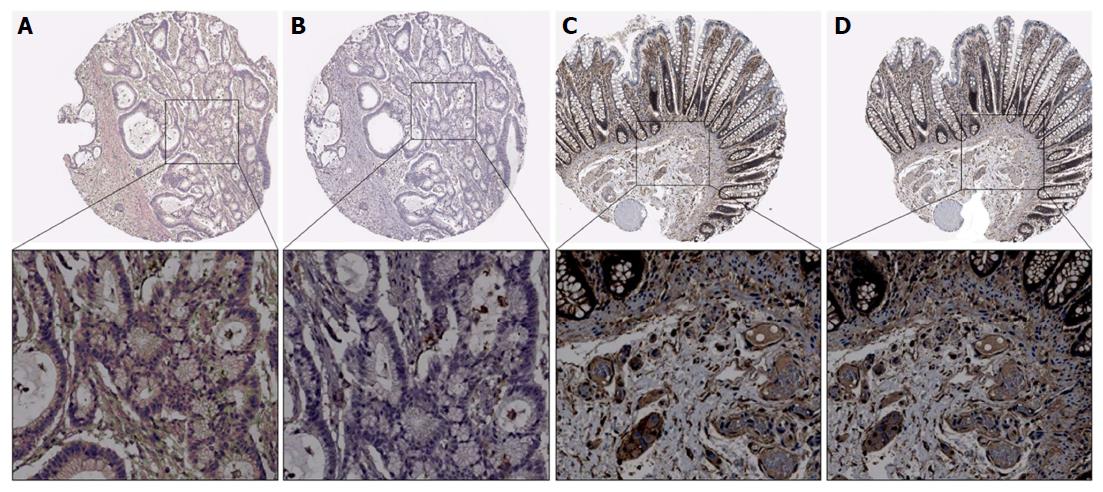
Figure 1 The representative immunohistochemical images of B7 homolog 3 and β-1,3-galactosyltransferase-4 expression in colorectal cancer tissues.
A: Low expression of B7 homolog 3 (B7-H3); B: Low expression of β-1,3-galactosyltransferase-4 (B3GALT4); C: High expression of B7-H3; D: High expression of B3GALT4 (100 ×). The images below show the magnification of each zone (400 ×). A and B are from one patient; C and D are from another patient.
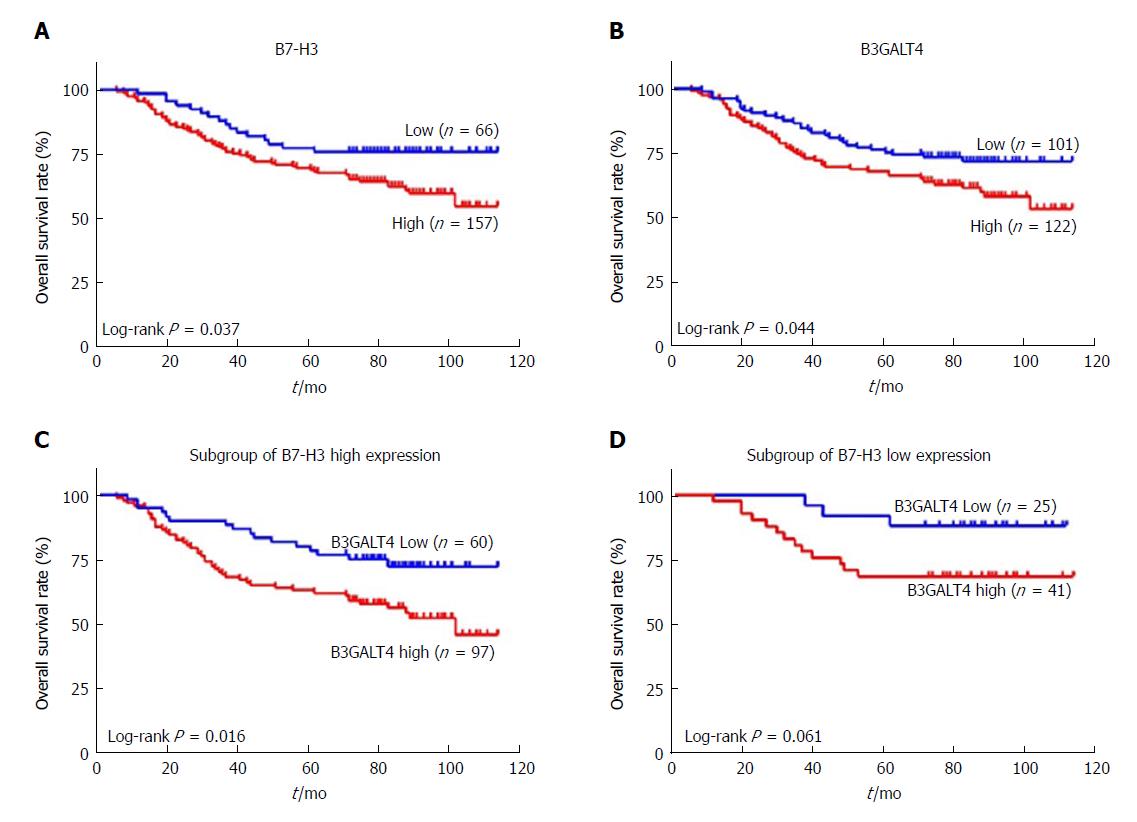
Figure 2 Kaplan-Meier survival curves of the 223 patients with colorectal cancer expressing B7 homolog 3 and β-1,3-galactosyltransferase-4.
A: Patients with low expression of B7 homolog 3 (B7-H3) vs high expression of B7-H3; B: Patients with low expression of β-1,3-galactosyltransferase-4 (B3GALT4) vs high expression of B3GALT4; C: Subgroup of patients with high expression of B7-H3 and low expression of B3GALT4 vs high expression of B3GALT4; D: Subgroup of patients with low expression of B7-H3 and high expression of B3GALT4 vs low expression of B3GALT4.
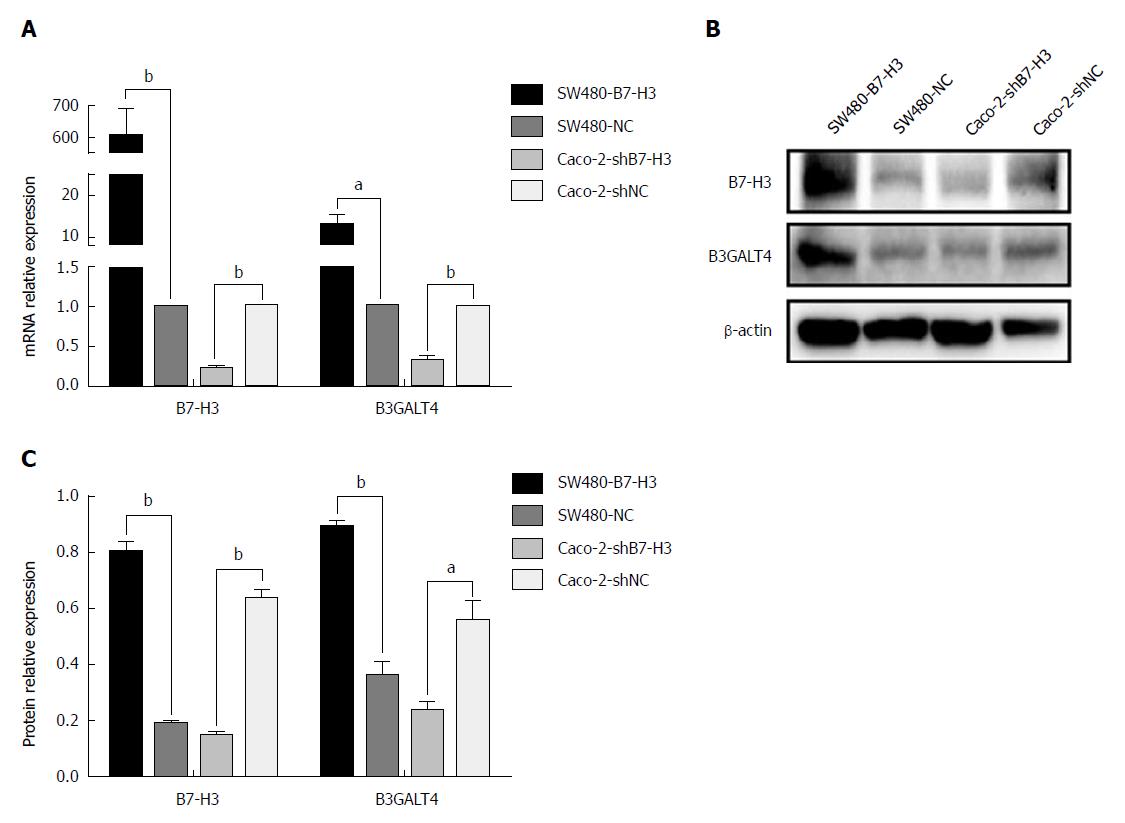
Figure 3 The expression of B7 homolog 3 and β-1,3-galactosyltransferase-4 in colorectal cancer cell lines.
A: Real-time quantitative polymerase chain reaction results of relative mRNA expression; B: Western blotting results for protein expression; C: Statistical analysis of protein expression (aP < 0.05, bP < 0.01).
- Citation: Zhang T, Wang F, Wu JY, Qiu ZC, Wang Y, Liu F, Ge XS, Qi XW, Mao Y, Hua D. Clinical correlation of B7-H3 and B3GALT4 with the prognosis of colorectal cancer. World J Gastroenterol 2018; 24(31): 3538-3546
- URL: https://www.wjgnet.com/1007-9327/full/v24/i31/3538.htm
- DOI: https://dx.doi.org/10.3748/wjg.v24.i31.3538


