Copyright
©The Author(s) 2018.
World J Gastroenterol. Aug 14, 2018; 24(30): 3440-3447
Published online Aug 14, 2018. doi: 10.3748/wjg.v24.i30.3440
Published online Aug 14, 2018. doi: 10.3748/wjg.v24.i30.3440
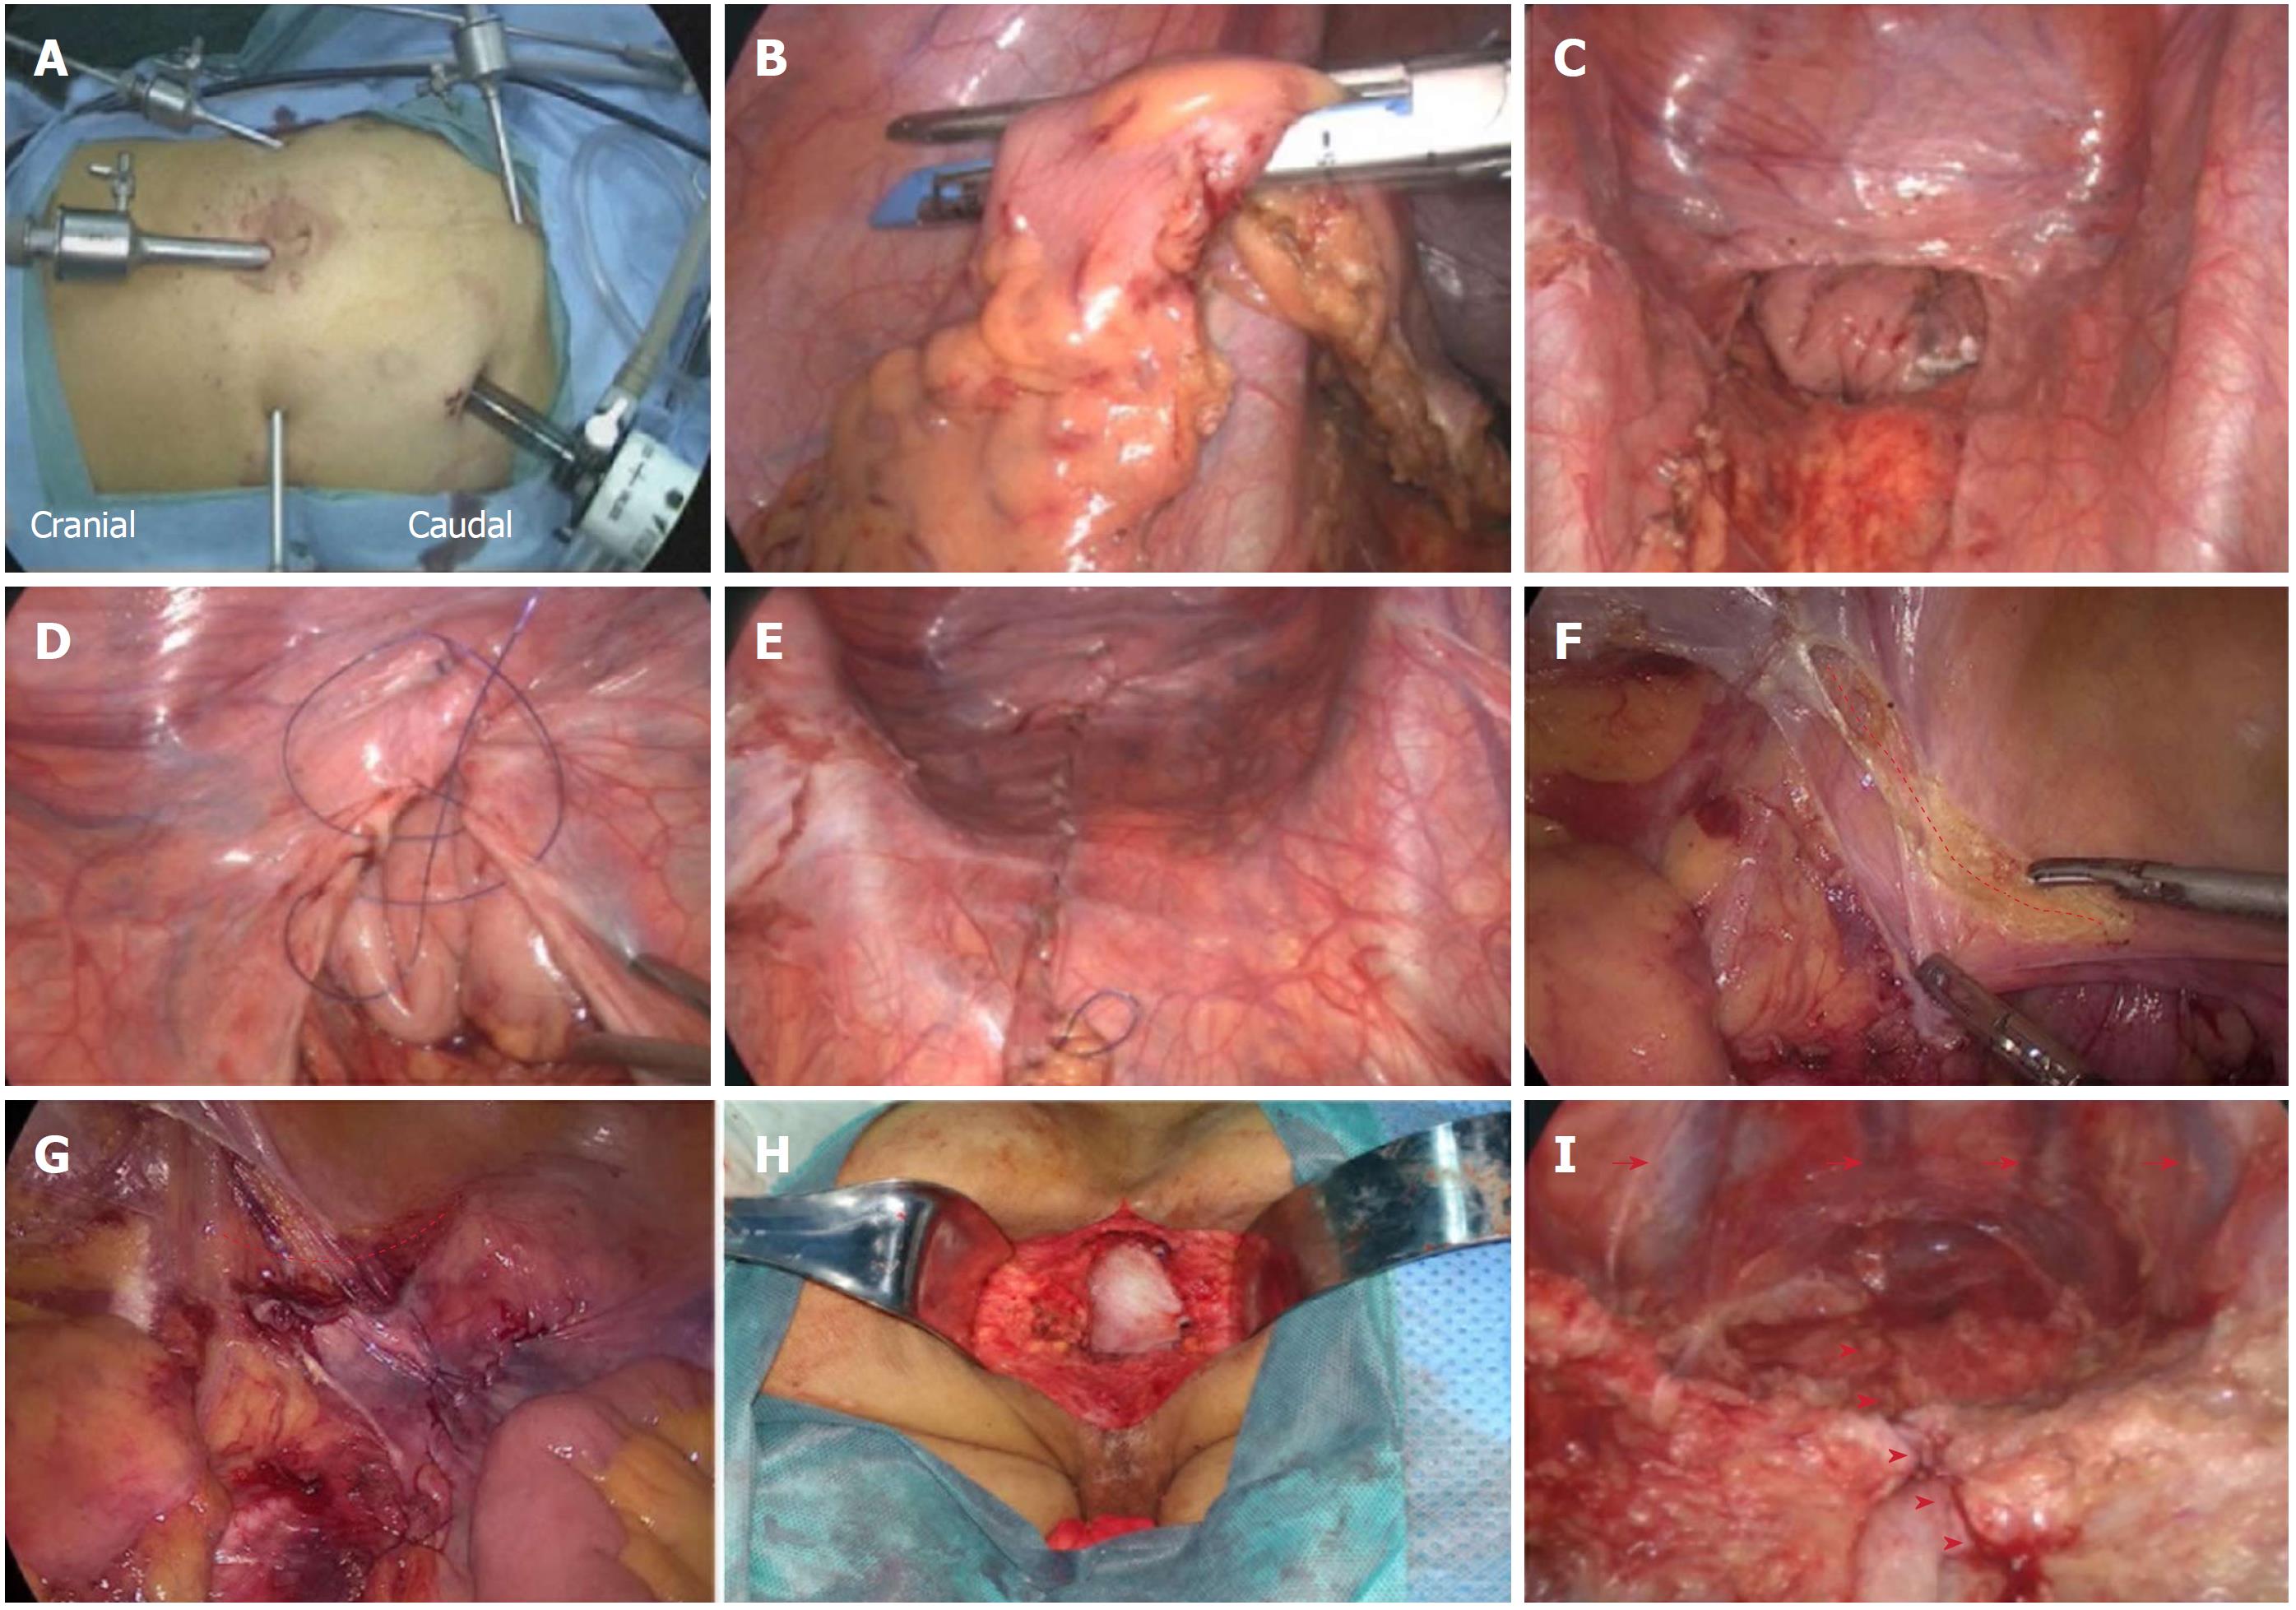
Figure 1 Surgical procedures.
A: Port placement; B: Transection of the rectum at the rectosigmoid junction with an ENDO-GIA; C: Distal rectum pushed down to the pelvis; D: Closure of the pelvic peritoneum with a continuous suture using a barbed thread; E: Closure of the pelvic peritoneum; F: Tension reduction of the adjacent peritoneum (the dotted line shows the incised peritoneum); G: Closure of the peritoneum after tension reduction (the dotted line shows the incised peritoneum); H: Reconstruction of the pelvic floor with biological mesh; I: View of the closed peritoneum from the perineal wound in the prone position (the arrows show the presacral veins, and the arrowheads show the closed peritoneum).
Figure 2 Drainage and temperature changes.
A: Postoperative drainage volumes in the two groups; B: Postoperative temperature changes in the two groups.
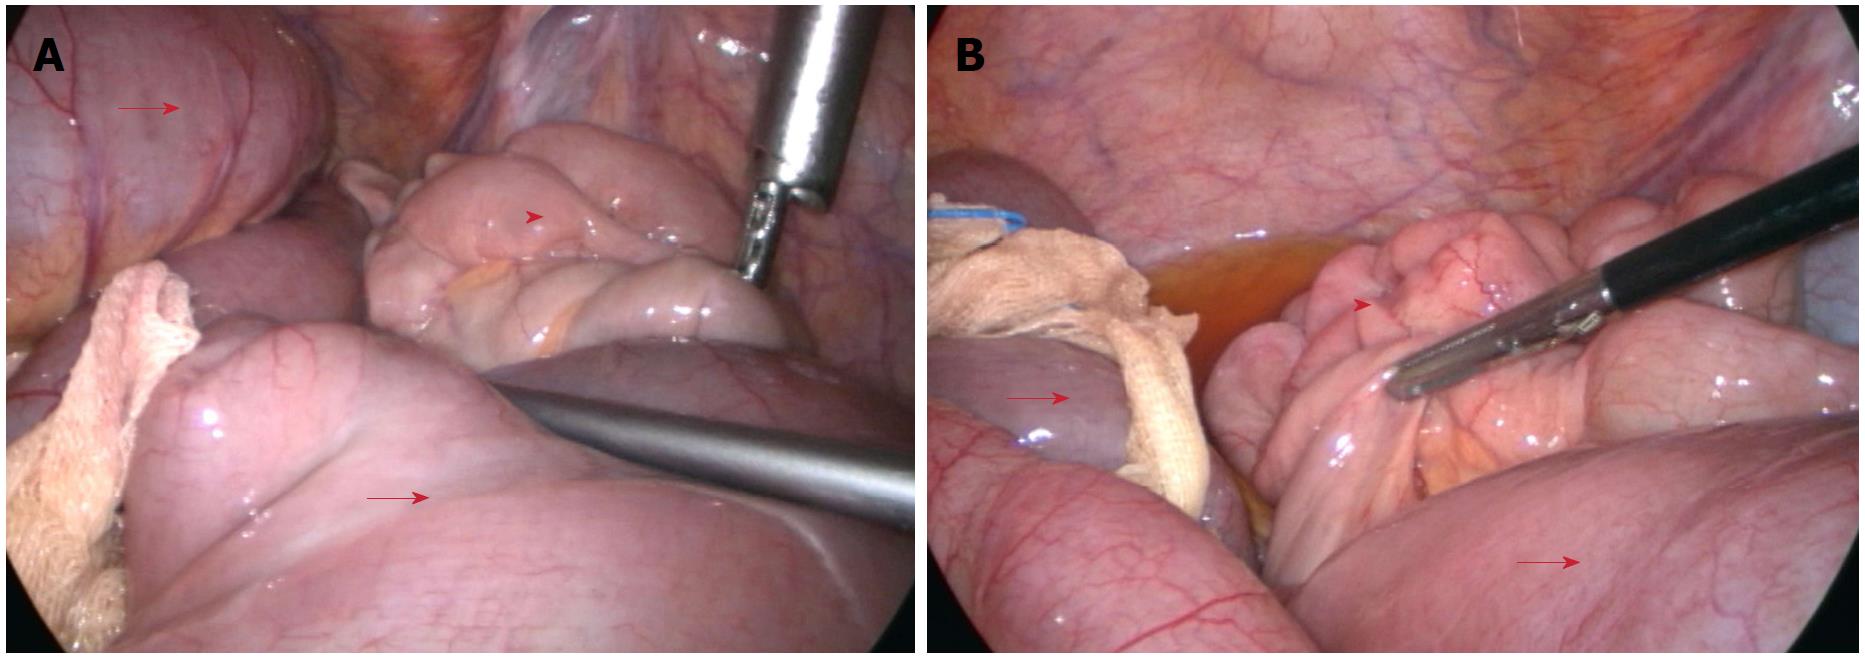
Figure 3 Laparoscopy.
Laparoscopic exploration of the abdominal cavity in the patient with intestinal obstruction (the arrow shows the proximal dilated small intestine, and the arrowhead shows the distal normal small intestine).
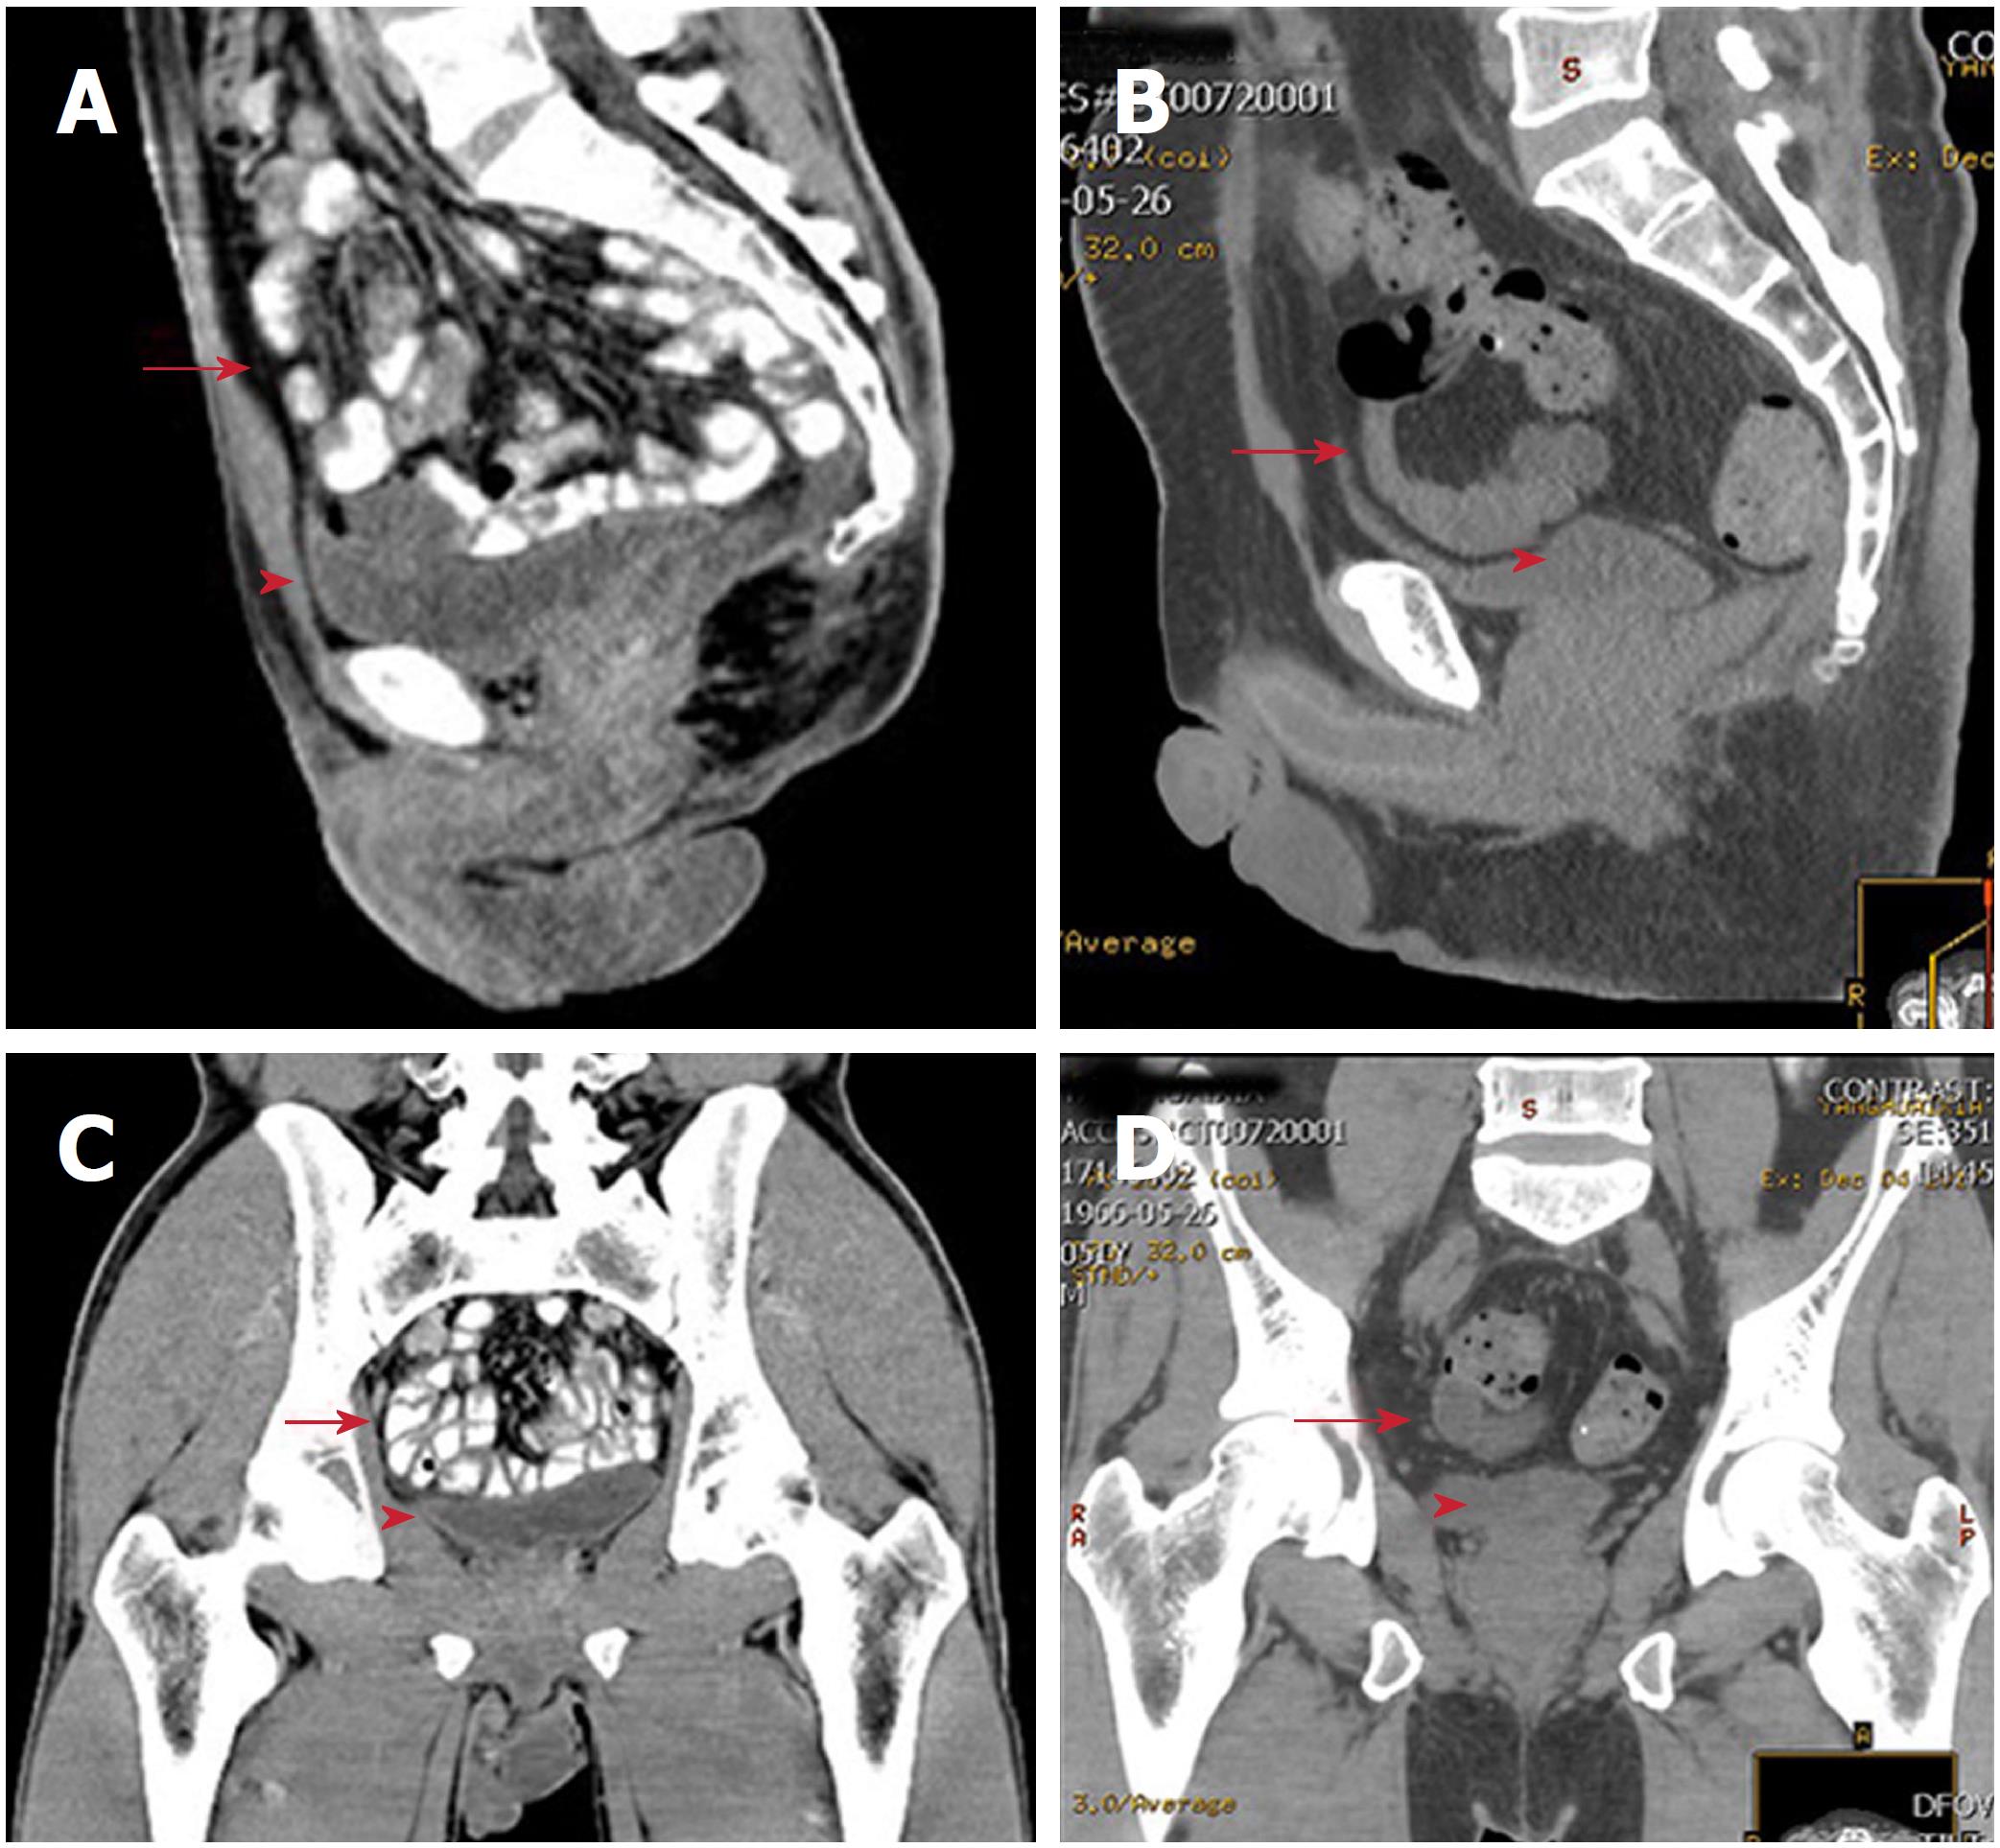
Figure 4 Postoperative magnetic resonance imaging.
A: Twelve-month postoperative Sagittal CT scan in the modified primary closure group; B: Twelve-month postoperative Sagittal CT scan in the biological mesh closure group; C: Twelve-month postoperative Coronal CT scan in the modified primary closure group; D: Twelve-month postoperative Coronal CT scan in the biological mesh closure group (the arrow shows the small intestine, and the arrowhead shows the bladder). CT: Computed tomography.
- Citation: Wang YL, Zhang X, Mao JJ, Zhang WQ, Dong H, Zhang FP, Dong SH, Zhang WJ, Dai Y. Application of modified primary closure of the pelvic floor in laparoscopic extralevator abdominal perineal excision for low rectal cancer. World J Gastroenterol 2018; 24(30): 3440-3447
- URL: https://www.wjgnet.com/1007-9327/full/v24/i30/3440.htm
- DOI: https://dx.doi.org/10.3748/wjg.v24.i30.3440


