Copyright
©The Author(s) 2018.
World J Gastroenterol. Aug 7, 2018; 24(29): 3302-3312
Published online Aug 7, 2018. doi: 10.3748/wjg.v24.i29.3302
Published online Aug 7, 2018. doi: 10.3748/wjg.v24.i29.3302
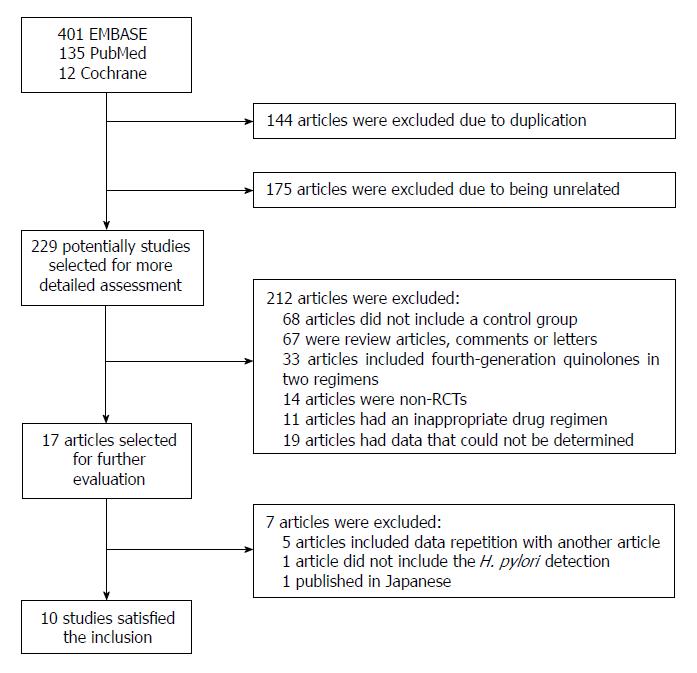
Figure 1 Flow diagram of the identified and selected trials.
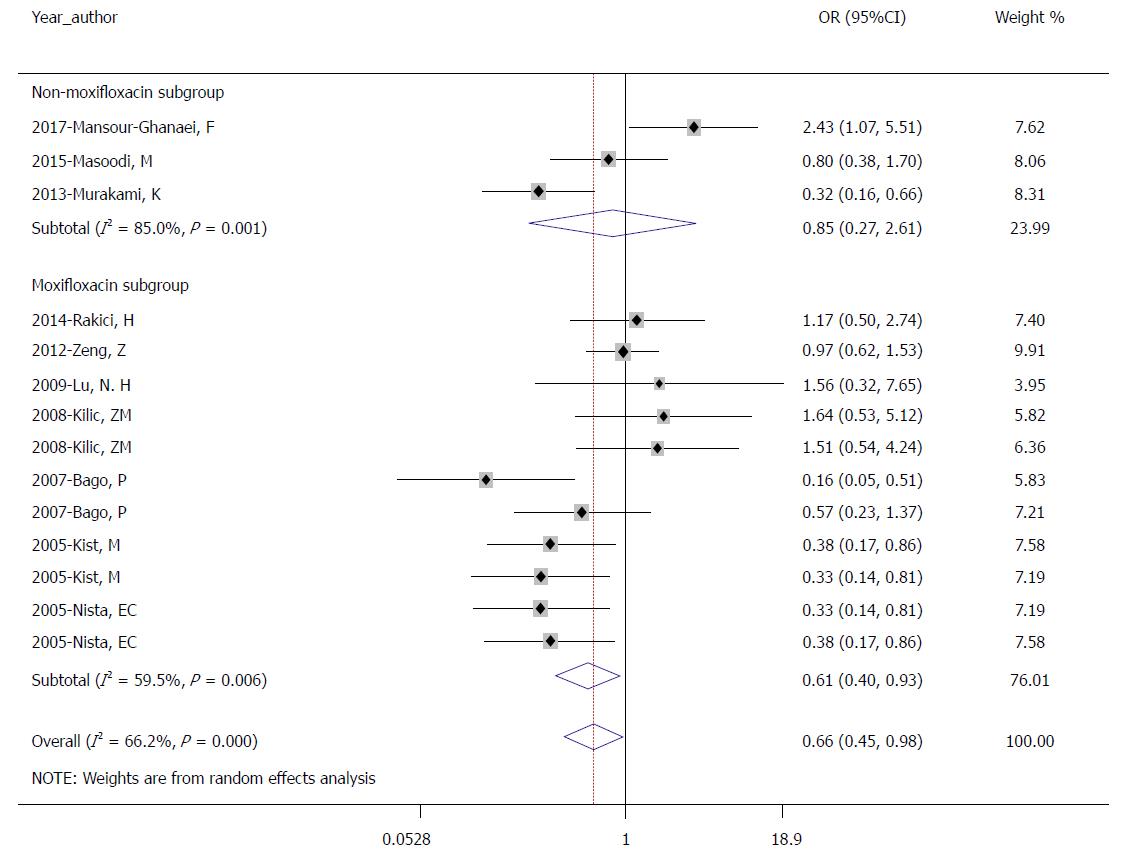
Figure 2 Forest plot of eradication rate of the therapies containing non-fourth-generation quinolones vs that of the therapies containing fourth-generation quinolones (intention-to-treat analysis).
Figure 3 Forest plot of the sub-analysis according to types of fourth-generation quinolone (intention-to-treat analysis).
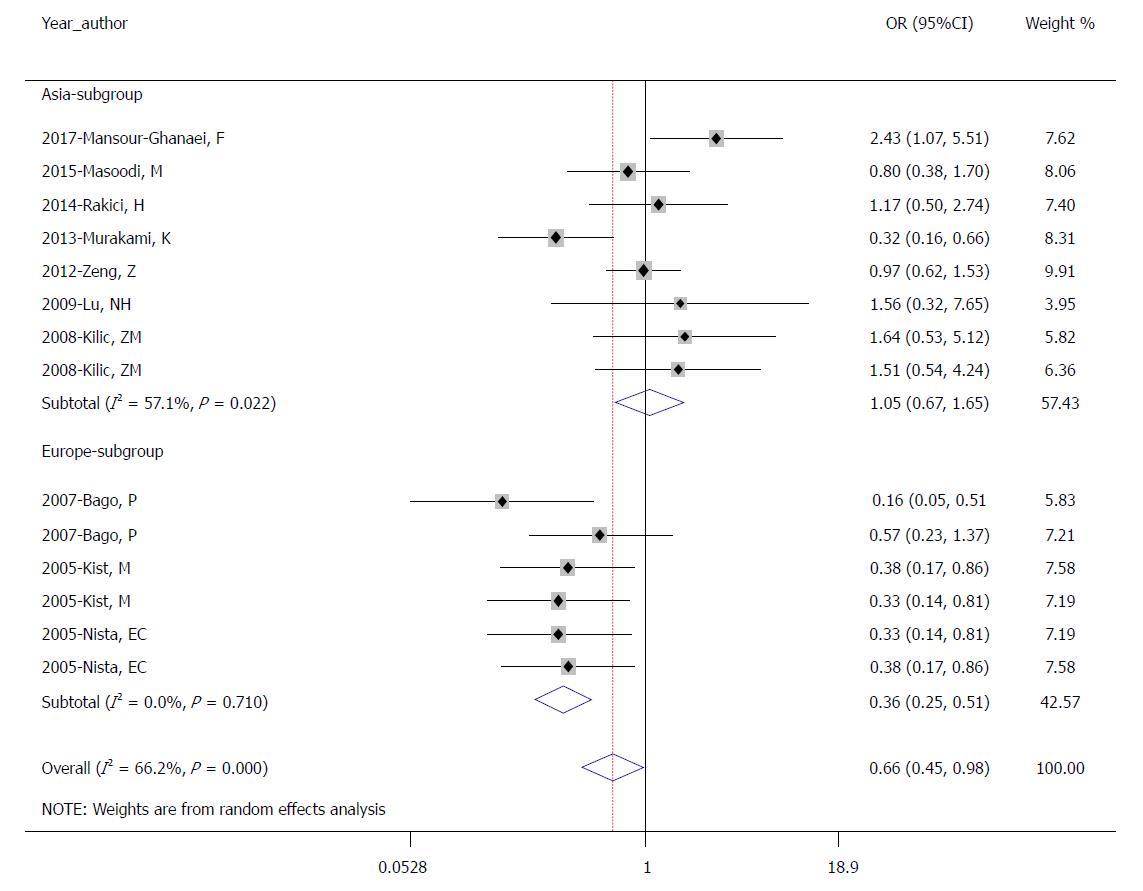
Figure 4 Forest plot of the sub-analysis according to region (intention-to-treat analysis).
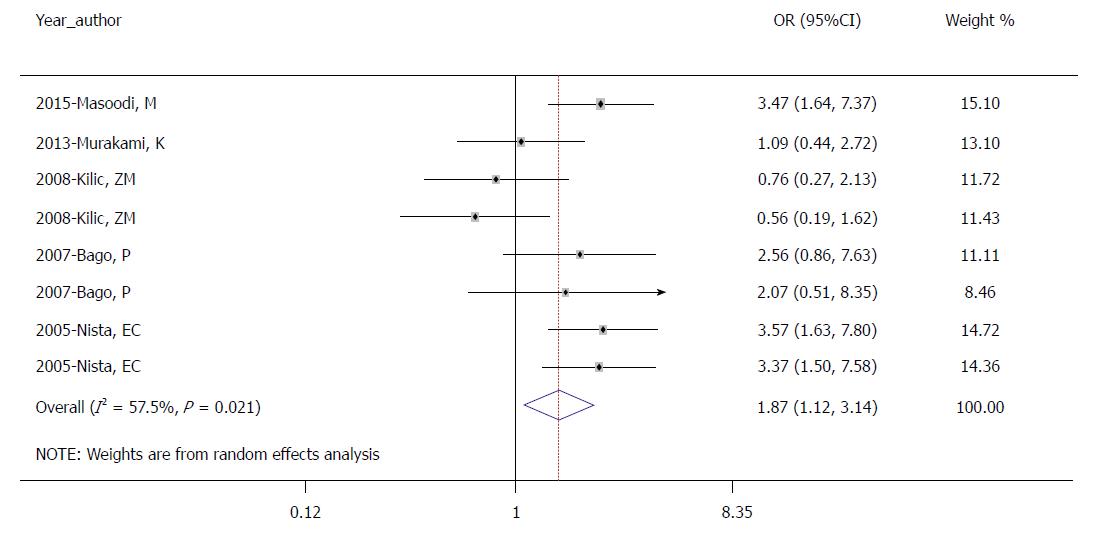
Figure 5 Forest plot of the side effects of the therapies containing fourth-generation quinolones vs the therapies containing non-fourth-generation quinolones.
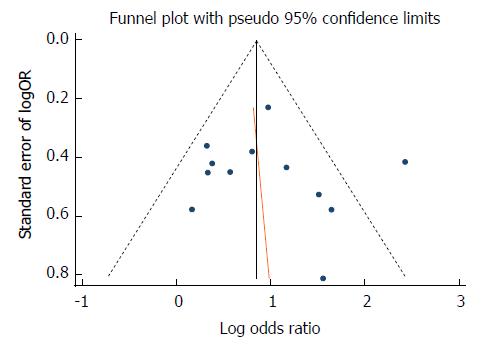
Figure 6 Funnel plot of the therapies containing non-fourth-generation quinolones vs the therapies containing fourth-generation quinolones (intention-to-treat analysis).
- Citation: An Y, Wang Y, Wu S, Wang YH, Qian X, Li Z, Fu YJ, Xie Y. Fourth-generation quinolones in the treatment of Helicobacter pylori infection: A meta-analysis. World J Gastroenterol 2018; 24(29): 3302-3312
- URL: https://www.wjgnet.com/1007-9327/full/v24/i29/3302.htm
- DOI: https://dx.doi.org/10.3748/wjg.v24.i29.3302


