Copyright
©The Author(s) 2018.
World J Gastroenterol. Jul 21, 2018; 24(27): 2995-3005
Published online Jul 21, 2018. doi: 10.3748/wjg.v24.i27.2995
Published online Jul 21, 2018. doi: 10.3748/wjg.v24.i27.2995
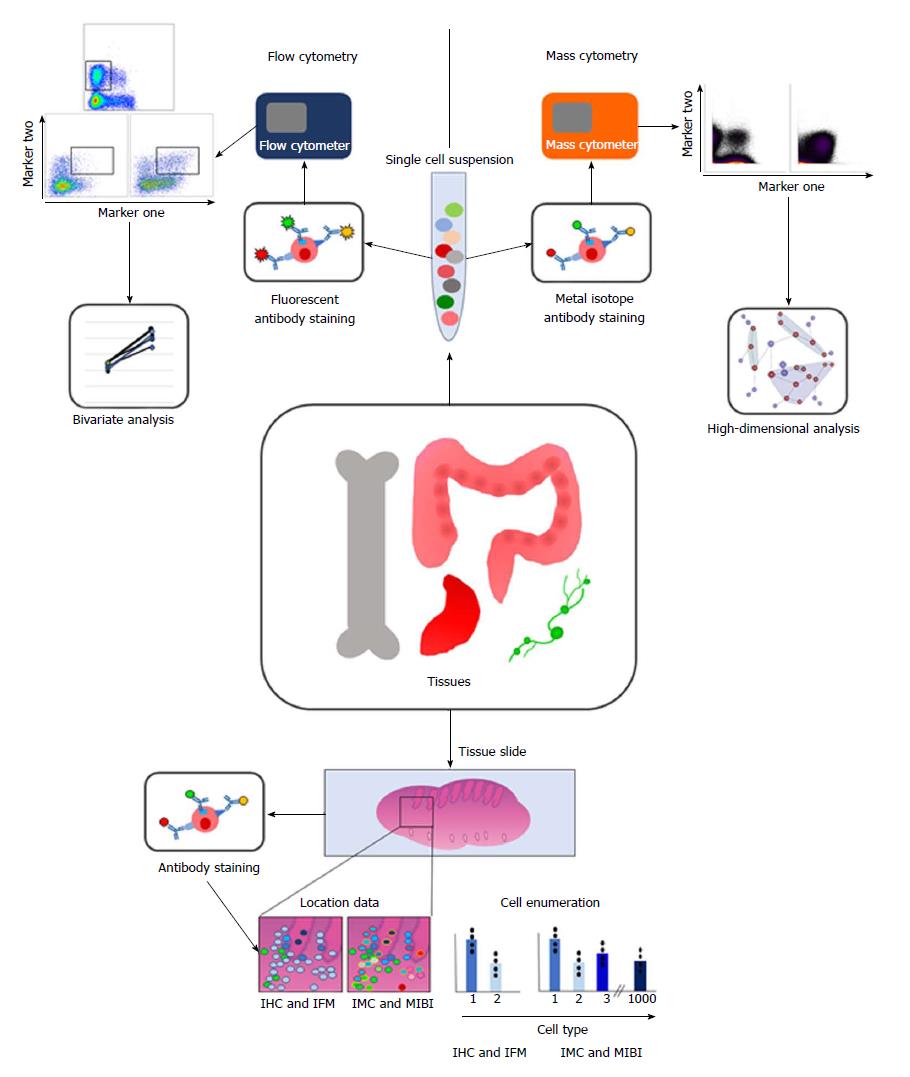
Figure 1 Diagram summarising the methodology and analysis techniques involved in multiparametric analysis of immune cells.
Briefly, tissues of interest are taken and either dissociated into a single cell suspension or mounted onto slides. Cells in suspension are stained with fluorescently labelled antibodies for flow cytometry, and then acquired using a flow cytometer. This data is often presented as populations positive or negative for 2 markers. For mass cytometry, cells are stained with antibodies labelled with heavy metal isotopes, and then acquired using a mass cytometer. The high dimensionality of this data means that clustering analyses are preferred to analyse this data. For imaging techniques, the tissue slides are also labelled with antibodies, and can be imaged using IHC, IFM, IMC or MIBI. Imaging techniques enable location of immune cells in situ, as well as enumeration of cell types. IMC and MIBI use more parameters, meaning more cell types can be distinguished, and clustering algorithms can be used on this data too, and related back to the geographical location of each cell. IHC: Immunohistochemistry; IFM: Immunofluorescent microscopy; IMC: Imaging mass cytometry; MIBI: Multiplex ion beam imaging.
- Citation: Leman JK, Sandford SK, Rhodes JL, Kemp RA. Multiparametric analysis of colorectal cancer immune responses. World J Gastroenterol 2018; 24(27): 2995-3005
- URL: https://www.wjgnet.com/1007-9327/full/v24/i27/2995.htm
- DOI: https://dx.doi.org/10.3748/wjg.v24.i27.2995


