Copyright
©The Author(s) 2018.
World J Gastroenterol. Jun 21, 2018; 24(23): 2508-2517
Published online Jun 21, 2018. doi: 10.3748/wjg.v24.i23.2508
Published online Jun 21, 2018. doi: 10.3748/wjg.v24.i23.2508
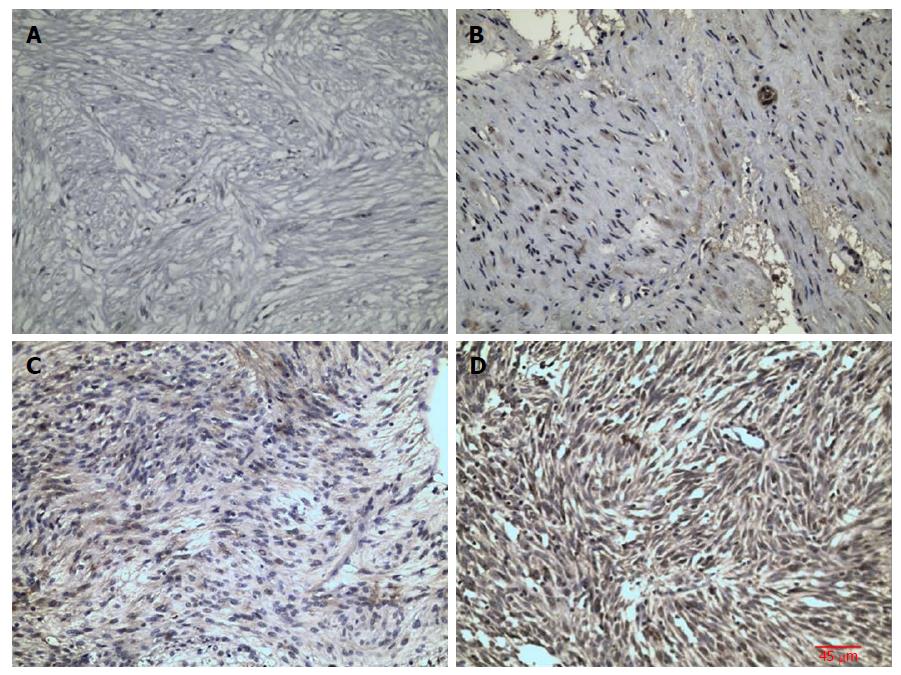
Figure 1 Immunohistochemcial staining for Raf kinase inhibitory protein in gastrointestinal stromal tumor tissues.
A: Negative expression; B: Mildly positive expression; C: Moderately positive expression; D: Strongly positive expression. Scale bars on Figure. Magnification is 200 ×.
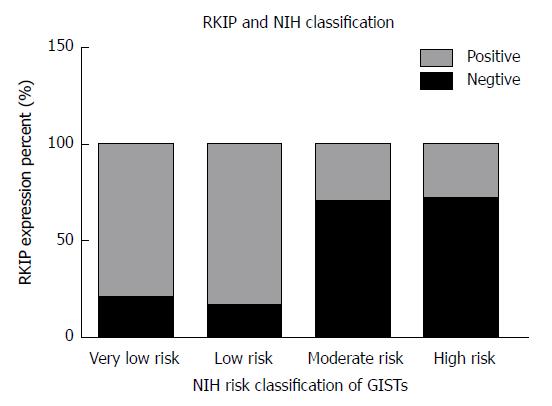
Figure 2 Relationship between Raf kinase inhibitory protein expression and National Institutes of Health risk grade in gastrointestinal stromal tumors.
The figure shows RKIP positive rate is different between each NIH risk grade group: The higher risk grade group with the lower RKIP positive rate. RKIP: Raf kinase inhibitory protein; NIH: National Institutes of Health; GISTs: Gastrointestinal stromal tumors.
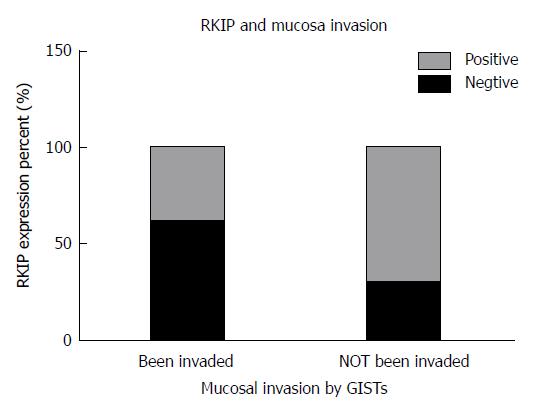
Figure 3 Relationship between Raf kinase inhibitory protein expression and mucosal invasion in gastrointestinal stromal tumors.
RKIP expression is related with mucosal invasion status in GISTs: the RKIP positive rate of the mucosal invaded group is lower than the control group whose mucosa has not been invaded (P < 0.05). RKIP: Raf kinase inhibitory protein; GISTs: Gastrointestinal stromal tumors.
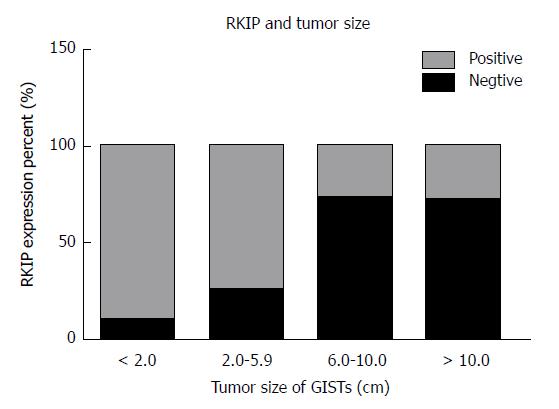
Figure 4 Relationship between Raf kinase inhibitory protein expression and tumor size in gastrointestinal stromal tumors.
RKIP positive rate declined as the tumor size increased. RKIP: Raf kinase inhibitory protein; GISTs: Gastrointestinal stromal tumors.
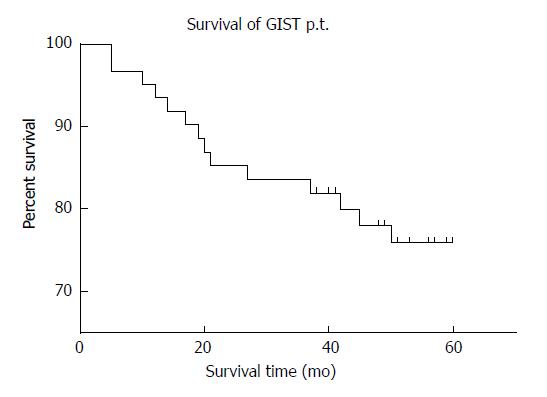
Figure 5 Survival rate of 60 gastrointestinal stromal tumors patients at follow-up.
GIST: Gastrointestinal stromal tumors.
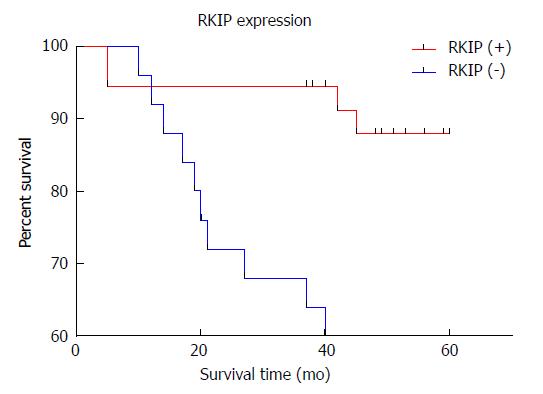
Figure 6 Relationship between raf kinase inhibitory protein expression and prognosis in gastrointestinal stromal tumors.
Compared with the RKIP negative Group, the high RKIP expression group is correlated with a better survival rate, the difference was significant. (Log-Rank analysis, P = 0.0015). RKIP: Raf kinase inhibitory protein.
- Citation: Wang Y, Chen JJ, Wang XF, Wang Q. Clinical and prognostic significance of Raf kinase inhibitory protein expression in gastrointestinal stromal tumors. World J Gastroenterol 2018; 24(23): 2508-2517
- URL: https://www.wjgnet.com/1007-9327/full/v24/i23/2508.htm
- DOI: https://dx.doi.org/10.3748/wjg.v24.i23.2508


