Copyright
©The Author(s) 2018.
World J Gastroenterol. Jan 14, 2018; 24(2): 290-296
Published online Jan 14, 2018. doi: 10.3748/wjg.v24.i2.290
Published online Jan 14, 2018. doi: 10.3748/wjg.v24.i2.290
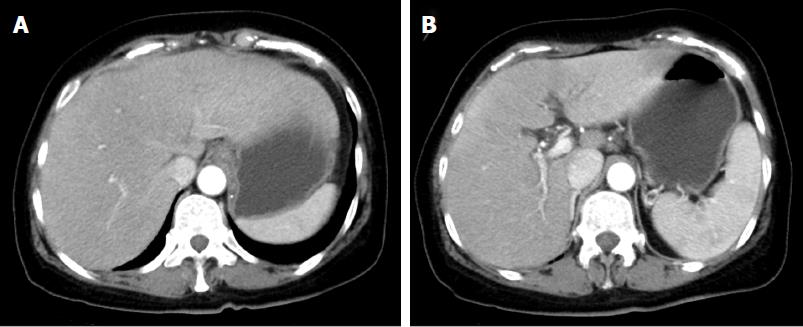
Figure 1 Contrast computerized tomography before the treatment.
A: CT revealed hepatomegaly with no mass or dilatation of the intrahepatic duct in the liver; B: CT revealed splenomegaly. CT: Computerized tomography.
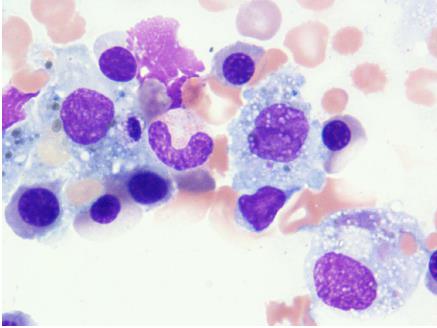
Figure 2 Bone marrow examination revealed macrophages phagocytizing blood cells.
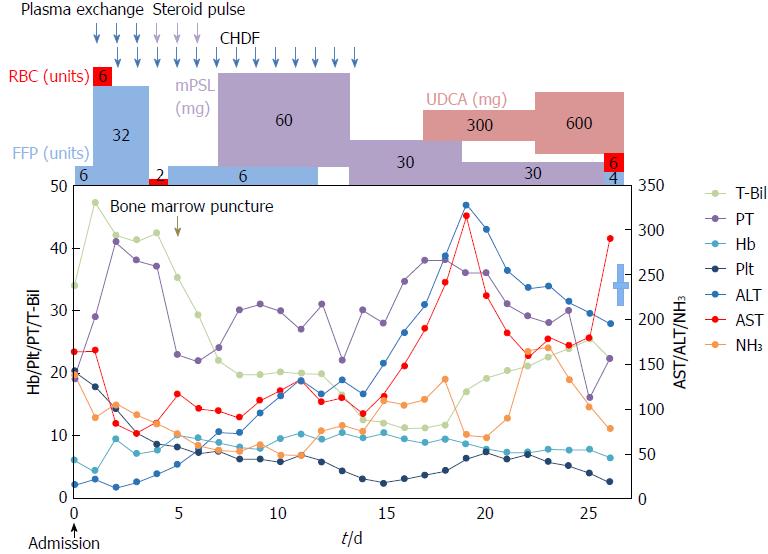
Figure 3 Time courses of laboratory data and treatment.
ALT (U/L): Alanine aminotransferase; AST (U/L): Aspartate aminotransferase; CHDF: Continuous hemodiafiltration; FFP: Fresh frozen plasma; Hb (g/dL): Hemoglobin; mPSL: Methylprednisolone; NH3 (μg/dL): Ammonia; PT (%): Prothrombin time; Plt (×104/μL): Platelet; RBC: Red blood cell; T-Bil (mg/dL): Total bilirubin; UDCA: Ursodeoxycholic acid.
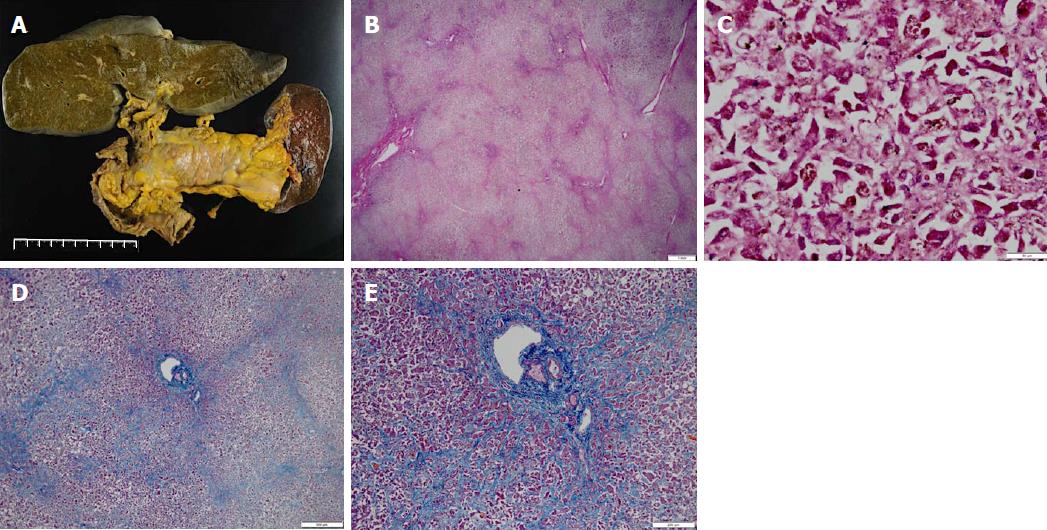
Figure 4 Pathological findings in the liver.
A: The liver (1580 g) was bile stained and soft; B: Low power field: The capsule was wrinkled in HE staining; C: High power field: Microscopically, the liver showed massive necrosis and collapse of the intervening parenchyma in HE staining; D: Low power field in AZAN staining; E: High power field in AZAN staining: Bridging pattern of fibrosis suggestive of chronic liver injury was not found. HE: Hematoxylin-eosin.
- Citation: Amano T, Matsubara T, Nishida T, Shimakoshi H, Shimoda A, Sugimoto A, Takahashi K, Mukai K, Yamamoto M, Hayashi S, Nakajima S, Fukui K, Inada M. Clinically diagnosed late-onset fulminant Wilson’s disease without cirrhosis: A case report. World J Gastroenterol 2018; 24(2): 290-296
- URL: https://www.wjgnet.com/1007-9327/full/v24/i2/290.htm
- DOI: https://dx.doi.org/10.3748/wjg.v24.i2.290


